ROLE
OF
THE
CAROTID
BODY
IN
METABOLIC
DISTURBANCES
MARIA JOÃO RODRIGUES FERREIRA RIBEIRO
Tese para obtenção do grau de Doutor em Ciências da Vida na Especialidade em Biomedicina
ROLE OF THE CAROTID BODY IN METABOLIC
DISTURBANCES
Maria João Rodrigues Ferreira Ribeiro
Orientadora:
Sílvia Margarida Vilares Conde, Professora Auxiliar, NOVA Medical School/ Faculdade de Ciências Médicas da Universidade Nova de Lisboa
Tese para obtenção do grau de Doutor em Ciências da Vida na Especialidade em Biomedicina
Agradecimentos
Finalizada uma etapa particularmente importante na minha vida não podia deixar de
agradecer:
À minha orientadora Professora Doutora Sílvia Vilares Conde, tudo que possa descrever aqui não será de todo suficiente para agradecer tudo o que fez por mim nestes
últimos anos. Obrigada por ser a principal impulsionadora deste meu envolvimento
nesta área tão fascinante, pela qual nutro uma grande paixão. Por estar sempre presente,
pela orientação, pelos ensinamentos, pela confiança, motivação, paciência, e sobretudo
pela amizade que sempre me dedicou. Será sempre mais que a minha orientadora.
À professora Doutora Maria P. Guarino, pela disponibilidade, incentivo, apoio, pelas palavras sempre tão sábias, rigor e por contribuir tão ativamente para a minha formação
profissional. Agradeço também a correção minuciosa deste trabalho.
À professora Doutora Emília Monteiro pela disponibilidade sempre demonstrada. Ao professor Doutor Constâncio Gonzalez e à Professora Doutora Ana Obeso pelo carinho e pelo espírito crítico. Foi um privilégio poder conhecer e aprender como estes
grandes investigadores.
Ao Professor Doutor Pedro Lima pelos ensinamentos do patch clamp, pelo conhecimento, pela boa disposição, assim como ajuda para progressão deste trabalho.
Ao meu grupo de investigação, especialmente à Joana Sacramento, minha parceira desde de sempre, e à Bernardete Melo, pelo apoio incondicional, pela partilha de conhecimento, disponibilidade, boa disposição, espírito de equipa, bons momentos no
laboratório e amizade. Queria agradecer também à Cristiana Ferreira, Jesus Prieto-lloret, Inês Martins assim como ao Duarte Antunes e Inês Faustino pelo apoio, amizade e boa disposição.
Queria agradecer a Aline Marinho, Nádia Grilo, Lucília Diogo, Sofia Pereira e Joana Batuca por me acompanharem desde de início nesta minha viagem, pela disponibilidade, boa disposição, ânimo e por contribuírem tão afincadamente para o
bom ambiente no laboratório. Queria também agradecer aos restantes e mais recentes
Às amizades que nasceram no laboratório e que são para a vida, Fátima Martins e Joana Gaspar pela amizade, pelas risadas, desabafos e horas tão bem passadas, dentro e fora do laboratório. Agradeço também à Inês Lima, pelo carinho e pela disponibilidade.
Ao André Bastos, Marisa Sousa, Clara Patrício e Joana Serrão e pela partilha de conhecimento, ajuda, disponibilidade, animo e pelas horas bem passadas no laboratório
de Fisiologia, durante o “encontro com a célula desejada”.
Aos meus amigos de sempre e para sempre, Filipa Guedes, Diana Silva, Diana Sousa, Mónica Martins, Raquel Ortiga, Ana Plácido, António Borges e Ricardo Fidalgo, pelo carinho e amizade que sempre me dedicaram, muitas das vezes longe fisicamente,
mas sempre perto do meu coração. Por nunca me deixarem cair, mesmo quando me
senti sem forças, por me fazerem sentir tão especial e por nunca me deixarem esquecer
do meu valor. Os amigos são a melhor coisa, e eu tenho os melhores do mundo. Um
agradecimento especial ao João Aranha por tornar esta etapa menos dolorosa, por me descomplicar, por em momento algum deixar de acreditar em mim…e por me fazer
sorrir de uma forma tão simples.
A toda a minha família, que sempre acreditou e continua acreditar em mim e no meu
valor, por me fazerem ver o lado mágico da investigação mesmo quando, por vezes me
sentia “fora de orbita”. Um agradecimento especial aos meus tios babados, Tânia Augusto, Henrique Augusto, Fernanda Ferreira, Toninho Ferreira,minha cunhada
Liliana Valdemar e prima Catarina Augusto.
À memória do meu querido avô Norberto que mesmo não estando entre nós, ilumina todos os meus dias. Por me ter marcado, por ter partilhado comigo toda a sua
experiência de vida, por me fazer sentir uma neta tão especial…Estejas onde estiveres,
sei que estas orgulhoso.
Aos meus pilares, “meu core” familiar, aos meus pais, Leonida Rodrigues e João Ribeiro, ao meu irmão Hugo Ribeiro que por mim se doam por inteiros renunciando aos seus próprios sonhos em prol dos meus. Por todo o amor, compressão, ânimo e
apoio incondicional, que tornou possível este percurso. O melhor de mim, devo a
Um agradecimento final, ao meu querido sobrinho Afonso Ribeiro, com feitio da tia, e à minha afilhada Matilde Santos pelo amor genuíno que me dedicam, pelos sorrisos, por verem em mim um exemplo e simplesmente por existirem.
A todos aqueles que que direta ou indiretamente contribuíram para a realização deste
trabalho, deste sonho que é meu e que hoje se torna uma realidade, o meu muito
OBRIGADA! Uma emoção que jamais será traduzida por palavras….
O trabalho apresentado nesta tese foi realizado no CEDOC – Centro de Estudos de
Doenças Crónicas da FCM|NOVA MEDICAL SCHOOL, da Universidade Nova de
Lisboa e foi financiado por fundos FEDER através do Programa Operacional Fatores de
Competitividade – COMPETE e por Fundos Nacionais através da FCT – Fundação para
a Ciência e a Tecnologia no âmbito do projeto PTDC/SAU-ORG/111417/ 2009. A
candidata realizou o trabalho experimental com o apoio de uma bolsa de investigação da
Thesis Publications
This work originated the following publications:
Ribeiro MJ, Sacramento JF, Guarino MP, Gonzalez C, Monteiro EC, Conde SV (2013) Carotid body denervation prevents the development of insulin resistance and hypertension induced by
hypercaloric diets. Diabetes, 62(8):2905–2916.
Conde SV, Sacramento JF, Guarino MP, Gonzalez C, Obeso A, Diogo LN, Monteiro EC,
Ribeiro MJ (2015) Carotid body, insulin, and metabolic diseases: unraveling the links. Frontiers in Physiology, 5(418): 1-14.
Vera-Cruz P, Guerreiro F, Ribeiro MJ, Guarino MP and Conde SV (2015) Hyperbaric oxygen therapy improves glucose homeostasis in type 2 diabetes patients: a likely involvement of the
carotid bodies. Advance in Experimental Medicine and Biology, 860:221-225.
Conde SV, Ribeiro MJ, Melo BF, Guarino MP and Sacramento JF (2016) Insulin resistance: a new consequence of altered carotid bodychemoreflex? J Physio 2016; doi: 10.1113/JP271684.
Ribeiro MJ, Lima PA, Obeso A, Patricio C, Conde SV (2016) Kv1.3 channels mediate insulin action in the rat carotid body (Submitted to Journal of General Physiology).
Was presented in Scientific Meetings as:
Oral Communications: In International Congresses:
Ribeiro MJ, Gonzalez C, Guarino MP, Monteiro EC, Conde SV (2012) Is insulin a stimulus for carotid body activation? 6th European Congress of Pharmacology, 17 – 20th July, Granada,
Spain.
Ribeiro MJ, Sacramento JF, Monteiro EC and Conde SV (2012) Chronic carotid sinus nerve resection prevents the development of insulin resistance in rats fed with hypercaloric diets. 48th
Annual Meeting of the European Association for the Study of Diabetes (EASD). 1-5th October
Berlin, Germany.
Ribeiro MJ, Lima PA, Obeso A, Patricio C, Gonzalez C, Conde SV (2014) Kv1.3 mediates insulin signaling in the rat carotid body. 19th International Society for Arterial
In National Congresses:
Ribeiro MJ, Gonzalez C, Guarino MP, Monteiro EC, Conde SV (2012) Insulin triggers carotid body activation. XLII Anual Reunion of Portuguese Society of Pharmacology/ XI Reunion of
Clinical Pharmacology, 1-3rd February Lisbon, Portugal.
Ribeiro MJ, Sacramento JF, Gonzalez C, Guarino MP, Monteiro EC, Conde SV (2013). Carotid body is involved in the development of insulin resistance in Wistar rats: an effect
mediated by sympathetic activation. XLIII Reunion of Portuguese Society of Pharmacology/XII
Reunion of Clinical Pharmacology, 6-8th February Oporto, Portugal
Poster Presentations:
In International Congresses:
Ribeiro MJ, Sacramento JF, Guarino MP, Conde SV (2013) Carotid body activity is increased in rat hypercaloric models of insulin resistance and hypertension". 37th Congress of the
International Union of Physiological Sciences, 21-26th, Birmingham, United Kingdom.
Ribeiro MJ, Sacramento JF, Guarino MP, Conde SV (2013) Can carotid sinus nerve resection be a therapeutic approach for the treatment of insulin resistance?" 49th European Association for
the Study of Diabetes (EASD), 23-27th, Barcelona, Spain.
Table of contents
Abbreviations List... I
List of Figures... IV
List of Tables... VII
Resumo... IX
Abstract... XIII
Chapter I – General Introduction... 1
1. Glucose Homeostasis – General Considerations... 3
1.1. The endocrine pancreas and the mechanisms of insulin secretion... 5
1.1.1. Insulin signaling... 7
1.1.2. Glucose transporters... 9
1.2. Whole-body and tissue specific insulin action... 11
1.2.1. Insulin action in the liver... 11
1.2.2. Insulin action in the Skeletal Muscle... 15
1.2.3. Insulin action in the Adipose Tissue... 18
2. Voltage gated potassium channels... 20
2.1. Kv1.3 channels... 22
2.1.1. Kv1.3 channels and glucose homeostasis... 23
3. Diseases Associated with altered glucose metabolism and insulin action.... 24
3.1. Epidemiology of metabolic diseases... 24
3.2. Metabolic Syndrome... 25
3.3.Type 2 Diabetes... 28
4. Sympathetic nervous system and insulin resistance in metabolic disturbances... 30
4.1. Sympathetic overactivity as a cause of insulin resistance... 32
4.2. Hyperinsulinemia contributes to sympatho-excitation... 35
5. The Carotid Body... 37
5.1.1. Oxygen sensing: role of potassium channels... 41
5.2. Carotid body responses to chemical/physiological stimuli: coupling secretion to carotid sinus neural activity... 42
5.3. Chemoreflex initiated by carotid body... 46
5.4. Carotid body and sympathetic mediated diseases... 48
5.5. Glucose sensing in the carotid body... 50
6. Hyperbaric oxygen therapy... 51
6.1. Hyperbaric Oxygen Therapy in Type 2 Diabetes complications... 53
Chapter II – Hypothesis & Aims... 57
2.1 General Aim... 59
2.1.1 Specific aims... 59
Chapter III - Carotid body denervation prevents the development of insulin resistance and hypertension induced by hypercaloric diets... 63
3.1. Introduction and Aim... 64
3.2. Research design and methods... 65
3.2.1. Animals and experimental procedures 65 3.2.2. Evaluation of basal ventilation and ischemic ventilatory responses in animal models of insulin resistance and hypertension... 67
3.2.3. Effect of insulin on spontaneous ventilation in control animals. 67 3.2.4. Measurement of insulin sensitivity and mean arterial pressure... 68
3.2.5.Measurement of plasma insulin, circulating free fatty acids, corticosterone and catecholamines levels and adrenal medulla catecholamines content... 68
3.2.6. Carotid body dopamine and ATP release in response to hypoxia and to insulin... 69
3.2.7. Western Blot analysis of insulin receptor, insulin receptor phosphorylation (phosphor-Tyr 1322) and tyrosine hydroxylase expression... 69
3.3. Results... 70
3.3.1. Carotid body is overactivated in insulin resistant and hypertensive rats... 71
3.3.2 Chronic carotid sinus nerve resection prevents insulin resistance and hypertension... 73
3.3.3 Insulin triggers carotid body activation... 77
3.4. Discussion... 82
Chapter IV- Kv1.3 channels mediate insulin action in rat carotid body ... 87
4.1. Introduction and Aim... 88
4.2. Materials and Methods... 89
4.2.1. Animals and surgical procedure... 89
4.2.2. Electrophysiology Methods... 90
4.2.3. Immunocytochemistry... 91
4.2.4. Western Blot Analysis of Kv1.3 channels and Kv1.3 phosphorylation at tyrosine 135 residue... 92
4.2.5. Effect of insulin and Margatoxin on dopamine release in the carotid body... 93
4.2.6. Statistical Analysis... 94
4.3. Results... 95
4.3.1. Presence of insulin sensitive voltage-activated K+ currents in the rat carotid body... 95
4.3.2. Voltage-activated K+ currents are sensitive to specific Kv1.3 antagonists... 96
4.3.3. Kv1.3 channels underlie the insulin-sensitive K+ currents... 97
4.3.4. Kv1.3 channels are present in type I cells at the rat carotid body... 99
4.3.5. Kv1.3 channels are phosphorylated by insulin... 101
4.3.6. Kv1.3 channels mediate insulin-evoked dopamine release from carotid body type I cells... 102
Chapter V - Hyperbaric oxygen therapy improves glucose homeostasis in type 2
diabetes patients: a likely involvement of the carotid bodies... 109
5.1. Introduction and Aim... 112
5.2. Materials and Methods... 113
5.2.1. Voluntters... 113
5.3. Results... 114
5.4. Discussion... 115
Chapter VI – General Discussion... 117
Chapter VII – Conclusions & Final Considerations... 129
Annexes... 135
I
Abbreviations List 4-AP: 4-aminopyridine
5-HT:5-hydroxytryptamine β-ADR: Beta-adrenoceptors
AACE: American Association of Clinical Endocrinology
ACh: Acetylcholine
ADP: Adenosine diphosphate
AgTx2: Agitoxin-2
AMPK: 5' AMP-activated protein kinase
aPKC: Atypical protein kinase C
ATA: Absolute atmosphere
ATP: Adenosine triphosphate
BMI: Body mass index
BKCa: Large conductance KCa channel
[Ca2+]i: Intracellular calcium
cAMP: Cyclic adenosine monophosphate
CA: Catecholamine
CB: Carotid body
CCA: Common carotid artery
CO: Carbon monoxide
CSN: Carotid sinus nerve
CN: Cyanide
DA: Dopamine
DAPI: 4-6 diamina-2-phenylndole
DOPAC: 3, 4-Dihydroxyphenylacetic acid
EAG: Ether-á-go-go channel
EDTA: Ethylenediamine tetraacetic acid
EGIR: European Group for the study of Insulin Resistance
ENT: Equilibrative nucleoside transporter
ERK: Extracellular signal –regulated kinase
F (1, 6)/ (2, 6) bip: Fructose (1, 6)/ (2, 6) bisphosphate
F-6-P: Fructose-6-phosphate
FbiPase: Fructose (1, 6)/ (2, 6) biphosphatase
FFA: Free fatty acid
FPG: Fasting plasma glucose
FITC: Fluorescein isothiocyanate
G-1-P: Glucose -1-phosphate
G1Pase: Glucose-1-phosphatase
II
G6Pase: Glucose 6-phosphatase
GIP: Glucose dependent insulinotropic polypeptide
GK: Glucokinase
GLP-1: Glucagon-like peptide 1
GLUT: Glucose transporter
GLUT1-13: Glucose transporters 1 to 13
GP: Glycogen phosphorylase
GS: Glycogen synthase
GSK3: Glycogen synthase kinase 3
GTP: Guanosine-5'-triphosphate
HbA1c: Glycated haemoglobin
HBOT: Hyperbaric Oxygen Therapy
HDL: High density protein
HF: High fat
HMIT: Proton driven myoinositol transporter
HRP: Horseradish peroxidase
HSu: High sucrose
HT: Hypertension
IDF: International Diabetes Federation
IGT: Impaired glucose tolerance
IL-6: Interleukin-6
IL-1β: Interleukin 1beta
InsR: Insulin Receptor
IR: Insulin resistance
IRS: Insulin receptor substrate protein
IRS-1: Insulin receptor substrate 1
IRS-2: Insulin receptor substrate 2
ITT: Insulin tolerance test
JNK: C jun amino terminal kinase
KATP: ATP-sensitive K+ channel Kir: Inward-rectifier channel
Kv: Voltage-gated K+ channel
KCa: Ca2+-activated channel
KITT: Constant of insulin tolerance test LDL: Low-density protein
MAP: Mean arterial pressure
MAPK: Mitogen activated protein kinase
MgTx: Margatoxin
mRNA: messenger RNA
III
MSNA: Muscle sympathetic nerve activity
NCEP: ATPIII: National Cholesterol Education Program Adult Treatment Panel III
NDGU: Non-insulin-dependent glucose uptake
NST: Nucleus solitary tract
OB: Olfactory bulb
OCC: Occlusion of common carotid
PAI-1: Pasminogen activator inhibitor 1
PCA: Perchloric acid
PBS: Phosphate-buffered saline
PDK1: Phosphoinositide-dependent kinase-1
PEP: Phosphoenolpyruvate
PEPCK: Phosphoenolpyruvate carboxykinase
PFK1: Phosphofructose-1-kinase
PI3K: 1A phosphatidylinositol 3-kinase
PIP3: Phosphotidylinositol (3, 4, 5) – triphosphate
PK: Pyruvate kinase
PKA: Protein kinase A
PKB: Protein kinase B
SCH: Src homology
SDS: Dodecyl sulfate
SKCa, Small conductance KCa channel
SGLT: Sodium-driven sugar co-transporter
SHK: Stichodactyla toxin
SUR: Sulfonylurea receptor
T2D: Type 2 Diabetes
TEA: Tetreathylammonium
OGTT: Oral glucose tolerance test
OSA: Obstructive Sleep Apnea
ROS: Reactive Oxygen Species
TASK: Tandem-pore domain K+ channel
TBST: Tris-buffered saline tween
TCA: Tricarboxylic acid
TEA: Tetraethylammonium
TNFα: Tumor necrosis factor alfa
IV
List of Figures
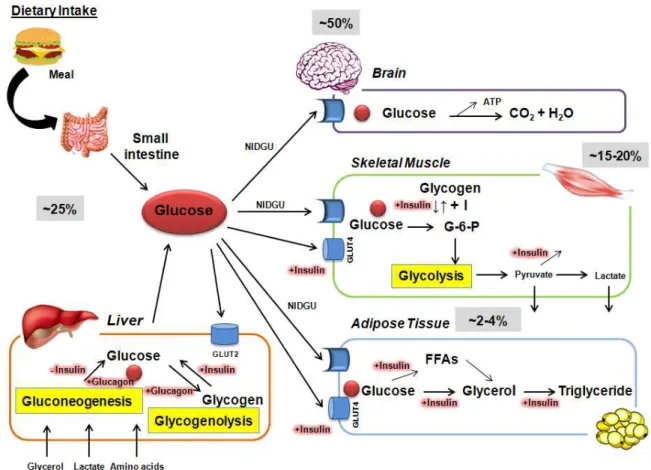
Figure 1.1: Overview of glucose disposal in target organs. Routes of glucose disposal
after a meal ingestion and in a fasting state 4
Figure 1.2: Schematic representation of islet and pancreas cell types
5 Figure 1.3: Insulin secretion in pancreatic β-cell
7 Figure 1.4: Insulin signaling pathways
9 Figure 1.5: Glucose metabolism in the hepatocytes
13 Figure 1.6: Classification of K+ ion channels, based on the sequence homology
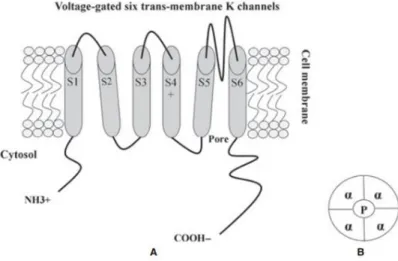
20 Figure 1.7: Schematic representation of the membrane topology and main features of
the voltage activated K+ (Kv)channel 21
Figure 1.8: Diagram of insulin resistance as a core feature for the development of type 2 diabetes and a risk factor for both cardiovascular and metabolic complications 27 Figure 1.9: Metabolic alterations during progression of impaired glucose tolerance
and subsequent type 2 diabetes onset 29
Figure 1.10: The effect of sympathetic nervous system activation and action in target
organs through noradrenaline release 31
Figure 1.11: Activation of sympathetic nervous as a consequence of metabolic syndrome. Several factors present in subject with metabolic syndrome activate the
sympathetic activation 32
Figure 1.12: Theories linking hyperinsulinemia and sympathetic nervous system
activation 33
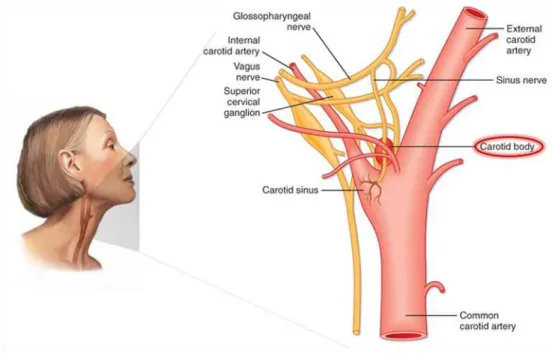
Figure 1.13: The Carotid body (CB) localization and innervations
38 Figure 1.14: Basic cellular arrangement of the carotid body.
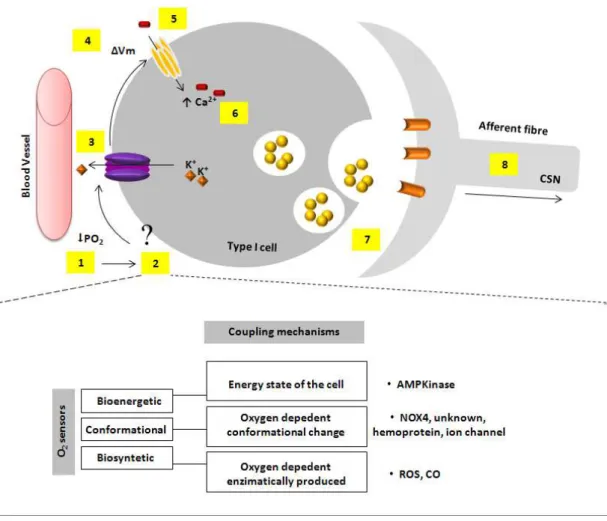
39 Figure 1.15: Oxygen transduction cascade and putative nature of O2 sensor(s) in
carotid body (CB) cells 40
Figure 1.16: Simplified schematic diagram of the hypoxic transduction cascade and the well characterized neurotransmitters release from the carotid body (CB) in
V
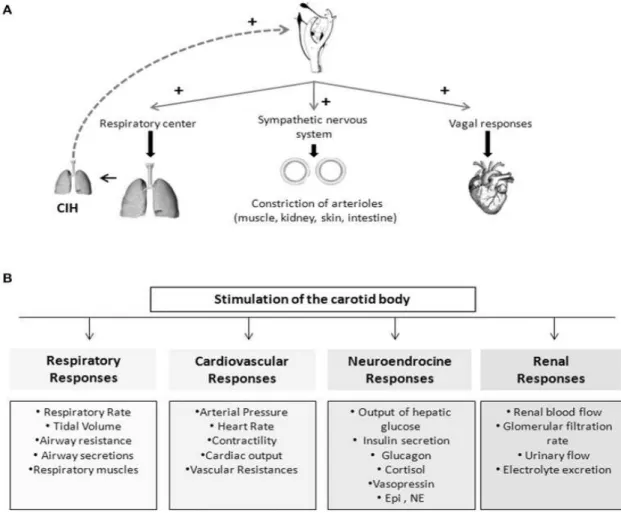
Figure 1.17: Schematic representation of the chemoreflexes elicited by the carotid
bodies (CBs) 48
Figure 1.18: The two general styles of hyperbaric chambers used in clinical practice, the monoplace chamber (one person) and multiplace chamber (more than one person) 52 Figure 3.1: Representation of experimental timeline after surgical procedures
66 Figure 3.2: Surgical procedure made in control anesthetized rats before evaluation of
ventilation 67
Figure 3.3: Carotid body (CB) activity is increased in rat models of insulin resistance
(IR) and hypertension (HT) 72
Figure 3.4: Carotid sinus nerve (CSN) bilateral resection prevents insulin resistance (IR) and hypertension (HT) in high fat (HF) and high sucrose animal (Hsu) models 74 Figure 3.5: Carotid sinus nerve (CSN) bilateral resection prevents sympathoadrenal overactivation in high fat (HF) and high sucrose (Hsu) animal models 77 Figure 3.6: Insulin receptors (InsRs) are present in the carotid bodies (CBs) and its
phosphorylation increases in response to insulin 78
Figure 3.7: Insulin increases the neurosecretory responses in the carotid bodies (CBs). 79 Figure 3.8: Insulin increases ventilation through a carotid body (CB) mediated effect
81 Figure 4.1: Voltage-activated outward K+ currents in carotid body (CB) type I cells
95 Figure 4.2: Effect of the Kv1.3 blockers on voltage activated outward K+ currents
carotid body (CB) type I cells 97
Figure 4.3: Margatoxin (MgTx) sensitive currents (Kv1.3) underlie the insulin
sensitive K+ currents 98
Figure 4.4: Immunocytochemical demonstration of Kv1.3 channels presence in
carotid body (CBs) type I cells 100
Figure 4.5: Kv1.3 activity, measured as its phosphorylation in tyrosine motifs,
increases in response in insulin in the carotid body (CB) 102
Figure 4.6: Kv1.3 channels mediate insulin-induced dopamine (DA) release from the
carotid body (CB) 103
Figure 5.1: Effect of 20 sessions of hyperbaric oxygen therapy (HBOT) in fasting
VI
(IR) and glucose deregulation and hypertension (HT)
Figure A1: The glycolysis and gluconeogenesis pathways and enzymes involved
138 Figure A2: The Tricarboxylic Acid Cycle and chemical reactions with the enzymes
139 Figure A3: Glycogenesis reaction
140 Figure A4: Reactions involved in glycogen breakdown.
141 Figure A5: Free fatty acids (FFAs) metabolism
VII
List of Tables
Table 1.1: The criteria for metabolic syndrome (MS) diagnose according to the
International Diabetes Federation (IDF) 26
Table 1.2: Different K+ channels identified in carotid body (CB) type I cells in
different species 42
Table 3.1: Effect of carotid sinus nerve chronic (CSN) resection on fasting plasma glucose, plasma insulin, serum free fatty acids (FFAs) and corticosterone levels in
control, high fat (HF) and high sucrose (HSu) diet rats 76
Table 5.1: Comparison between demographic and baseline variables in controls and
type 2 diabetes (T2D) patients 114
Table A1: Resume of the metabolic pathways of carbohydrate metabolism and related
tissues 143
.
IX
Resumo
A resistência à insulina (IR) é uma condição patológica característica de doenças de
elevada prevalência na atualidade, tais como a Síndrome Metabólica (MS) e a Diabetes
Tipo 2 (T2D). Em associação com a obesidade, é uma das principais causas que leva ao
desenvolvimento de distúrbios metabólicos e suas co-morbilidades, tais como a
hipertensão arterial (HT), a dislipidemia e as doenças cardiovasculares. Atualmente, é
consensual que a ativação crónica do sistema nervoso simpático desempenha um papel
crucial no desenvolvimento da IR, no entanto, ainda permanece por esclarecer qual o
mecanismo responsável pela sobreactivação crónica simpática nos distúrbios
metabólicos. Na apneia obstrutiva do sono (OSA), um dos mecanismos que induz o
desenvolvimento de HT centra-se na ativação do corpo carotideo (CB) e subsequente
ativação do sistema nervoso simpático. Os CBs são os principais quimiorreceptores
periféricos, localizados na bifurcação da artéria carótida comum (CCA), sendo sensíveis
a variações na PO2 (hipóxia), PCO2 (hipercapnia), pH (acidose) e temperatura. Quando
ativados, as células quimiorrecetoras (tipo I) respondem às variações de gases arteriais
libertando neurotransmissores que ativam as terminações sensitivas do nervo do seio
carotídeo (CSN). A atividade do CSN é integrada ao nível do tronco encefálico
traduzindo-se num aumento da frequência respiratória (hiperventilação), assim como na
normalização da pressão arterial através da ativação do sistema nervoso simpático. Nos
últimos anos o CB foi proposto como um sensor de glucose, como tendo um papel na
regulação da homeostasia energética, sugerindo desta maneira uma importância
adicional fora do seu contexto clássico.
A presente dissertação assenta em duas hipóteses de trabalho: 1) que uma sobre ativação
crónica do CB está na génese do desenvolvimento de IR e HT, através da ativação do
sistema nervoso simpático; e 2) que a insulina é um estímulo para ativação do CB,
desempenhando a sua ação através dos canais dependentes de voltagem do subtipo 1.3
(Kv1.3) presentes nas células tipo I. Assim, o objetivo geral do presente trabalho foi
estudar qual o papel do CB no desenvolvimento da IR e distúrbios metabólicos
associados.
No capítulo I são introduzidos conceitos gerais sobre a homeostasia da glucose, focando as patologias que têm por base a desregulação desta homeostasia, como a MS e
X
nervoso simpático e as alterações metabólicas. Para além disso, descreveu-se de uma
maneira breve os conceitos chave da função do CB, assim como os seus novos
potenciais papéis fisiológicos. Por fim, a oxigeno terapia hiperbárica (HBOT) e as suas
aplicações foram abordadas.
No capítulo II encontram-se sumariados os objectivos do trabalho.
No capítulo III estudou-se o papel do CB no desenvolvimento de IR e HT, utilizando-se ratos Wistar submetidos a dois tipos de dietas hipercalóricas, a dieta enriquecida em
lípidos (HF) para obtenção de um modelo de obesidade com IR e HT, e a dieta
enriquecida em sacarose (HSu),para obter um modelo não obeso com IR e HT. Ambos
os modelos patológicos foram comparados com ratos submetidos a uma dieta
normocalórica. Observou-se que atividade do CB está aumentada nos modelos animais
patológicos o que se traduziu num aumento da ventilação basal e da ventilação em
resposta à hipóxia isquémica. Observou-se que a libertação de dopamina (DA) e a
expressão da enzima tirosina hidroxilase (TH) no CB se encontram aumentadas nos
ratos HF e HSu. Demonstrou-se também, que o CB está envolvido na génese da IR e da
HT, uma vez que a desnervação crónica bilateral do CSN preveniu o desenvolvimento
de IR e HT, da hiperglicemia e insulinemia em jejum, do aumento dos ácidos gordos
livres (FFAs) e dos níveis das catecolaminas (CAs) circulantes e presentes na medula
adrenal. Adicionalmente, constatou-se que a insulina ativa o CB sendo capaz de iniciar
uma reposta neurosecretora avaliada pelo aumento do cálcio intracelular ([Ca2+]i) e pelo aumento da libertação de ATP e dopamina (DA) que se traduziu num aumento da
ventilação espontânea. Observou-se também que a ação da insulina no CB ocorre via
recetores de Insulina (InsR), uma vez que os InsR presentes no CB são fosforilados na
presença de insulina.
No capítulo IV foi investigado o papel dos canais Kv1.3, como mediadores da ação da insulina no CB. Neste capítulo descreveu-se a presença de correntes de K+ dependentes de voltagem sensíveis à insulina, que possuem um perfil farmacológico característico de
canais Kv1.3, uma vez que a Margatoxina (MgTx) e o ShK-Dap22 (bloqueadores específicos dos canais Kv1.3) mimetizam a ação da insulina nestas correntes.
Observou-se por imunocitoquímica a preObservou-sença de canais Kv1.3 nas células tipo I, Observou-sendo estes
fosforilados na presença de insulina, o que sugere que a fosforilação é um dos
XI
disso, constatou-se que os canais Kv1.3 estão envolvidos na resposta neurosecretora
induzida pela insulina, visto que a MgTx mimetizou o efeito da insulina na libertação de
DA do CB.
No capítulo V encontra-se descrito o estudo clínico, no qual foi avaliado o efeito da HBOT na tolerância à glucose. Para tal, foram recrutados voluntários não diabéticos e
com T2D com indicação para terapêutica com HBOT, no centro português de Medicina
Subaquática e Hiperbárica e submetidos a 20 sessões de HBOT. Observou-se que a
HBOT melhora a glicemia em jejum e a tolerância à glucose em doentes diabéticos, sem
quaisquer alterações nos voluntários não diabéticos.
Por fim, no capítulo VI efetuou-se uma discussão geral e integrada de maneira a posicionar o presente trabalho no contexto científico atual. Em conclusão, os dados
apresentados neste trabalho clarificam o papel do CB na patogénese da IR e HT e
sugerem que o CB pode ser um alvo terapêutico promissor para intervenção na T2D,
XIII
Abstract
Insulin Resistance (IR) is a pathogenic feature present in highly prevalent diseases, like
metabolic syndrome (MS) and Type 2 Diabetes (T2D). Together with obesity they are
the major causes that predispose and/or trigger metabolic dysfunctions that contribute to
the development metabolic disturbances and related comorbidities, such as,
hypertension (HT), dyslipidemia and other cardiovascular diseases. It is now becoming
consensual that chronic sympathetic nervous system activation plays a role in the
development of IR, however the mechanisms leading to its sustained activation in
metabolic disturbances are still unknown. In obstructive sleep apnea (OSA) several
reports have linked HT and the increased sympathetic nervous system activity with the
overactivation of carotid body (CB). The CB is a major peripheral chemoreceptor organ
that sense changes in blood O2, (hypoxia) CO2, (hypercapnia) and pH levels (acidosis).
Hypoxia and acidosis/hypercapnia activate CB type I cells, which respond by releasing
neurotransmitters in order to increase the action potential frequency in their sensory
nerve, the carotid sinus nerve (CSN). The CSN activity is integrated in brainstem to
induce a fan of respiratory reflexes aimed, primarily to normalize the altered blood
gases via hyperventilation and to regulate blood pressure and cardiac performance via
activation of the sympathetic nervous system. Recently, the CB was proposed to be a
glucose sensor and to be implicated in the regulation of energy homeostasis control,
therefore demonstrating new roles for this organ outside its classical function.
Herein the hypothesis that CB overactivation is involved in the genesis of metabolic
dysfunction through sympathetic nervous system activation was investigated.
Additionally, the hypothesis that insulin stimulates the CB via Kv1.3 channels present
at type I cells was studied. The general aim of this work was to establish the role of CB in the development of IR and related metabolic dysfunctions.
Chapter I introduces general concepts of glucose homeostasis and the diseases where glucose metabolism is deregulated, such as, MS and T2D. Additionally the link between
sympathetic nervous system and dysmetabolism is focused herein. Moreover, key
concepts of CB function as well as its potential new physiological roles are debated.
Hyperbaric oxygen therapy (HBOT) and its applications are introduced.
XIV
In chapter III we have investigated the role of CB in the development of IR and HT. For that, we have used Wistar rats submitted to two hypercaloric diets: the high-fat (HF)
diet, which is a combined model of IR, HT and obesity and the high-sucrose (HSu) diet,
which is a lean model of IR and HT. Pathological animal models have been compared
with aged-matched controls. In this chapter we have demonstrated that CB activity is
increased in pathological animal models, since CB-mediated basal ventilation and
ventilation in response to ischemic-hypoxia were increased, as well as the CB type I cell
function-assessed both as hypoxia-evoked release of dopamine and tyrosine hidroxilase
(TH) expression. It was also demonstrated that CSN bilateral resection prevented
diet-induced IR and HT, as well as increased fasting glycemia, fasting insulinemia, free fatty
acids (FFAs) and sympathoadrenal activity. Additionally, it was shown that insulin
triggers CB activation through the presence of insulin receptors (InsR) that were
phosporylated in the presence of insulin allowing the CB neurosecretory response,
measured as the increase in [Ca2+]i and the release of ATP and dopamine that is transduced into an increase in ventilation.
In chapter IV the role of Kv1.3 channels as effectors of insulin action on rat CB was studied. Carotid body type I cells and whole-CB from animals submitted to
standard-diet were used. We demonstrated that CB type I cells exhibit insulin sensitive voltage
activated K+ currents, that are mediated by Kv1.3 channels since Margatoxin (MgTx) and ShK-Dap22 (specific blockers to Kv1.3 channels) inhibit voltage K+ activated currents and the action of insulin. Additionally, we have observed that Kv1.3 channels
were expressed in CB type I cells and showed that phosporylation could be one of the
mechanisms by which insulin modulates the Kv1.3 activity in rat CB. Moreover, we
have found that Kv1.3 channels are involved in the release of catecholamines (CAs
from rat CB, since MgTx mimics the effect of insulin on the release of CAs.
The chapter V presents a clinical study, where the effect of HBOT on glucose tolerance in T2D patients was evaluated. T2D and non-diabetic volunteers, both with indication
for HBOT have been recruited at the Subaquatic and Hyperbaric Medicine Center of
Portuguese Navy and submitted to 20 sessions of HBOT. We demonstrated that HBOT
ameliorates fasting glycemia and glucose tolerance in T2D patients, without altering
XV
Finally, a general and integrated discussion is presented in chapter VI to positioning the work developed in the present work into the current scientific context. In conclusion
the data presented herein clarify the role of the CB in the pathogenesis of diet-induced
3
1. G
LUCOSEH
OMEOSTASIS–
G
ENERALC
ONSIDERATIONSAmong all the nutrients that humans obtain by feeding, glucose represents a large
proportion of carbohydrates present in diet, and plays a central role in energy
metabolism to produce adenosine triphosphate (ATP). Glucose can be obtained from the
dietary intake in gastrointestinal tract and by the endogenous production that occurs,
mostly, in the liver and also in the kidney. In the first setting, glucose results from
enzymatic digestion of more complex carbohydrates (lactose, sucrose), whereas the
endogenous production results from a series of complex biochemical reactions named
glycogenolysis (breakdown of glycogen to glucose) and gluconeogenesis (conversion of
pyruvate derived from precursors, including lactate and amino acids - specially alanine
and glutamine - to glucose) (Gerich, 1993; Saltiel & Kahn, 2001) (see annexes V and
II). Once in the bloodstream glucose is taken up by target organs, namely the adipose
tissue and skeletal muscle in the periphery, through the action of specific transporters,
the glucose transporters (GLUTs) (Wilcox et al., 2005; Zhao & Keating, 2007) (Figure 1.1). Inside the cell, glucose is phosphorylated and follows different routes: it can be stored as glycogen (in the liver and skeletal muscle) (see annex IV) or it can be
metabolized through glycolysis [conversion of glucose-6-phosphate (G-6-P) to
pyruvate), which in turn can be reduced to lactate under anaerobic conditions or
oxidized, via the tricarboxylic acid (TCA), also known as Krebs cycle, resulting in
greater amounts of ATP] (Gerich, 2000; Saltiel & Kahn, 2001) (see annexes I and III).
Plasma glucose concentration is a function of the rate of glucose entering the
bloodstream, through intestinal glucose absorption or endogenous glucose production
mainly by the liver, balanced by the rate of glucose removal from bloodstream due to its
utilization by tissues (Gerich, 2000). The process of maintaining glycemia at a
steady-state level is called glucose homeostasis (DeFronzo, 1988). The glycemia need to be
upheld within narrow limits by two main reasons: to sustain the brain and the peripheral
tissues with their nutrional requirements and also to avoid the toxic effects related to the
increases of glycemia (Szablewski, 2011). In healthy humans, glycemia is maintained
within a tight physiological range between 3.9 to 5.6 mM (70.2 - 100.8 mg/dl), despite
the variations in plasma glucose after a meal, during fasting and also in response to
exercise (Roden & Bernroider, 2003). Although with some variations, several studies
suggested for any given individual normal blood glucose levels post-absorptively
4
stores) are strictly maintained within ±0.3 mM (5 mg/dl) (DeFronzo, 1983; Kopf et al.,
1973). Even in the post-prandial state, blood glucose concentrations increase only 1 to 2
mM, and rarely, if ever, exceed 7.8 to 8.4 mM (140-150 mg/dl) (DeFronzo et al., 1983;
Kopf et al., 1973). This is possible due to the cooperation and integration of several
physiological systems (such as the sympathetic nervous system and the endocrine
system) that have mechanisms that are able to maintain glucose homeostasis (Aronoff,
2004; Roden & Bernroider, 2003). The failure of these mechanisms can lead to
hyperglycemia or hypoglycemia and subsequent clinical complications that are
characteristic of metabolic disorders, such as diabetes and subsequent cardiomyopathy,
angiopathy, nephropathy, retinopathy and stroke (Villeneuve & Natarajan, 2010).
5
1.1. The endocrine pancreas and the mechanisms of insulin secretion
The endocrine pancreas is a major regulator of glucose homeostasis by releasing
hormones directly implicated in metabolic pathways in the insulin sensitive organs,
located in the periphery (skeletal muscle, adipose tissue and liver) (Aronoff, 2004;
Gerich, 2003). The pancreas is constituted by four major cell types in the islets of
Langerhans: the β cells, responsible for the production of insulin, the α cells for the
production of glucagon, the δ cells for the production of somatostatin and the F (or PP)
cells, responsible for the production of pancreatic polypeptides (Figure 1.2). Insulin and glucagon respond oppositely to changes in glycemia: while hypoglycemia conditions
induce the release of glucagon by α-cells, β-cells release insulin when glucose levels
increase (Nadal et al., 1999; Quesada et al., 2006).
Figure 1.2: Schematic representation of islet and pancreas cell types. The endocrine pancreas consists of four major cell types α, β, δ and PP cells which are organized in compact islets secrete hormones into bloodstream, namely insulin and glucacon. The exogenous pancreas is composed of pancreatic acinar cells and duct cells that produce digestives enzymes. Adapted from (Efrat & Russ, 2012).
Insulin is an anabolic hormone with 51 amino acids (in humans) with a molecular
weight of 5.8 kDa, organized in two polypeptide chains, an A chain of 21 amino acids
and a B chain of 30 amino acids linked by two disulfide bridges (De Meyts, 2004). This
hormone is synthesized in β-cells from a single amino acid chain precursor (proinsulin)
that is packaged into vesicles in the Golgi apparatus. During the maturation of the
6
into the bloodstream in equimolar amounts (De Meyts, 2004; Fu et al., 2013;
Licinio-Paixão et al., 1986; Polonski, 1995). C-peptide possess a huge clinical importance in the
measurements of insulin secretion in patients with diabetes, since its half-life is longer
than insulin half-life, 20-30 minutes (min) versus 3-5 min respectively (Licinio-Paixão
et al., 1986; Polonsky, 1995).
Insulin secretion can be regulated by several nutrients, such as glucose, arginine and
lipids, by hormones, such as incretins, and via neural signaling by the cholinergic
pathway, -the vagal axis- and by the adrenergic pathways through α2-adrenoceptors
(Wilcox, 2005). In response to glucose, insulin is released by the pancreas through
biphasic secretion (Bratanova-Tochkova et al., 2002; Polonsky et al., 1988). This
biphasic pulsatile pattern consists of an initial rapid phase (first phase) followed by a
less intense but more sustained (second phase) release of the hormone
(Bratanova-Tochkova et al., 2002; Polonsky et al., 1988) (Figure 1.3A). In type 2 diabetic patients the biphasic patterns is impaired, the first phase of insulin release is missing while the
second phase is present, however the second phase can be deficient in severe type 2
diabetes (T2D) (Del Prato et al., 2002; Guilausseau et al., 2008). Regarding the
pulsatile pattern of insulin secretion this is maintained in T2D patients, with a similar
number of pulses like in healthy subjects, however in post-prandial state the pulses are
irregular, less frequent and with lower amplitude (Polonsky et al., 1988).
The presence of circulating glucose leads to a quick uptake of glucose via glucose
transporters 2 (GLUT2) by the β-cells that results in an increase in the cytoplasmatic
ATP/adenosine diphosphate (ADP) ratio. This increase of ATP in cytosol leads to
closure of ATP–dependent potassium (KATP) sensitive channels and subsequent
depolarization, allowing the opening of voltage gated Ca2+ channels and Ca2+ influx into the cell causing exocytosis of insulin from granules (Ascroft, 2005 for review) (Figure 1.3B). In addition to this KATP channel –dependent pathway, which triggers insulin
secretion, there is also a KATP channel–independent pathway that amplifies the effects of
Ca2+ on exocytosis, being this pathway responsible for the second phase of insulin secretion (Henquin, 2000). The second phase of insulin secretion is thought to be
augmented of by many factors such as the incretins hormones: glucagon-like peptide 1
(GLP-1) and glucose dependent insulinotropic polypeptide (GIP), and is termed the
amplifying pathway (Bratanova-Tochkova et al., 2002; Wilcox et al., 2005). Although
7
increased levels of both GLP-1 and GIP, released by gut cells (Aronoff, 2004; Taminato
et al., 1977).
Figure 1.3: Insulin secretion in pancreatic β-cell. A) Characteristic biphasic secretion in response to glucose (11mM), that consists in a rapid first phase followed by a slower second phase. B) Schematic representation of insulin mechanism secretion upon glucose stimulation. SUR: sulfonylurea receptor. Adapted from Rorsman, (2000).
In situations where the blood glucose concentration decreases, a catabolic
counter-regulatory hormone called glucagon is released by the pancreas stimulating hepatic
glucose production through activation of glycogenolysis and gluconeogenesis in order
to raise glucose levels (Jiang & Zhang, 2003). Glucagon activates G proteins coupled
receptor, activating the hepatic adenyl cyclase leading to an increase in cyclic adenosine
monophosphate (cAMP) levels, which activates protein kinase A (PKA) inducing an
increased breakdown of glycogen and an increase in plasma glucose, in turn
phosphorylates the enzymes involved in liver glycogenolysis (Burcelin et al., 1996). In
addition, glucagon stimulates the release of free fatty acids (FFAs) that are taken by the
liver and shunted towards β-oxidation and subsequent formation of ketoacidosis, instead
of being guided to the synthesis of triglycerides (Carlson et al., 1993).
1.1.1. Insulin signaling
Insulin regulates glucose, lipid and energy homeostasis, predominantly via its action on
the liver, skeletal muscle and adipose tissue, the insulin sensitive tissues. The action of
insulin is initiated by the binding of the protein to the extracellular portion of the insulin
8
surface receptors that possess an intrinsic tyrosine kinase activity, called tyrosine kinase
receptors. The InsR is composed by two extracellular α-subunits and two
transmembrane β-subunits linked by disulfide bonds. When insulin is not present, the
unbound extracellular α-subunits inhibit the intrinsic intracellular tyrosine kinase (White
& Kahn, 1994). In contrast, when insulin binds to one of the α-subunits this inhibition is
removed, and the adjacent intracellular β-subunit is autophosphorylated at its tyrosine
residues of the regulatory domain (Lee et al., 1993). Subsequently, the
autophosphorylation of the tyrosine residues allows the InsR to activate a panel of
intracellular InsR substrate proteins (IRS) (Pessin & Saltiel, 2000; Sun et al., 1995;
White, 1998). These IRS proteins act as InsR specific docking proteins that create
recognition sites for additional effector molecules with Src homology (SCH) domains,
such as the p85 regulatory subunit of the type 1A phosphatidylinositol 3-kinase (PI3K)
(Pessin & Saltiel, 2000; Saltiel & Kahn, 2001). These IRS docking proteins serve
multiple functions, as they allow the amplification of the InsR signal, the dissociation of
the intracellular signaling cascade from the membrane bound InsR, to expand the
number of pathways that can be regulated through one InsR, and the integration of
multiple metabolic signals (Hotamisligil & Spiegelman, 1994; White & Kahn, 1994).
The insulin signaling cascade encompasses several known downstream intermediates
(Krüger et al., 2008) involved in three primary pathways: the PI3K – Akt/protein kinase
B (PKB), the Cb1/CAP pathway, and the mitogen activated protein kinase (MAPK)
cascade (Saltiel & Kahn, 2001) (Figure 1.4). The PI3K pathway appears to play the biggest role in the maintenance of the whole body glucose homeostasis. However, the
MAPK and Cb1/CAP pathways are also of key importance for the maintenance of
glucose homeostasis. The PI3K plays a significant role in many of the metabolic
processes associated with insulin including: glucose uptake, growth factors, protein
synthesis, and glycogen synthesis (White, 1998). Insulin stimulates glucose uptake via
PI3K pathway through multiple steps including: activation of IRS by the InsR, binding
of IRS to PI3K regulatory subunit p85, phosphorylation of phosphotidylinositol (3, 4,5)
– triphosphate (PIP3), activation of atypical protein kinase C (aPKC) and Akt through
phosphoinositide-dependent kinase-1 (PDK1), and finally the translocation of glucose
transporters 4 (GLUT4) to the plasma membrane to promote cellular glucose uptake
(Saltiel & Pessin, 2002, Holman et al, 1994; Martin et al,.1998). Insulin also stimulates
MAPK activity by activating guanosine-5'-triphosphate (GTP)-binding proteins that
9
variants of the MAPK signaling cascade that arise as the signal navigates through these
kinases tiers that include: extracellular signal –regulated kinase (ERK),c jun amino
terminal kinase (JNK), p38 kinase and BMK signaling pathways (Shaul & Seger, 2007).
Figure 1.4: Insulin signaling pathways. Activation of insulin receptor (InsR) by insulin initiates a cascade of phosphorylation events that induce several different biological effects. The activation of InsR tyrosine kinases recruits and phosphorylates several substrates among theses, insulin receptor substract 1-4 (IRs1-4) and the src homology (SCH) and APS adaptor proteins, all of which provide specific docking sites for recruitment of other downstream signaling proteins, leading to the activation of both phosphatidil inositol-3-kinase (PI3K) → Akt signaling cascade and Ras→ MAPKs. The activation of (PI3K) → Akt signaling cascade mediates the effect of insulin on metabolism and pro-survival and Ras→ MAPKs mediates the effect on mitogenesis and cell growth. Assigned and adapted from (Veloso, 2015).
1.1.2. Glucose transporters
Glucose molecules cannot cross the plasma membrane due to the hydrophobic nature of
the membrane therefore requiring specific transporters to enter into cells. There are two
families of proteins involved in glucose transport through cell membranes: the family of
sodium-driven sugar co-transporters (SGLTs) (Uldry et al., 2002) that are involved in
the absorption and reabsorption of glucose from food, in the gastrointestinal tract, and
10
homeostasis (Mueckler, 1994; Zhao & Keating 2007). These transporters promote the
facilitated diffusion of glucose, a process that is not energy dependent and that follows
Michaelis-Menton kinetics, which inversely reflects the affinity to glucose
(Cornish-Bowden, 2015). In humans, the GLUTs family comprises 14 isoforms that have high
conserved sequence and share common structural characteristics, such as the 12
transmembrane domains, the N- glycosylation site on the first or fifth loop, and the
sugar transporters signatures (Sun et al., 2012; Zhao & Keating 2007). Despite the well
conserved structure among GLUT isoforms, individual transporters have distinct tissue
distributions and biochemical properties, being divided in three subclasses (I-III) based
on the phylogenetic analysis of their sequence and characteristic elements (Joost &
Thorens 2001; Joost et al., 2002; Mueckler & Thorens, 2013). The class I, characterized
in terms of structure, function and tissue, comprises GLUT1 to 4 transporters,
(including the gene duplication of GLUT3, which is GLUT14), has a huge importance
in whole-body glucose homeostasis under physiological, and especially disease
conditions. The class II contains the “odd” isoforms GLUT5, 7, 9 and 11 the isoforms
GLUT6, 8, 10, 12, and the GLUT13, also known by proton driven myoinositol
transporters (HMIT) belongs to class III (Joost & Thorens, 2001; Joost et al., 2002).
Glucose transporter 1 and GLUT3 are the isoforms responsible for basal or constitutive
glucose uptake, being GLUT1 the transporter that mediates glucose transfer across the
blood brain barrier (Brockman, 2009); whereas GLUT3 is a neuron-specific glucose
transporter with greater expression in human and rat brain (Bell et al., 1990; Haber et
al., 1993; McCall et al., 1994). GLUT2 is expressed in the liver, brain,
insulin-producing pancreatic β-cells, kidney and intestine absorptive epithelial cells (Fukumuto
et al., 1988; Zhao & Keating, 2007 for review). In pancreatic β-cells GLUT2 plays a
role in the glucose-sensing mechanism, while in the liver it is involved in the
bi-directional transport of glucose under hormonal control (Fukumuto et al., 1988; Orci et
al., 1989; Johnson et al., 1990; Kellet & Brot-Laroche, 2005; Wright, 2013). GLUT4 is
highly expressed in skeletal muscle and adipose tissue. This transporter display a
characteristic that makes it unique, since it is the only transporter that has an
intracellular localization in unstimulated states, being acutely translocated to the plasma
membrane in response to insulin (Wood & Trayhurn, 2003) and other stimuli (Bryant et
al., 2002; Czech & Buxton 1993). Briefly, under insulin stimulation, GLUT4 undergoes
a rapid translocation from the intracellular location to the cell membrane increasing
11
1.2. Whole-body and tissue specific insulin action
Insulin is the pivotal hormone with extensive effects on whole body metabolism since it
regulates cellular energy supply and macronutrient balance, directing processes in the
fed state, being essential for the intracellular transport of glucose into insulin-dependent
tissues, such as skeletal muscle and adipose tissue (Burks & White, 2001). In the
presence of abundant exogenous energy, adipose tissue fat breakdown is suppressed and
its synthesis is promoted. In the muscle, glucose entry enables glycogen to be
synthesized and stored, and carbohydrates, rather than fatty acids (or amino acids), to be
use as an immediately available energy for muscle contraction. In brief, insulin
promotes glycogen and lipid synthesis in the muscle, while suppressing lipolysis and
gluconeogenesis from muscle amino acids (Wilcox, 2005) (see annexes IV, VI and VII).
In the liver, insulin acts, not by directly stimulating glucose uptake, but by blocking
glycogenolysis and gluconeogenesis, and glycogen synthesis (Aronoff, 2004). In
pathological states, when the tissues are not able to adequately sense or respond to
insulin we are in the presence of insulin resistance (IR). Therefore, IR can be defined as
a state in which sensitive insulin tissues exhibit inadequate or reduced response to
normal amounts of insulin, requiring higher concentration of insulin to maintain
normoglycemia. The development of IR leads to a compensatory augmentation in
insulin synthesis, which subsequently results in hyperinsulinemia (Cefalu, 2001). The
clinical effects of IR are due to the disruption of insulin-mediated control of glucose and
lipid homeostasis in the insulin target organs, leading to a decreased glucose uptake,
increased hepatic-glucose production and increased whole-body lipolysis (Boden &
Laako, 2004). This specific tissue IR is characterized by elevated hydrolysis of
triglycerides from adipocytes and increased in FFAs, by reduced glucose uptake in
skeletal muscle, and by impaired hepatic glycogen synthesis (Petersen & Shulman,
2006).
1.2.1. Insulin action in the liver
The liver is a central metabolic organ that controls several key aspects of glucose and
lipid metabolism in response to nutritional and hormonal signals, being essential for the
maintenance of systemic energy homeostasis (Van Den Berghe, 1991). It acts as a hub
12
Glucose, fatty acids and amino acids are absorbed in the gastrointestinal tract to the
bloodstream and transported to the liver through the portal vein circulation system
(Moore et al., 2012; Nordlie et al., 1999; Rui, 2014). This organ is able to both store
and release glucose to minimize changes in glycemia in the rest of the body, between
the fed and fasted states, thus contributing to whole body glucose homeostasis (Moore
et al., 2012; Nordlie et al., 1999; Rui, 2014).
Overnight, in the post-absorptive state, circulating glucose is derived from two primary
hepatic processes: 1) glycogenolysis, i.e., the release of glucose from stored glycogen,
and 2) gluconeogenesis, i.e., the formation of new glucose from common metabolites in
the body including amino acids, glycerol, lactate, pyruvate and intermediate metabolites
of the TCA cycle (Nuttall et al., 2008) (see annexes V, II and IV). These processes
occur after hepatic glucagon action and subsequent activation of PKA that
phosphorylates several transcriptions factors inducing the expression of gluconeogenic
genes, namely phosphoenolpyruvate carboxykinase (PEPCK) and glucose
6-phosphatase (G6Pase). Consequently, gluconeogenesis occurs and in contrast,
glycolysis is inhibited through the repression of glucokinase (GK) and glycolitic genes,
such as pyruvate kinase and fructose-2-6-bisphosphate (Agius, 2007; Jiang & Zhang,
2003) (Figure 1.5). In addition, PKA activation also triggers glycogen phosphorylase (stimulating glycogenolysis, via activation of phosphorylase kinase), and inactivates
glycogen synthase (inhibiting glycogenesis) (Agius, 2007). The resulting
glucose-1-phosphate (G-1-P), besides being a potent inhibitor of glycogen synthase phosphatase
and of glycogen synthesis is an important gluconeogenic intermediate.
Glucose-1-phosphate is converted to glucose-6-Glucose-1-phosphate (G-6-P), and then to glucose, through
G6Pase (Jiang & Zhang, 2003). These actions together, result in an increase of hepatic
glucose delivery into the blood, therefore re-establishing the physiological glucose
level. During the post-absorptive state, the contribution of glycogenolysis and
gluconeogenesis to overall glucose production is approximately equal. However, with
continued fasting, glycogen stores become depleted, glucose production decreases and
gluconeogenesis become the predominant and nearly exclusive process (Hellerstein et
13
Figure 1.5: Glucose metabolism in the hepatocyte. Glucose is metabolized by different enzymes in different processes that are triggered or blocked by insulin or glucagon action. G-6-P: glucose-6-phosphate; F-6-P: fructose-6-phosphate; F(1,6)/(2,6) bip: fructose (1,6)/(2,6) biphosphate; PEP:phosphoenolpyruvate; GK: glucokinase; PFK1: phosphofructo-1-kinase; PK: pyruvate kinase; G6Pase: glucose-6-phospathase; FbiPase: fructose (1,6)/(2,6) biphosphatase; GP: glucose -1-phosphate; GS: glycogen synthase; GP: glycogen phosphorylase; GLUT2: Glucose transporter 2; +:stimulation ; - inhibition.
After a meal, in the post-prandial state, the levels of glucose increase due to glucose
absorption in the gastrointestinal tract; gluconeogenesis stops and the liver restores
glycogen stores (Moore et al., 2012) At this time, insulin action in the liver blocks
glycogenolysis and gluconeogenesis and stimulates glycogen synthesis (glycogenesis)
by activation of the cascade IR/IRS1-2/PI3K/Akt promoting the phosphorylation and
inactivation of glycogen synthase kinase 3 (GSK3), which in turn dephosphorylates and
activates glycogen synthase (GS) (Aronoff et al., 2004).The crucial metabolic function
of the liver is performed by hepatocytes which exhibit high capacity of glycogenesis,
glycogenolysis, glycolysis and gluconeogenesis, enabling them to transiently store
substantial amounts of glucose as glycogen, to synthesize glucose from lactate, glycerol
and amino acids and to convert excess glucose into triglyceride (Nuttal et al., 2008).
14
which facilitates the entry of glucose in the presence of high concentrations of glucose
and then rapidly phosphorylates glucose, via GK action, to obtain G-6-P, which cannot
escape the cell. From G6Pase, the glucose flux is transformed into glycogen via uridine
diphosphatase (UPD)-glucose (direct pathway of glycogen synthesis), the pentose
phosphate shunt-or into glycolysis, yielding carbon -3 compounds such as pyruvate and
lactate (Roden & Bernroider, 2003).
The GLUT2 and GK are expressed in the cell types in which glucose metabolism is
dependent on extracellular glucose concentration, being known as glucose sensors
(Leturque et al., 2009; Massa, 2011).
Impaired insulin sensitivity and dysregulated insulin action in the liver contribute
significantly to the pathogenesis of T2D (Fritsche et al., 2008). Type 2 Diabetes is
associated with defective regulation of hepatic glucose metabolism and defective
hepatic insulin clearance, involving elevated glucose production in euglycemic
conditions and subnormal clearance of glucose by the liver after a meal, due to delayed
suppression of hepatic glucose production and impaired conversion of glucose to
glycogen (Basu et al., 2000; Krssak et al., 2004; Rizza, 2010). Patients with T2D have
excessive rates of endogenous glucose production that fail to appropriately suppress
after eating (Basu et al., 2000; 2004). It was described that gluconeogenesis, and
perhaps glycogenolysis, are increased early in the evolution of T2D (Basu et al., 2004;
Basu et al., 2005). In fact in the post-prandial state, the suppression of endogenous
glucose production is incomplete both because of hepatic IR, impaired insulin and
excessive glucagon secretion in T2D, thereby causing post-meal hyperglycemia. This
leads to lower rates of hepatic glycogen synthesis primarily due to reduced uptake of
extracellular glucose presumably because of inadequate activation of GK (Basu et al.,
2000; 2001). Also, in T2D patients it was described that G6Pase, and
phosphoenolpyruvate (PEP) carboxykinase, two rate limiting enzymes of hepatic
glucose production are increased due to hepatic IR, since insulin is not able to suppress
the expression of these enzymes, as below described (Haeusler et al., 2015; Konopelska
et al., 2011). In contrast, some studies demonstrated that GK activity is decreased in
T2D (Clore et al., 2000). Hepatic IR is essentially characterized by alterations in insulin
signaling pathway in hepatocytes, which contribute for the onset of diabetes. Several
defects have been described: the dysfunction in InsR proteins initially leads to
15
synthesis, and these are considered as major pathophysiological mechanisms for the
development of IR and T2D (Dong, 2006;Taniguchi et al., 2005). Defects in InsR
phosphorylation, accompanied by the suppression of IRS transcription and loss of IRS
associated PI3K activity (Kerouz et al., 1997; Suzuki et al., 2004; Valverde et al.,
2003), result in impairment of the downstream cellular insulin action in the liver. There
are others factors that can also contribute for the development of hepatic IR, although in
a smaller extent. Increased expression/function of protein-tyrosine phophatases, in
addition to production of proinflamatory cytokines in adipose tissue, such as tumor
necrosis factor alpha (TNF-α) and interleukin-6 (IL-6), may also be responsible for InsR
dysfunction and liver IR (Klover & Mooney, 2004). In addition, GLUT2 alterations can
be involved in liver IR pathogenesis, since in humans GLUT2 deficiency
(Fanconi-Bickel syndrome) is related with marked hypoglycemia in the fasting state (Brivet et al.,
1983; Santer et al., 2002) and glycogen accumulation. The last one occurs due to a
failure to adequately export of glucose generated by glycogen degradation. However,
surprisingly the knockout mice for GLUT2 do not exhibit alterations both in hepatic
glucose output and glucose response (Guillam et al., 1998).
1.2.2. Insulin action in the Skeletal Muscle
Skeletal muscle is the predominant site for disposal of ingested glucose in the
postprandial state in lean individuals (DeFronzo et al., 1988, 1997; 2004; 2009).
Following a meal, approximately one third of ingested glucose is taken up by the liver,
being the rest taken up by peripheral tissues, primarily the skeletal muscle via an insulin
dependent mechanism (DeFronzo et al., 1988, 1997; 2004; 2009). This organ uses both
glucose and FFAs as a fuel sources for energy production (DeFronzo 1988; 1997; 2004;
2009; Saltiel & Kahn, 2001). During the fasting state, insulin concentration is low
which reflects a decreased glucose uptake, being the major source of energy the FFAs
that are elevated in bloodstream (Groop et al., 1989). After a meal, the increase in
plasma glucose levels stimulates insulin secretion from pancreatic β-cells induces a
rapid glucose uptake by the muscle, through the recruitment of GLUT4 transports and
activation of key enzymes (pyruvate kinase and glycogen synthase) involved in glucose
metabolism (DeFronzo, 1988). At the same time, the increase in insulin levels