Association of Body Mass Index and Insulin Resistance with
Metabolic Syndrome in Brazilian Children
Aparecido Pimentel Ferreira
1, Otávio de Tolêdo Nóbrega
2,3, Nancí Maria de França
3Universidade Paulista – UNIP1; Universidade de Brasília – UnB2; Universidade Católica de Brasília – UCB3; Distrito Federal - Brazil
Summary
Background: The clustering of cardiovascular risk factors called metabolic syndrome occurs in both children and adults. Insulin resistance and obesity are usual parts of the picture, but their joint effects on the onset of the syndrome remains somewhat debatable.
Objective: : The purpose of the current study was to examine the relationship of the body mass index (BMI) and insulin resistance with the metabolic syndrome (MS) in children.
Methods: We studied 109 children, 55 boys and 54 girls, between 7 and 11 years of age (55 obese, 23 overweight and 31 controls). The weight status of each child was defined based on BMI/age ratio. Blood glucose, HDL, triglycerides and insulin were measured using fasting samples. Blood pressure was measured twice. The metabolic syndrome was defined according to the NCEP ATP III criteria.
Results: The diagnosis of the MS was only found in obese children. The greater frequency of MS and of many of its components have been found in the children classified above the third quartile of the HOMA index, which is consistent with an association between insulin resistance and cardiovascular risk factors among the Brazilian children.
Conclusion: The present study shows that obesity and insulin resistance are likely to play a role in the development of cardiovascular risk factors in children since the prevalence of classic risk factors was higher in the upper BMI and HOMA percentiles. (Arq Bras Cardiol 2009; 93(2):139-144)
Key Words: Metabolic syndrome; child; obesity; overweight; insulin resistance; Brazil.
Mailling address: Otávio de Tolêdo Nóbrega •
Universidade Católica de Brasília - Q.S. 07, lote 01, EPCT, Águas Claras, Sala B, 105 A/B, 72.030-170, Taguatinga, DF - Brazil
E-mail: nobrega@pq.cnpq.br
Manuscript received August 19, 2008; revised manuscript received September 30, 2008; accepted October 21, 2008.
Introduction
Obesity in association with hypertension, dyslipidemia, and hyperglycemia constitute the metabolic syndrome (MS), a well-recognized constellation of risk factors for the development of type 2 diabetes and cardiovascular disease (CVD)1. Several studies have suggested that MS starts early in life2-7. Although the definition of MS in children and adolescents remains controversial8, the clustering of multiple cardiovascular risk factors similar to the ones observed in adults9 has been found to develop in childhood and to persist into adulthood10.
Insulin resistance and adiposity are underlying elements of the MS, but their joint effect on the onset of other elements of the syndrome remains undefined11. The prevalence of childhood obesity has more than doubled in the last 15 years in many regions worldwide12. This phenomenon is associated with a rapidly increasing trend
in cases of type 2 diabetes and CVD in childhood. The close association between childhood obesity and diabetes has been reported in isolated13 and multiethnic groups14 at high risk for diabetes. In these studies, the evolution from normal to impaired glucose tolerance (IGT) was associated with systemic resistance to insulin action and with failure in the insulin-secreting capacity of β-cells, endophenotypes that deteriorate further as type 2 diabetes develops15.
In children, the cumulative occurrence of risk factors for CVD is a rare event, but previous studies in this age group have shown a significant relationship between fasting insulin, lipid abnormalities, blood pressure disorders and overweight7, 16. Other studies have observed multiple associations of cardiovascular risk factors in young cohorts17-20 in a pattern that closely resembles the disorders observed in older-aged groups21.Studies on obesity and insulin resistance in children offer the potential to identify factors influencing the early development of cardiovascular diseases and type 2 diabetes before their onset.
Methods
This was a cross-sectional, population-based epidemiological study. The sample was obtained at random from public and private schools in Taguatinga, a satellite town of Brasília, Brazil, according to a confidence interval (CI) of 95%. Selection of schools and classes was meant to preserve the proportion of students enrolled in each educational segment (public and private). The study was approved by the institutional Ethics Committee and performed under consent of the local Education Department. At least one parent of each child gave written consent for his/her participation in the study before the investigation. All procedures were run at the Hospital of the UniversidadeCatólica de Brasília.
After screening 958 children aged 7 to 11 years from 10 schools, we detected 74 (7.7%) obese children and 102 (10.6%) overweight children. For that purpose, body mass index [BMI; weight (kg)/height (m²)] was calculated to classify each child as obese if their BMI was above the 95th or as overweight if BMI was between the 85th and 95th percentiles. Subjects between the 5th and the 85th percentiles were selected as the control group. Underweight children (below the 5th percentile) were excluded from the sample. After a formal invitation to undertake the study, 109 children (55 obese, 23 overweight and 31 control) agreed to take part.
Each child’s chronological age was determined at the decimal level using date of birth and date of measurements to define age groups. Height was assessed using a Seca 206 stadiometer (Cardiomed, Paraná, Brazil) to the nearest 0.1 cm. Weight was determined with a Plena digital scale (Cardiomed, Paraná, Brazil) with 0.1 kg resolution. Waist and hip circumferences were determined following the protocol described by Marins & Giannichi22. Blood pressure was measured by the auscultatory method using a sphygmomanometer with a suitable cuff size for each patient (Premium). Assessments were taken after a 5-minute rest in the supine position and again 25 minutes after the first reading, and the mean of the two measurements was considered. Systolic (SBP) and diastolic (DBP) blood pressures were measured corresponding to the first and fifth Korotkoff sounds. Children were defined as hypertensive if their blood pressure was over the 95th percentile for their age, sex and height.
Body fat was measured using the dual energy X-ray absorptiometry (DXA) method according to manufacturer’s recommendations. The equipment used was a Lunar DPX-IQ (United Medical Technologies, Corp., Florida, USA) with the 4.6A version of the operational software. Bone mineral content, muscle mass, and fat mass were estimated by segment and total body fat was quantified in both relative (percentage of body fat) and absolute terms (kg per body region), although only the body fat data were used for this study. The DXA equipment was duly calibrated prior to use. All analyses were performed by the same technician.
Blood samples were obtained after a 12-hour fasting period. Samples were collected in vacuum tubes with separator gel and without anticoagulant. After collection, blood was centrifuged for 10 minutes at 3.000 rpm to separate serum from the remaining components, and the analyses were run on serum. Cholesterol, triglycerides,
high-density lipoproteins (HDL) and glucose were assayed using an enzymatic colorimetric kit processed in Autohumalyzer A5, (Human GMBH, Germany).Insulin was assayed using the ACS-180 Automated Chemiluminescence System (Ciba-Corning Diagnostic Corp., USA).
Metabolic syndrome was diagnosed according to a modified version of the National Cholesterol Education Program’s Adult Treatment Panel III1, which consists of the presence of at least three of the following factors: obesity (characterized by abdominal obesity), dyslipidemia (high levels of triglycerides or low HDL levels), arterial hypertension and fasting hyperglycemia. Intervals compatible with serum lipid disorders were age-adapted as follows: triglycerides ≥ 110 mg/dland HDL ≤ 38 mg/dl. Blood pressure (both systolic and diastolic) was further adjusted for height, age and sex, whereas the hypertensive cutoff limit was set above the 95th percentile. Fasting hyperglycemia was established as concentrations ranging from 100 to 126 mg/dl23. Obesity was defined as stated above. Insulin resistance was estimated using the homeostasis model assessment [HOMA; fasting insulin (µUI/ml) x fasting glycemia (mmol/l)/22.5], and resistance was assumed with HOMA > 90th Percentile. Hyperinsulinemia was defined as insulin level above 20 µU/ml24.
Normal distribution of the data was verified by the Shapiro-Wilks or the Kolmogorov-Smirnov tests. Data are presented as mean ± standard deviation (SD). Differences between means were assessed using either the t student test or the one-way analysis of variance set for the Scheffé post hoc test. Spearman’s rank correlation coefficient was used to measure the strength of association between 2 variables. All analyses were carried out using the 11.5 version of the SPSS package (SPSS Inc, Chicago, USA), and p values < 0.05 were considered statistically significant.
Results
Demographic, clinical, and biochemical features
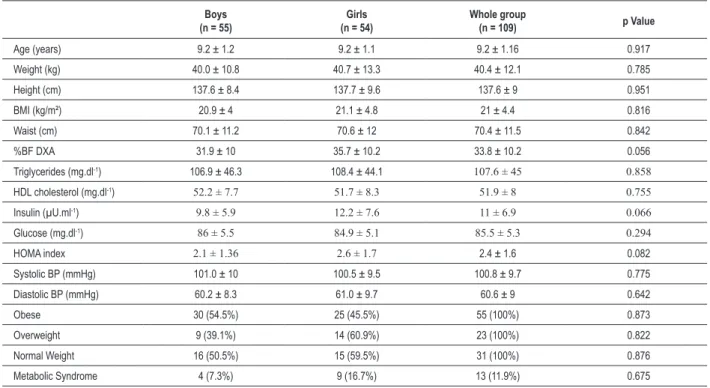
The demographic, clinical, and biochemical characteristics of the 109 children are summarized in Table 1. The proportion of children classified as obese, overweight and normal weight did not significantly differ between sexes, nor did any other variable.
Association of BMI with metabolic syndrome
The anthropometric, clinical and biochemical profiles of the children investigated according to the nutritional classification are summarized in Table 2. The chi-square test and the Scheffé post hoc test disclosed significant differences regarding the anthropometric, clinical and biochemical variables between obese, overweight and normal weight children, with a trend for greater metabolic disorders among the obese and overweight subjects.
Table 1 - Demographic, clinical and biochemical variables of a cohort of 109 children of both genders
Boys (n = 55)
Girls (n = 54)
Whole group
(n = 109) p Value
Age (years) 9.2 ± 1.2 9.2 ± 1.1 9.2 ± 1.16 0.917
Weight (kg) 40.0 ± 10.8 40.7 ± 13.3 40.4 ± 12.1 0.785
Height (cm) 137.6 ± 8.4 137.7 ± 9.6 137.6 ± 9 0.951
BMI (kg/m²) 20.9 ± 4 21.1 ± 4.8 21 ± 4.4 0.816
Waist (cm) 70.1 ± 11.2 70.6 ± 12 70.4 ± 11.5 0.842
%BF DXA 31.9 ± 10 35.7 ± 10.2 33.8 ± 10.2 0.056
Triglycerides (mg.dl-1) 106.9 ± 46.3 108.4 ± 44.1 107.6 ± 45 0.858
HDL cholesterol (mg.dl-1) 52.2 ± 7.7 51.7 ± 8.3 51.9 ± 8 0.755
Insulin (µU.ml-1) 9.8 ± 5.9 12.2 ± 7.6 11 ± 6.9 0.066
Glucose (mg.dl-1) 86 ± 5.5 84.9 ± 5.1 85.5 ± 5.3 0.294
HOMA index 2.1 ± 1.36 2.6 ± 1.7 2.4 ± 1.6 0.082
Systolic BP (mmHg) 101.0 ± 10 100.5 ± 9.5 100.8 ± 9.7 0.775
Diastolic BP (mmHg) 60.2 ± 8.3 61.0 ± 9.7 60.6 ± 9 0.642
Obese 30 (54.5%) 25 (45.5%) 55 (100%) 0.873
Overweight 9 (39.1%) 14 (60.9%) 23 (100%) 0.822
Normal Weight 16 (50.5%) 15 (59.5%) 31 (100%) 0.876
Metabolic Syndrome 4 (7.3%) 9 (16.7%) 13 (11.9%) 0.675
Dates are expressed as mean ± SD or absolute frequency. Absolute frequencies are displayed and proportional frequencies are presented in parenthesis. Percentage values were determined by Chi-square Pearson test (χ2); BMI, body mass index; HDL – high density lipoprotein; %BF DXA, percentage of body fat measured by dual
energy X-ray absorptiometry; HOMA, homeostasis model assessment, BP, blood pressure.
The greater frequency of MS and of many of its components were found in the children classified above the third quartile of HOMA, which is consistent with an association between insulin resistance and cardiovascular risk factors among Brazilian schoolchildren.
Discussion
In the present study, the diagnosis of MS was only found in obese children corroborating results from other authors2,4,5. Supporting this hypothesis, the present study shows that the presence of individual risk factors for MS was more frequently observed in obese children, when compared with overweight and normal weight ones, showing that high BMI increases the presence of other risk factors, as reported elsewhere4,7. When the data from these 55 obese children were analyzed, it was observed that MS was more frequent among the girls [χ2 = 3.88: (1); p = 0.049], in agreement to the results found by Davis et al2. This difference can in part be explained by a greater accumulation of fat in girls. The prevalence of MS has also shown to differ significantly according to the level of insulin resistance. None of the children classified in the two lower quartiles defined by HOMA intervals were diagnosed with metabolic syndrome, whilst 7.4 and 40.7% of the children classified in the two upper quartiles exhibited MS [χ2 = 21.483: (1); p = 0.001]. Accordingly, the prevalence of individual risk factors for MS has shown to increase along with the augmentation of the insulin resistant phenotype8,25,26. Moreover, Weiss et al7 reported an increase in the prevalence
of the MS in accordance with higher insulin resistance in three different ethnic groups (Hispanics, Caucasians and Blacks). The present study did not verify the ethnic structure of the children evaluated. Brazil has a highly miscegenated population and this feature cannot be ruled out as a possible source of variances found in the study. Regardless of the ethnic composition, studies elsewhere show similar association between insulin resistance and MS whenever diverse human groups are compared11,17,27-29.
insulin-Table 2 - Anthropometric, clinical and biochemical proiles of the children investigated according to the nutritional classiication
Obese (n = 55)
Overweight (n = 23)
Control Group
(n = 31) F or χ
2
Age (years) 9.2 ± 1.4 9.3 ± 1 9.0 ± 0.8 0.39 (NS)
Weight (kg) 47.4 ± 11.5 39.1 ± 5.6 28.5 ± 4.6 44.77 *
Height (cm) 139.3 ± 9.8 137.9 ± 8.4 134.4 ± 7.1 3.13 †
Waist (cm) 78.1 ± 8.8 69.0 ± 7.0 57.5 ± 4.2 76.73 *
Hip (cm) 85.9 ± 8.4 79.2 ± 4.8 67.9 ± 5.6 64.19 *
BMI (kg/m²) 24.0 ± 2.8 20.5 ± 1.4 15.7 ± 1.5 138.48 *
%BF DXA 40.4 ± 5.5 36.3 ± 4.6 20.2 ± 5.7 143.72 ‡§
Triglycerides (mg.dl-1) 118.8 ± 48.8 117.7 ± 41.5 80.4 ± 26.0 9.13 // #
Insulin (µU.ml-1) 14.4 ± 7.7 10.4 ± 3.5 5.5 ± 1.7 23.52 // **
Glucose (mg.dl-1) 86.6 ± 5.4 85.3 ± 5.1 83.6 ± 5.0 3.38 †
HDL (mg.dl-1) 51.1 ± 7 55.1 ± 8.8 50.9 ± 8.6 2.46 (NS)
HOMA index 3.1 ± 1.8 2.2 ± 0.7 1.2 ± 0.5 21.61 † **
SBP (mmHg) 105.6 ± 9.5 98.8 ± 8.6 93.6 ± 5.2 21.73 // ‡
DBP (mmHg) 65.0 ± 9.7 57.5 ± 5.9 55 ± 4.9 18.13 // ‡
Boys/Girls ratio 1.2 0.65 1.07 0.55 †† (NS)
TG > 110 mgdl-1 (%) 58.2 39.1 12.9 16.58 ††
BP > P.95 age/sex/height(%) 18.2 4.3 0 10.3 ††
HDL< 38 mg.dl-1 (%) 5.5 0 3.2 0.44 †† (NS)
HOMA > P.90 (%) 20.0 0 0 9.96 ††
Insulin > 20 µU/ml (%) 21.8 0 0 17.41 ††
Metabolic Syndrome (%) 23.6 0 0 12.01 ††
BMI, body mass index; %BF DXA, percentage of body fat measured by dual energy X-ray absorptiometry; HDL, high-density lipoprotein; HOMA, insulin resistance by homeostasis modeling; SBP, systolic blood pressure; DBP, diastolic blood pressure; TG, triglycerides; NS - no signiicance difference found with parametric analyses between groups; * - obese group vs. overweight group vs. control group with p<0.001; † - obese group vs. control group with p<0.05; ‡ - obese group vs. overweight group with p<0.05; § - control group vs. overweight and vs. obese groups with p<0.001; // - obese group vs. control group with p<0.001; # - overweight group vs. control group with p<0.05;** - overweight group vs. control group and vs. obese groups; p<0.05; †† - determined by the chi-square Pearson test (χ2) with p<0.001.
Table 3 - Classiication of the children in quartiles according to the
insulin resistance phenotype expressed by the HOMA index
Quartiles (n) Mean ± SD Conidence
Interval (95% CI) Minimal-Maximal
Quartile 1 (28) 0.94 ± 0.21 0.85 - 1.02 0.54 - 1.24
Quartile 2 (27) 1.60 ± 0.17 1.54 - 1.67 1.30 - 1.88
Quartile 3 (27) 2.43 ± 0.28 2.32 - 2.54 1.89 - 2.95 Quartile 4 (27) 4.59 ± 0.38 4.04 - 5.14 2.97 - 7.01
dependent lipoprotein lipase enzyme may suffer from reduced activity under a resistant condition, which may contribute to the hypertriglyceridemia phenotype31.
The values of systolic and diastolic blood pressure were significantly different between the groups stratified according to BMI and to HOMA. The higher prevalence of hypertensive individuals in the higher HOMA percentiles strengthens the hypothesis that excessive body fat can promote increase in blood pressure4,8. Mean values of body fat content and fasting insulin were higher in children classified in the upper HOMA quartile and in the obese group, as described elsewhere28,32-34. The role of the insulin resistance in the onset of hypertension remains controversial. Nonetheless, it has been postulated that a resistant state may lead to hypertension due to the failure of the nitric oxide-mediated vasodilator activity of the insulin hormone on endothelial cells35. It has been reported that this effect is diminished in obese individuals36. It is reasonable to assume that such failure in the insulin action, coupled to independent events of excessive renal reabsorption and/or consumption of sodium as well as persistence of sympathetic activity can contribute to the rise
of the blood pressure. An elevated sympathetic activity, for instance, has been observed to account for an increased peripheral vascular resistance in obese children37.
Table 4 - Anthropometric, clinical and biochemical proiles of the children investigated grouped in quartiles according to the insulin
resistance phenotype expressed by HOMA index
Quartile 1 (n = 28)
Quartile 2 (n = 27)
Quartile 3 (n = 27)
Quartile 4
(n = 27) F or χ
2
Age (years) 8.7 ± 0.8 9.4 ± 1.2 8.8 ± 1.1 9.9 ± 1.2 6.22
Weight (kg) 30.8 ± 6.3 38.3 ± 9.2 38.9 ± 8.4 53.5 ± 10.9 31.60 *
Height (cm) 133.3 ± 7 136.8 ± 7.8 136.5 ± 9.1 144.1 ± 8.7 8.61 *
Waist (cm) 60.7 ± 7.7 68.5 ± 9.5 70.3 ± 8.4 82.1 ± 8.9 28.50 *
Hip (cm) 71 ± 8 77.7 ± 8.6 79.3 ± 7.3 89.9 ± 7.7 26.79 *
BMI (kg/m²) 17.4 ± 3.1 20.3 ± 3.5 20.7 ± 3.2 25.3 ± 2.6 30.54 *
%BF DXA 25.4 ± 9.5 31.5 ± 10 36.3 ± 7.3 42.2 ± 5.3 20.52 † ‡ §
Triglycerides (mg.dl-1) 80.7 ± 29.4 102.4 ± 33.3 109.9 ± 45.1 138.6 ± 50.7 9.57 // #
Insulin (µU.ml-1) 4.6 ± 1 7.7 ± 1 11.2 ± 1.6 20.8 ± 6 134.62 * ‡
Glucose (mg.dl-1) 82.2 ± 3.6 85 ± 5.1 86.1 ± 5.5 88.6 ± 5 8.29 //
**
HDL (mg.dl-1) 53.8 ± 7.6 52.5 ± 9.9 51.6 ± 6.8 49.7 ± 7.1 1.25
HOMA index 0.9 ± 0.2 1.6 ± 0.2 2.4 ± 0.3 4.6 ± 1.4 135.46 ‡‡
SBP (mmHg) 95.5 ± 6.3 98.1 ± 9.1 101.9 ± 8.9 107.7 ± 10.1 9.99 //
DBP (mmHg) 56.3 ± 6.7 58.8 ± 7.2 62.5 ± 8.7 64.9 ± 10.9 5.59 ††
Boys/Girls ratio 1.0 2.4 0.7 0.7 1.3 (NS)
BMI> p.95 age/gen (%) 21.4 40.7 51.9 88.9 35.49 §§
TG > 110 mg/dl (%) 14.3 33.3 44.4 74.1 20.32 §§
PA > P.95 age/gen/height(%) 3.6 3.7 7.4 25.9 7.4 §§
HDL< 38 mg.dl-1 (%) 0 3.7 3.7 7.4 1.9 (NS)
Insulin > 20 µU.ml-1 (%) 0 0 0 44.4 23.32 §§
HOMA > P.90 (%) 0 0 0 40.7 22.06 §§
Metabolic Syndrome (%) 0 0 7.4 40.7 21.48 §§
BMI, body mass index; %BF DXA, percentage of body fat measured by dual energy X-ray absorptiometry; HDL, high-density lipoprotein; HOMA, insulin resistance by homeostasis modeling; SBP, systolic blood pressure; DBP, diastolic blood pressure; TG, triglycerides;NS - no signiicance difference found with parametric analyses between groups;* - quartiles 1,2 and 3 vs. quartile 4 with p<0.001; † - quartiles 3 and 4 vs. quartile 1 with p<0.001; ‡ - quartile 1 vs. quartile 2 with p<0.05; § - quartile 2 vs. quartile 4 with p<0.001; // - quartile 1 vs. quartile 4 with p<0.001; # - quartile 2 vs. quartile 4 with p<0.05; ** - quartile 1 vs. quartile 3 with p<0.05; †† - quartile 1 vs. quartile 4 with p<0.05; ‡‡ - quartile 1 vs. quartile 2 vs. quartile 3 vs. quartile 4 with p<0.001; §§ - determined by the chi-square Pearson test (χ2) with p<0.001.
Acknowledgments
AP Ferreira has substantially contributed to design and conduct the study, to the analysis and interpretation of results, to the preparation of the manuscript.
NM França has substantially contributed to design and conduct the study as well as to the analysis and interpretation of results.
OT Nóbrega has substantially contributed to the analysis and interpretation of results, to the preparation of the manuscript and to the article’s final revision for acceptance.
Potential Conflict of Interest
No potential conflict of interest relevant to this article was reported.
Sources of Funding
There were no external funding sources for this study.
Study Association
References
1. Executive Summary of The Third Report of The National Cholesterol Education Program (NCEP) Expert Panel on Detection, Evaluation, And Treatment of High Blood Cholesterol In Adults (Adult Treatment Panel III). Expert panel on detection, evaluation, and Treatment of high blood cholesterol in adults. JAMA. 2001; 285 (19): 2486-97.
2. Davis CL, Flickinger B, Moore D, Bassali R, Domel Baxter S, Yin Z. Prevalence of cardiovascular risk factors in schoolchildren in a rural Georgia community. Am J Med Sci. 2005; 330 (2): 53-9.
3. Druet C, Dabbas M, Baltakse V, Payen C, Jouret B, Baud C, et al. Insulin resistance and the metabolic syndrome in obese French children. Clin Endocrinol (Oxf). 2006; 64 (6): 672-8.
4. Hirschler V, Aranda C, Calcagno Mde L, Maccalini G, Jadzinsky M. Can waist circumference identify children with the metabolic syndrome? Arch Pediatr Adolesc Med. 2005; 159 (8): 740-4.
5. Papadopoulou-Alataki E, Papadopoulou-Legbelou K, Doukas L, Karatzidou K, Pavlitou-Tsiontsi A, Pagkalos E. Clinical and biochemical manifestations of syndrome X in obese children. Eur J Pediatr. 2004; 163 (10): 573-9.
6. Srinivasan SR, Myers L, Berenson GS. Changes in metabolic syndrome variables since childhood in prehypertensive and hypertensive subjects: the Bogalusa Heart Study. Hypertension. 2006; 48 (1): 33-9.
7. Weiss R, Dziura J, Burgert TS, Tamborlane WV, Taksali SE, Yeckel CW, et al. Obesity and the metabolic syndrome in children and adolescents. N Engl J Med. 2004; 350 (23): 2362-74.
8. Cruz ML, Weigensberg MJ, Huang TT, Ball G, Shaibi GQ, Goran MI. The metabolic syndrome in overweight Hispanic youth and the role of insulin sensitivity. J Clin Endocrinol Metab. 2004; 89 (1): 108-13.
9. Sociedade Brasileira de Cardiologia. Sociedade Brasileira de Hipertensão. Sociedade Brasileira de Endocrinologia e Metabologia, Sociedade Brasileira de Diabetes. I Diretriz brasileira de diagnóstico e tratamento da síndrome metabólica. Arq Bras Cardiol. 2005; 84 (supl 1): 1-28.
10. Bao W, Srinivasan SR, Berenson GS. Persistent elevation of plasma insulin levels is associated with increased cardiovascular risk in children and young adults. The Bogalusa Heart Study. Circulation. 1996; 93 (1): 54-9.
11. Reaven GM. Insulin resistance, cardiovascular disease, and the metabolic syndrome: how well do the emperor’s clothes fit? Diabetes Care. 2004; 27 (4): 1011-2.
12. Chinn S, Rona RJ. Prevalence and trends in overweight and obesity in three cross sectional studies of British Children, 1974-94. BMJ. 2001; 322 (7277): 24-6.
13. Fagot-Campagna A. Emergence of type 2 diabetes mellitus in children: epidemiological evidence. J Pediatr Endocrinol Metab. 2000; 13 (Suppl 6): 1395-402.
14. Sinha R, Fisch G, Teague B, Tamborlane WV, Banyas B, Allen K, et al. Prevalence of impaired glucose tolerance among children and adolescents with marked obesity. N Engl J Med. 2002; 346 (11): 802-10.
15. Weyer C, Tataranni PA, Bogardus C, Pratley RE. Insulin resistance and insulin secretory dysfunction are independent predictors of worsening of glucose tolerance during each stage of type 2 diabetes development. Diabetes Care. 2001; 24 (1): 89-94.
16. Ferreira AP, Oliveira CE, Franca NM. Metabolic syndrome and risk factors for cardiovascular disease in obese children: the relationship with insulin resistance (HOMA-IR). J Pediatr (Rio J). 2007; 83(1): 21-6.
17. Bacha F, Saad R, Gungor N, Janosky J, Arslanian SA. Obesity, regional fat distribution, and syndrome X in obese black versus white adolescents: race differential in diabetogenic and atherogenic risk factors. J Clin Endocrinol Metab. 2003; 88(6): 2534-40.
18. Goran MI, Ball GD, Cruz ML. Obesity and risk of type 2 diabetes and cardiovascular disease in children and adolescents. J Clin Endocrinol Metab. 2003; 88 (4): 1417-27.
19. Sinaiko AR, Jacobs DR Jr, Steinberger J, Moran A, Luepker R, Rocchini AP, et al. Insulin resistance syndrome in childhood: associations of the euglycemic insulin clamp and fasting insulin with fatness and other risk factors. J Pediatr.
2001; 139(5): 700-7.
20. Uwaifo GI, Nguyen TT, Keil MF, Russell DL, Nicholson JC, Bonat SH, et al. Differences in insulin secretion and sensitivity of Caucasian and African American prepubertal children. J Pediatr. 2002; 140(6): 673-80.
21. Karnikowski M, Cordova C, Oliveira RJ, Karnikowski MG, Nobrega OT. Non-alcoholic fatty liver disease and metabolic syndrome in Brazilian middle-aged and older adults. Sao Paulo Med J. 2007; 125 (6): 333-7.
22. Marins JC, Giannichi RS. Avaliação e prescrição de atividade física: guia prático. 3a ed. Rio de Janeiro: Editora Shape; 2003.
23. Standards of medical care in diabetes. Diabetes Care. 2005; 28 (Suppl 1): S4-S36.
24. Huang TT, Johnson MS, Goran MI. Development of a prediction equation for insulin sensitivity from anthropometry and fasting insulin in prepubertal and early pubertal children. Diabetes Care. 2002; 25(7): 1203-10.
25. Pankow JS, Jacobs DR Jr, Steinberger J, Moran A, Sinaiko AR. Insulin resistance and cardiovascular disease risk factors in children of parents with the insulin resistance (metabolic) syndrome. Diabetes Care. 2004; 27(3): 775-80.
26. Sinaiko AR, Steinberger J, Moran A, Prineas RJ, Vessby B, Basu S, et al. Relation of body mass index and insulin resistance to cardiovascular risk factors, inflammatory factors, and oxidative stress during adolescence. Circulation. 2005; 111(15): 1985-91.
27. Chen W, Srinivasan SR, Li S, Xu J, Berenson GS. Metabolic syndrome variables at low levels in childhood are beneficially associated with adulthood cardiovascular risk: the Bogalusa Heart Study. Diabetes Care. 2005; 28(1): 126-31.
28. Cruz ML, Huang TT, Johnson MS, Gower BA, Goran MI. Insulin sensitivity and blood pressure in black and white children. Hypertension. 2002; 40(1): 18-22.
29. Goran MI, Bergman RN, Cruz ML, Watanabe R. Insulin resistance and associated compensatory responses in african-american and Hispanic children. Diabetes Care. 2002; 25(12): 2184-90.
30. Tonet AC, Karnikowski M, Moraes CF, Gomes L, Karnikowski MG, Cordova C, et al. Association between the -174 G/C promoter polymorphism of the interleukin-6 gene and cardiovascular disease risk factors in Brazilian older women. Braz J Med Biol Res. 2008; 41(1): 47-53.
31. Halpern A, Matos AFG, Suplicy HL, Mancini MC, Zanella MT. Obesidade. São Paulo: Lemos Editorial; 1998.
32. Guerra S, Ribeiro JC, Costa R, Duarte J, Mota J. Relationship between cardiorespiratory fitness, body composition and blood pressure in school children. J Sports Med Phys Fitness. 2002; 42(2): 207-13.
33. Poirier P, Lemieux I, Mauriege P, Dewailly E, Blanchet C, Bergeron J, et al. Impact of waist circumference on the relationship between blood pressure and insulin: the Quebec Health Survey. Hypertension. 2005; 45(3): 363-7.
34. Robinson RF, Batisky DL, Hayes JR, Nahata MC, Mahan JD. Body mass index in primary and secondary pediatric hypertension. Pediatr Nephrol. 2004; 19(12): 1379-84.
35. de Carvalho MH, Colaco AL, Fortes ZB. Cytokines, endothelial dysfunction, and insulin resistance. Arq Bras Endocrinol Metabol. 2006; 50(2): 304-12.
36. Gruber HJ, Mayer C, Mangge H, Fauler G, Grandits N, Wilders-Truschnig M. Obesity reduces the bioavailability of nitric oxide in juveniles. Int J Obes (Lond). 2008; 32(5): 826-31.