Molecular evidence for a recent demographic expansion in the puma
(
Puma concolor
) (Mammalia, Felidae)
Eunice M. Matte
1,2, Camila S. Castilho
3, Renata A. Miotto
4,5, Denis A. Sana
6,7, Warren E. Johnson
8,
Stephen J. O’Brien
9, Thales R. O. de Freitas
1and Eduardo Eizirik
2,61
Laboratório de Citogenética e Evolução, Departamento de Genética,
Universidade Federal de Rio Grande do Sul, Porto Alegre, RS, Brazil.
2
Laboratório de Biologia Genômica e Molecular, Faculdade de Biociências,
Pontifícia Universidade Católica do Rio Grande do Sul, Porto Alegre, RS, Brazil.
3
Laboratório de Ecologia da Paisagem e Conservação, Universidade de São Paulo, São Paulo, SP, Brazil.
4
Laboratório de Biodiversidade Molecular e Citogenética,
Departamento de Genética e Evolução, Universidade Federal de São Carlos, São Carlos, SP, Brazil.
5
Escola Superior de Agricultura Luiz de Queiroz, Universidade de São Paulo, Piracicaba, SP, Brazil.
6
Instituto Pró-Carnívoros, Atibaia, SP, Brazil.
7
Programa de Pós-Graduação em Ecologia, Universidade Federal de Rio Grande do Sul,
Porto Alegre, RS, Brazil.
8
Smithsonian Conservation Biology Institute, Front Royal, VA, USA.
9
Theodosius Dobzhansky Center for Genome Bioinformatics,
St. Petersburg State University, St. Petersburg, Russia.
Abstract
The puma is an iconic predator that ranges throughout the Americas, occupying diverse habitats. Previous phylogeographic analyses have revealed that it exhibits moderate levels of genetic structure across its range, with few of the classically recognized subspecies being supported as distinct demographic units. Moreover, most of the species’ molecular diversity was found to be in South America. To further investigate the phylogeographic structure and demographic history of pumas we analyzed mtDNA sequences from 186 individuals sampled throughout their range, with emphasis on South America. Our objectives were to refine the phylogeographic assessment within South America and to investigate the demographic history of pumas using a coalescent approach. Our results extend previ-ous phylogeographic findings, reassessing the delimitation of historical population units in South America and dem-onstrating that this species experienced a considerable demographic expansion in the Holocene, ca. 8,000 years ago. Our analyses indicate that this expansion occurred in South America, prior to the hypothesized re-colonization of North America, which was therefore inferred to be even more recent. The estimated demographic history supports the interpretation that pumas suffered a severe demographic decline in the Late Pleistocene throughout their distri-bution, followed by population expansion and re-colonization of the range, initiating from South America.
Keywords: conservation genetics, mammals, mitochondrial DNA, molecular time estimate, phylogeography.
Received: December 19, 2012; Accepted: August 16, 2013.
Introduction
The puma (Puma concolorLinnaeus, 1771) is a large felid that ranges throughout the Americas, exhibiting the broadest latitudinal distribution of any terrestrial mammal (Nowak, 1999). Pumas have remarkable dispersal capabili-ties (Maehret al., 2002; Beieret al., 2003) and successfully
occupy a diverse array of habitats, illustrating their poten-tial to adapt to the breadth of environmental conditions oc-curring across the continent, from tropical forests and marshes to dry scrubland and cold Andean or Patagonian biomes (Redford and Eisenberg, 1992; Nowak, 1999). Pumas are solitary and territorial, with large home ranges. Females tend to occupy smaller areas and disperse shorter distances, thus being more philopatric than males (Logan and Sweanor, 2001; Maehret al., 2002). Overall, the spe-cies’ ecological flexibility and dispersal capabilities have
www.sbg.org.br
Send correspondence to Eduardo Eizirik. Faculdade de Biociên-cias, Pontifícia Universidade Católica do Rio Grande do Sul, Av. Ipiranga 6681, prédio 12, 90619-900 Porto Alegre, RS, Brazil. E-mail: eduardo.eizirik@pucrs.br.
the potential to induce broad genetic connectivity across large geographic areas, unless historical barriers have lim-ited gene flow among populations.
Fossil evidence indicates that pumas were already present in North America 0.4 million years ago (MYA) (Kurtén and Anderson, 1980). In parallel, molecular data (Johnsonet al., 2006) have led to an estimate of its diver-gence from the sister-species P. yagouaroundi of 4.17 MYA (C.I.: 3.16-6.01MYA), suggesting a much longer history as a distinct evolutionary lineage. The speciation event that separated these lineages may have occurred in North or South America, with the molecular dating esti-mate supporting the former, as it tends to predate the Great American Biotic Interchange (GABI) (ca. 2.5-3.5 MYA) and the implied colonization of South America by any felid (Woodburne, 2010; Eizirik, 2012). However, since the credibility interval of this estimate slightly overlaps the timing of the GABI, this issue is still not fully settled. Inter-estingly, Barnettet al.(2005) provided molecular evidence indicating that the extinct North American felid Miracinonyx trumaniis the puma’s closest relative, with a divergence time estimated at 3.19 MYA. This finding would support the hypothesis of a North American origin for the puma, with subsequent colonization of South Amer-ica by this species, in parallel with that of the jaguarundi.
In a thorough study of puma phylogeography, Culver et al.(2000) assessed the current and historical genetic di-versity present in this species, based on a large sampling of individuals from across its range. That study indicated that most of the 32 classical puma subspecies did not corre-spond to definable genetic units and reduced the number of recognized subspecies to six. Four of these subspecies were distributed in South America, indicating that most of the species’ historical subdivision occurred in that sub-continent. In addition, the genetic diversity within South America was found to be larger than in Central and North America, suggesting that pumas from the latter subconti-nent actually derive from a recent re-colonization event, following extinction in North America in the Late Pleisto-cene (ca.10,000-12,000 years ago).
Mitochondrial DNA (mtDNA) markers have been ex-tensively used in evolutionary studies of felids (e.g.Eizirik et al., 1998, 2001; Trigoet al., 2008). Although limited be-cause they reveal only matrilineal history and contain a sin-gle realization of the stochastic processes of coalescence and lineage sorting (Avise, 1998), they are still powerful molecular tools to investigate recent phylogeographic pat-terns and demographic history. Given that felids tend to have male-biased gene flow (Pusey and Packer, 1987; Smith, 1993; Logan and Sweanor, 2001), mtDNA assess-ments of phylogeography are expected to provide more re-fined patterns of geographic structuring due to historical processes than nuclear markers. They may therefore be ex-pected to be relevant benchmarks for maximum historical structuring, serving as baselines against which nuclear data
sets may be compared. In addition, due to their four-fold lower effective population sizes (Ne) relative to autosomal
markers, mtDNA segments should be more sensitive to the effect of historical genetic drift. In combination with their relatively high substitution rates, these features render these markers potentially more sensitive to historical pro-cesses of population subdivision than equivalent segments of the nuclear genome.
Within the mtDNA, theNADH dehydrogenase sub-unit 5(ND5) gene has been successfully used in phylogen-etic and phylogeographic studies of felids and other carni-vores (e.g.Culveret al., 2000; Trincaet al., 2012). In a previous study focusing on pumas (Culveret al., 2000), three mtDNA segments were employed (ND5, 16S and ATP8). Of these, ND5 showed the highest polymorphic content in this species, based on a segment spanning 318 bp. A new primer set for this gene was designed specif-ically for carnivores (Trigoet al., 2008), amplifying a lon-ger fragment (ca.750 bp) and exhibiting successful ampli-fication across several families (e.g.Felidae, Mustelidae, Mephitidae, Procyonidae [unpublished data]).
In the present study we employ this longerND5 seg-ment to investigate the evolutionary history ofP. concolor, with emphasis on South American populations, which were previously found to harbor high levels of diversity and in-ferred to have played a key role in the historical demogra-phy of this species (Culver et al., 2000). Given that the geographic sampling of South American pumas was lim-ited in that first study, we aimed here to expand the repre-sentation of the various regions of this sub-continent, so as to allow refined inferences of population structure, mater-nal gene flow and demographic history. In addition to ex-panding the geographic coverage of South American regions to refine inferences on patterns of matrilineal sub-division, we have performed novel analyses on puma de-mographic history, which revealed consistent evidence of a recent population expansion in South America, prior to re-colonization of North America.
Materials and Methods
Sample collection and laboratory procedures
Table S1). Two samples ofPuma yagouaroundiwere also included to be used as outgroups in some analyses.
To select a marker that would provide suitable infor-mation levels, we initially examined the mtDNA fragments used in previous studies, especially those involving Neo-tropical felids (e.g.Eiziriket al., 1998, 2001; Johnsonet al., 1998, 1999; Culveret al., 2000). We selected the ca. 750 bp-long fragment of theND5gene reported by Trigoet al. (2008), thus considerably increasing the information con-tent derived from this marker relative to the previous phylogeographic study of the puma (Culveret al., 2000). Finally, the availability ofND5 sequences for the extinct felidMiracinonyx trumani(Barnettet al., 2005) was an ad-ditional asset of this segment, allowing the inclusion of this fossil taxon in some analyses.
In the case of new biological samples, DNA was ex-tracted using either a standard phenol-chloroform approach (Sambrooket al., 1989) or a CTAB-based protocol (Doyle and Doyle, 1987). For all samples, a fragment of theND5 gene was amplified by the Polymerase Chain Reaction (PCR) (Saikiet al., 1985) using the primersND5-DF1 and ND5-DR1 (Trigo et al., 2008). PCR reactions were per-formed in a total volume of 20mL containing 2mL of em-pirically diluted DNA, 1X buffer, 1.5 mM MgCl2, 0.2mM
of each primer, 0.2 mM dNTPs and 0.5 U PlatinumTaq DNA polymerase (Invitrogen), with a thermocycling pro-file as described by Tchaickaet al.(2007). PCR products were visualized on a 1% agarose gel stained with GelRed (Biotium), purified with the enzymes Exonuclease I and Shrimp Alkaline Phosphatase (Exo-SAP, GE Healthcare), sequenced in both directions using the DYEnamic ET Dye Terminator cycle sequencing kit (GE Healthcare) and read in a MegaBacE 1000 automated DNA sequencer.
Sequence electropherograms were visually inspected and edited using Chromas Lite 2.01 or FinchTV 1.4.0. Se-quences were aligned with the CLUSTALW algorithm (Higgingset al., 1996) implemented inMEGA4 (Tamuraet al., 2007), followed by manual verification and editing. The resulting novel puma sequences were deposited in GenBank (accession numbers KF460496-KF460523).
Data analysis
Nucleotide and haplotype (gene) diversity indices were estimated with DnaSP 5.10 (Librado and Rozas, 2009) for the total sample, as well as for a sample set re-stricted to South America. In addition, we estimated diver-sity indices for geographic subsets identified in this study as distinct historical units (see below).
To investigate the evolutionary relationships among puma mtDNA lineages, haplotype networks were built us-ing the median-joinus-ing approach (Bandeltet al., 1999), as implemented in the software Network 4.5.1.6. We explored two outgroup options for rooting the network, one with the P. yagouaroundisequences generated here, and the other employingM. trumanisequences (Barnettet al., 2005).
We also performed an Analysis of Molecular Variance (AMOVA) (Excoffier et al., 1992) with Arlequin 3.5.1.2 (Excoffier and Lischer, 2010) to assess the differentiation among geographic populations, using samples from 174 in-dividuals. Twelve samples were excluded (see Table S1) due to insufficient information on local provenance,i.e. cases where the original geographic information was absent (the case of some zoo animals) or too broad, such as a large coun-try. This subset was also used in all other analyses that re-quired precise geographic provenance, such as all AMOVAs, Mantel tests, spatial autocorrelation, regional neutrality tests, mismatch distribution and Bayesian skyline plots (see below for additional details).
AMOVAs were performed usingFstcomputed from a pairwise matrix based onp-distances. Statistical signifi-cance ofFstvalues was tested using 10,000 permutations. To minimize the effect of prior assumptions on puma geo-graphic subdivision we tested a variety of different scenar-ios attempting to identify the best possible way to represent historical population structure in this species (i.e.the one that maximizes the estimatedFst). These AMOVAs were based on two sample sets: (1) South America (SA) only: and (2) the full sample of SA, Central America (CA) and North America (NA).
Within sample set 1, we assessed the following sce-narios: 1a) the four SA subspecies suggested by Culveret al.(2000); 1b) grouping samples according to their biomes of origin (adapted from IBGE (2010) and Olson et al. (2001)) while sequentially joining adjacent populations that exhibited non-significantFstvalues; 1c) a sequential approach in which samples were initially grouped by im-mediate geographic proximity, then merged with other groups when they exhibited non-significant p-values for
their pairwiseFst, and subsequently joined to additional contiguous populations with which theFst estimate was low. For strategies 1b and 1c, the overallFstvalue was monitored at every sequential step and the successive grouping strategy was maintained until a peak was ob-served. In this process, when we observed non-significant p-values between population groups, we still tested the ef-fect of changing individuals from one adjacent unit to the other, so as to fine-tune the estimate that maximized the overallFstvalue for this sample set.
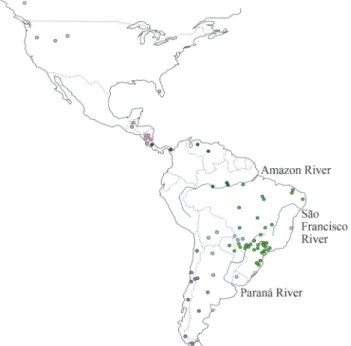
A third round of AMOVAs was performed to test the hypotheses raised by Culveret al.(2000), who postulated that major South American rivers could act as historical barriers to gene flow in this species. This was performed separately for the Amazon and Paraná rivers, by consider-ing populations on either side of each river as distinct geo-graphic units. Only populations located near the respective river were considered here. Given the available sampling on both sides of each river, we established an arbitrary cut-off of£610 km on each side of the Paraná, and£1340 km for the Amazon, so as to include a reasonable number of in-dividuals and localities in both assessments.
Additionally, to investigate spatial patterns of genetic structure in pumas we assessed the correlation between ge-netic and geographic distances for all pairs of sampled indi-viduals using a Mantel test (Mantel, 1967). This was per-formed with the program Alleles in Space (AIS) (Miller, 2005), employing the proportion of differences (i.e.a p-dis-tance equivalent) to generate the genetic disp-dis-tance matrix and 10,000 permutations to assess statistical significance. We also employed AIS to perform a spatial autocorrelation analysis of the data set, using 11 distance classes, equalized sample sizes across classes, and 10,000 permutations to as-sess significance.
Finally, we conducted a set of analyses to investigate the demographic history of pumas. We performed neutral-ity tests (Tajima’s D, Fu & Li’ D* and F*, Fu’s Fs) with DnaSP, as well as a mismatch distribution analysis (Rogers and Harpending, 1992; Schneider and Excoffier, 1999) with Arlequin. In addition, we used the program Beast 1.6.1 (Drummond and Rambaut, 2007) to perform estimates of coalescence times and past demography. We defined the best model of nucleotide substitution for our data set, which was the HKY (Hasegawaet al., 1985) + G model, using the Akaike Information Criterion (AIC, Akaike, 1974) imple-mented in jModelTest 0.1 (Posada, 2008). Our first set of Beast runs was aimed at estimating the molecular clock rate for our segment in puma lineages. We assumed a Yule Pro-cess for the tree prior and incorporated an uncorrelated lognormal relaxed molecular clock. In order to better fit the expectations of the Yule process we only included five di-vergent puma haplotypes, along with the two jaguarundi se-quences generated here. To calibrate the molecular clock we assumed that pumas and jaguarundis diverged between 3.16 and 6.01 MYA (95% HPD of the estimate reported by Johnsonet al.(2006) using a nuclear supermatrix). We ap-plied a uniform prior using these ages as conservative mini-mum and maximini-mum boundaries, respectively. The final run was based on 108MCMC generations, with samples taken every 104steps, and the first 104steps removed as burn-in.
The second set of Beast analyses aimed to infer the time of the most recent common ancestor (tMRCA) of
differ-ent groups of samples, as well as to reconstruct the demo-graphic history of pumas by estimating past fluctuations in population size via the Bayesian Skyline Plot (BSP)
ap-proach (Drummondet al., 2005). We assumed a Bayesian skyline tree prior and a strict molecular clock, whose evolu-tionary rate was based on the estimate derived from the first round of analyses. We assessed thetMRCAfor four different
sample sets: (i) complete sample; (ii) South America only; (iii) North and Central Americas (NA+NCA); and (iv) a subset of 24 NA+NCA samples that formed a regionally endemic subclade in the haplotype network, suggestive of autochthonous diversification (see Results). The BSP anal-yses were performed only for sets (i) and (ii), as their larger sample size allowed for more robust demographic infer-ences. The MCMC parameters were the same as in the first set of Beast analyses.
Results
After removal of incorporated primer sequences and low-quality fragment edges, double-stranded sequences for a 669-bp segment of the mtDNAND5gene were obtained for 156 puma individuals sampled in South America, 17 from Central America, and 13 from North America (Table S1, Figure 1). Additional sequences of the same fragment were obtained for twoP. yagouaroundiindividuals.
The puma data set contained 33 variable sites (32 transitions and one transversion), 25 of which were phylo-genetically informative (Table 1). Overall, there were 28 haplotypes, 22 of which occurred in South America
Puma
demographic
history
rence as defined by the AMOVA.
Haplotype Variable sitesa
N Geographic groupsb
087* 115* 131* 173* 183* 198 204* 273* 318* 322 327* 335* 336* 339* 378* 396 399 411* 429* 442* 454* 459* 465* 498* 513 531* 534* 540* 552* 574 606 637 669*
H01 T A C A C C G A T C A G C T C C T T G A T C G T C G C C C C C C C 15 CNESA (15)
H02 . . . C . . . T 34 CNESA (34)
H03 . . . A G . . . A . . . C . . . C . . . . T . . . T 7 CNESA
(1), ESA (6)
H04 . . . T . . . C . . . T 1 CNESA (1)
H05 . . T . . . C . . . C . G . . . T 2 CSSA (2)
H06 . . . C . . . C . . . T 4 CNESA (3),
CSSA (1)
H07 . . . C . . . C . G . . . T 9 CNESA (4),
CSSA (3), SWSA (2)
H08 . . . T . . . C . . . C . G . . . T 1 CSSA (1)
H09 . . . C . G . . . T 17 SCA (3),
CNESA (8), CSSA (6)
H10 . . . C . . . T . . . T 12 CNESA (12)
H11 . . . C . . . C . . . A . . T 1 CNESA (1)
H12 . . . C . . . C . G . T . . . T 2 CSSA (2)
H13 . . . T 2 CNESA (2)
H14 . . . T . . . T . T . . C . . . T 2 CNESA (2)
H15 . . . . T . . . T . . C . . . T 8 CNESA (8)
H16 . . . C . G . T . . . T 6 NSA (5),
CNESA (1)
H17 . . . . T . . . T . C C . . . T 1 CNESA (1)
H18 C . . . G . . . C . . . T 11 SWSA (11)
H19 . . . G . . . C . G . . . T 7 SWSA (7)
H20 . . . A . . . C . G . . . T 1 NSA (1)
H21 C . . . C . . . C . G . . . T 3 CNESA (3)
H22 . . . C . . . C . G . . . T T 1 CNESA (1)
H23 . G . . . C A . . . T T . . . . T 18 NCA+NA (17),
SCA (1)
H24 . . . G . . . C . . . . A . . A . . T . . . T 3 NCA+NA (1),
SCA (2)
H25 . G . . . C A . . . T . T T . . . . T 1 NCA+NA (1)
H26 . G . . . C A . C . . . T T . . . . T 3 NCA+NA (3)
H27 . G . . . T . C A . . . T T . . . . T 1 NCA+NA (1)
H28 . G . . . C A . . . T T . . T . T 1 NCA+NA (1)
aAsterisks indicate phylogenetically informative sites.
bGeographic group codes are as follows: NCA+NA: Northern Central America + North America; SCA: Southern Central America; NSA: Northern South America; CNESA: Central-North-Eastern South America;
(H01-H22), one of them (H09) being shared with Central America (Figure 2A). Moderate to high levels of haplotype diversity were observed, while nucleotide diversity was rather low (Table 2).
Evolutionary relationships among haplotypes were inferred using the median-joining network approach (Fig-ure 2A), which showed a clear separation between lineages from South America (H01-H08, H10-H22) and those from North America and most of the haplotypes from Central America (H23-H28). The main exception was a haplotype (H09) found in southern Central America (Costa Rica), which is also common in central South America and is equidistant (five mutational steps) from the two closest
haplotypes found in Central and North America (H23 and H24).
Among the 22 South American haplotypes, two (H16 and H20) were found north of the Amazon River (Brazil and Venezuela), with H16 also being sampled in one indi-vidual from southern Brazil. We observed very high levels of genetic diversity in central South America (including Bolivia, Paraguay, Uruguay, northern Argentina and the central-western, southeastern and southern regions of Bra-zil), where 15 distinct haplotypes were sampled (H01-H12, H14, H15 and H21). Among these, some haplotypes exhib-ited a localized distribution, such as H05, H08 and H12, which were found only in the Pantanal biome. A peculiar
Figure 2- Median-joining networks based on pumaND5haplotypes. The area of each circle is proportional to the haplotype frequency. The relative fre-quency of populations in each haplotype is indicated by the proportion of different colors (coded as in Figure 1). A) Analysis of the full data set (669 bp). The arrow indicates the point where the outgroupP. yagouaroundiis connected. B) Analysis of a subset of the nucleotide sites that overlap with the Miracinonyx trumanisequence (286 bp). Arrows indicate the points where the outgroup taxa join the network:P. yagouaroundi(in gray; 32 mutational steps from the connection point), andM. trumani(in black; 19 steps from the connection point).
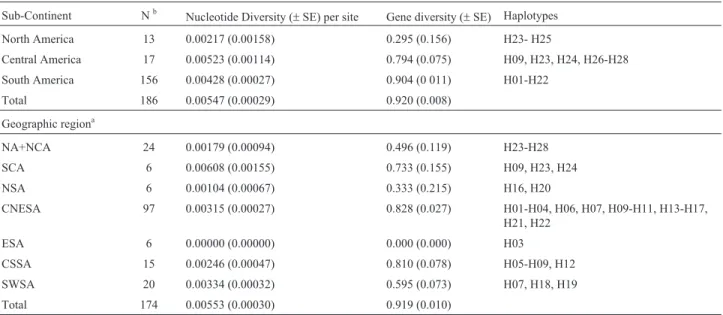
Table 2- Nucleotide and gene diversity levels observed inPuma concolor ND5sequences. Geographic groups were defined on the basis of the AMOVA results (see text and Tables 1 and 3).
Sub-Continent Nb Nucleotide Diversity (
±SE) per site Gene diversity (±SE) Haplotypes North America 13 0.00217 (0.00158) 0.295 (0.156) H23- H25
Central America 17 0.00523 (0.00114) 0.794 (0.075) H09, H23, H24, H26-H28 South America 156 0.00428 (0.00027) 0.904 (0 011) H01-H22
Total 186 0.00547 (0.00029) 0.920 (0.008)
Geographic regiona
NA+NCA 24 0.00179 (0.00094) 0.496 (0.119) H23-H28
SCA 6 0.00608 (0.00155) 0.733 (0.155) H09, H23, H24
NSA 6 0.00104 (0.00067) 0.333 (0.215) H16, H20
CNESA 97 0.00315 (0.00027) 0.828 (0.027) H01-H04, H06, H07, H09-H11, H13-H17, H21, H22
ESA 6 0.00000 (0.00000) 0.000 (0.000) H03
CSSA 15 0.00246 (0.00047) 0.810 (0.078) H05-H09, H12
SWSA 20 0.00334 (0.00032) 0.595 (0.073) H07, H18, H19
Total 174 0.00553 (0.00030) 0.919 (0.010)
aGeographic acronyms are as in Table 1.
bN = number of individuals sampled for each continent/region. All samples (n = 186) were used for the sub-continental analysis, while 12 individuals
case was that of haplotype H03, sampled east and southeast of the São Francisco River (see Figure 1), and also in one individual from the Brazilian central-western region. This haplotype is five mutational steps away from its closest rel-atives, a distance which is equal to or larger than that ob-served between South American lineages and most of those sampled in North and Central America (4 mutational steps: H23 and H24; 5 mutational steps: H25, H26, H27 and H28). Individuals sampled along the Andes harbored two different haplotypes (H18 and H19), with H18 being more broadly distributed across the central and southern Cordil-lera, all the way to its extreme south in Patagonia.
In contrast, a single main haplotype (H23) was sam-pled in all surveyed countries from North and Central Americas (see Figure 2A). Four other haplotypes were con-nected to this common sequence by a single mutational step each, leading to a star-like appearance of this portion of the network. Among these haplotypes related to H23, H25 was found in the Florida peninsula (USA), H27 in Nicaragua, H28 in Guatemala, and H26 was sampled in both of the lat-ter countries. Another haplotype (H24) found in Central and North America (Panama, Costa Rica and Florida penin-sula [USA]) was quite distinct, differing by 8 mutational steps from H23, and by 4 steps from its closest relative, the common South American haplotype H02.
When theP. yagouaroundisequences were used as outgroups in the network (Figure 2A) they were connected by 85 mutational steps to puma haplotype H01, supporting this position for the puma mtDNA root. Haplotype H01 is found in central South America (Paraguay, as well as the Brazilian states MS, SP and MG), differing by at least six mutational steps from the main North and Central Ameri-can haplotypes. When theM. trumani sequence was in-cluded in the network (Figure 2B), the sequence alignment length was reduced to 286 bp to match the segment avail-able for this outgroup. Due to this reduction in the number of sites, the network became less resolved, but the results still suggested that the outgroup was connected more closely to South American and southern Central American pumas than to northern Central and North American haplo-types.
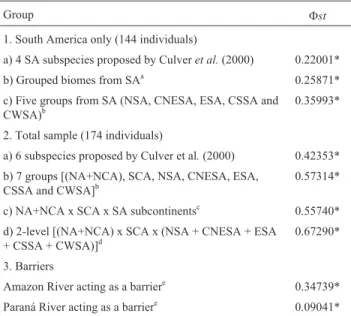
To investigate the population genetic structure in more quantitative detail we performed several rounds of AMOVA, employing different geographic clustering strat-egies. In the first stage, when only South American pumas were analyzed,Fstvalues were quite high and statistically significant, with strategy 1c yielding the highest overallFst (Table 3). In the second round of AMOVA, using the full sample set, we found even higherFstvalues. The highest overall value was obtained with strategy 2d, employing a two-level AMOVA (Table 3). Central America was best represented as two distinct groups, northern and southern, with the former being merged with North America. In the best two-level scenario (see Table 3), we also noted that the FscandFctwere 0.41904 (p = 0.000+0.000) and 0.43693
(p = 0.01871+-0.00135), respectively. Pairwise estimates ofFstwere carried out at the various spatial scales tested in these scenarios, and helped assess the distinctiveness of large-scale as well as regional population units (Tables S4 and S5).
Finally, we performed a third round of AMOVA to test two large rivers as possible barriers to historical gene flow in this species. We observed highFstvalues when the Amazon River was assessed (see Table 3). TheFstvalue found for the Parana River was rather low (0.09), although still statistically significant.
Mantel Tests (Figure S1) revealed a significant corre-lation between genetic and geographic distances for the to-tal geographic sample (r = 0.48; p < 0.001), indicating that isolation by distance plays a relevant role in the genetic structuring of this species. As for the analysis of South American samples alone, the resulting value was 0.085 Table 3- BestFstvalues for different population structure scenarios in Puma concolor, as assessed with an AMOVA approach.
Group Fst
1. South America only (144 individuals)
a) 4 SA subspecies proposed by Culveret al.(2000) 0.22001* b) Grouped biomes from SAa 0.25871*
c) Five groups from SA (NSA, CNESA, ESA, CSSA and
CWSA)b 0.35993*
2. Total sample (174 individuals)
a) 6 subspecies proposed by Culver et al.(2000) 0.42353* b) 7 groups [(NA+NCA), SCA, NSA, CNESA, ESA,
CSSA and CWSA]b 0.57314*
c) NA+NCA x SCA x SA subcontinentsc 0.55740*
d) 2-level [(NA+NCA) x SCA x (NSA + CNESA + ESA
+ CSSA + CWSA)]d 0.67290*
3. Barriers
Amazon River acting as a barriere 0.34739*
Paraná River acting as a barriere 0.09041*
* SignificantFst(p < 0.01).
a3 groups: 1st-northern Amazon Rainforest (Tropical Moist Broadleaf
For-ests), Tropical Dry Broadleaf Forests and Tropical Grasslands, Savannas and Shrublands in Venezuela; 2nd-southern Amazon Rainforest and
Atlan-tic Forests (Tropical and Subtropical Moist Broadleaf Forests), Pantanal (Flooded Grasslands and Shrublands), Caatinga (Xeric Shrublands), Cer-rado, Pampas, Gran Chaco and Beni Savanna (Tropical and Subtropical Grasslands, Savannas and Shrublands), Patagonian Pampas (Temperate Grasslands, Savannas and Shrublands) and Tropical Dry Broadleaf For-ests in Bolivia; 3rd-Andean biomes: Temperate Broadleaf and Mixed
For-ests, Montane Grasslands and Shrublands, Desert and Xeric Shrublands and Mediterranean Forests, Woodlands and Scrubs (Olsonet al., 2001; IBGE 2010).
bAcronyms for geographic groups are as defined in Table 1 and Figure 1. cCentral America was divided into two separate groups, northern (NCA)
and southern (SCA).
d1stlevel: 3 groups: NA+NCA (2 populations), SCA (1 population), SA (5
populations); 2ndlevel: 7 populations ([NA + NCA] x [SCA] x [NSA +
CNESA + ESA + CSSA + CWSA]);
(p = 0.09347), which suggests that within this subcontinent there is no significant influence of isolation by distance.
The spatial autocorrelation analysis (performed only for the full data set) yielded results that were consistent with those of the Mantel test. There was a trend for an in-crease in the statistic Ay (representing the average pairwise genetic distance within geographic distance class ‘y’) as the geographic distance increased, and the overall relationship was statistically significant (p = 0.0048), supporting the in-ference that isolation by distance affected the patterns ob-served in our global data set.
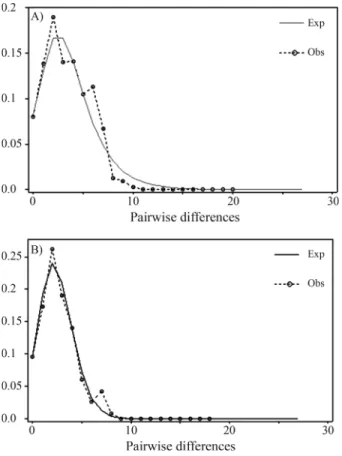
Another front of analyses pertained to demographic history assessments. When we conducted a Mismatch Dis-tribution analysis, the results indicated a unimodal pattern for both data sets (full sample and South American samples only) (Figure 3) compatible with a scenario of recent demo-graphic expansion. In addition, the neutrality tests yielded negative values for all indices, with those of Fu’s Fs being significantly negative with respect to neutral expectations for both data sets (Table 4).
The Bayesian analyses performed with Beast further helped shed light onto the historical demography pumas as revealed by the mtDNA. In the first round of analyses, us-ing five individuals with the most divergent haplotypes and
two jaguarundis, we estimated the substitution rate of the analyzed ND5 segment to be 2.054% per million years (MY). Applying this substitution rate in the second set of analyses, we inferred the meantMRCAof pumas to be 0.237
MYA (95% HPD: 0.105-0.391 MYA). For South Ameri-can pumas, the mean tMRCA was estimated to be 0.211
(0.091-0.353) MYA. When North American (NA) and Central American (CA) samples were analyzed separately, their mean estimatedtMRCAwas 0.231 (0.102-0.387) MYA.
Finally, we estimated thetMRCAfor a subset of 24 NA+CA
samples that formed an endemic monophyletic cluster (see Figure 2A), yielding a value of 0.037 (0.006-0.077) MYA.
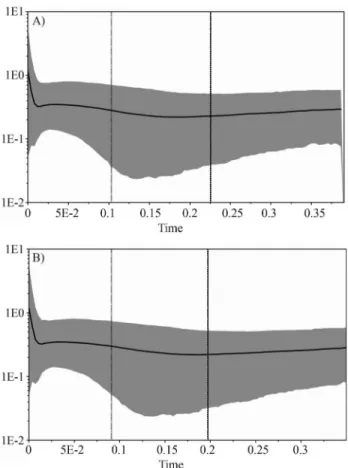
The Bayesian skyline plot analysis revealed evidence of a very recent (ca. 8,000 years ago) demographic expan-sion in pumas (Figure 4). The signal for this expanexpan-sion was apparent with both data sets (full sample and South Ameri-can pumas only), with only minor differences in the esti-mated parameters.
Discussion
mtDNA diversity and genealogical history
The mtDNA data set analyzed in this study allowed a deeper understanding of the matrilineal history of pumas, refining, extending and in some cases adjusting the infer-ences previously put forth by Culveret al.(2000). Our ini-tial observation was thatND5is indeed a very informative coding mtDNA segment for phylogeographic studies of felids, and that the longer segment employed here (relative to the one reported by Culveret al., 2000) does provide use-ful additional information regarding this species’ diversity and evolutionary history. For example, theND5 data set used here contained 33 variable sites and allowed the iden-tification of 28 different puma haplotypes, while the full data set employed by Culveret al.(2000), includingND5, ATP8and 16S segments, contained 15 variable sites and defined 14 different haplotypes.
Pumas exhibited moderately high levels of diversity, which could be directly compared to only two other felid species that have so far been sequenced for the same mtDNA segment and whose sequences for available for as-sessment (Trigo et al., 2008). Both of these Neotropical cats,Leopardus tigrinusandL. geoffroyi, were sequenced for a slightly shorter fragment, so we adjusted our align-ment to include only the matching 567 bp and thus allow an Figure 3- Graphs depicting the results of the Mismatch Distribution
anal-ysis for the total sample (A) and South American samples alone (B). The analysis was performed with 669 bp ofP. concolor ND5sequences (ex-cluding all sites with missing information or gaps). The dashed line repre-sents the observed pattern, while the continuous line depicts the pattern ex-pected under a model of sudden demographic expansion.
Table 4- Neutrality tests forPuma concolor ND5sequences, considering both the ‘Total’ and ‘South American’ (SA) sample sets.
Total SA
Tajima’s D -1.16291 -0.98375
Fu and Li’s D* -0.82174 -0.39340 Fu and Li’s F* -1.15989 -0.75225
Fu’s Fs -9.322a -7.283a
exact comparison (Table S3). This assessment revealed that pumas possess higher gene diversity than either of these other species, as well as slightly higher nucleotide sity. Indeed, the observed levels of haplotype (gene) diver-sity in pumas were quite high, while nucleotide diverdiver-sity was more modest, suggestive of rather recent mtDNA co-alescence in this species.
When subcontinental or regional groups of pumas were compared, we observed that haplotype and nucleotide diversity indices were consistently higher for South and Central America, relative to those estimated for North America (Table 2). Gene diversity was highest for South America, while nucleotide diversity reached a maximum in Central America. North American pumas presented low values for both indices, which were at least two-fold lower than those of the other sub-continental groups. When the South American regional groups defined by the AMOVA (see Figure 1 and Table 3 for their definition) were as-sessed, we observed that the CNESA and CSSA groups
ex-hibited the highest haplotype diversity, with the SWSA and NSA groups also presenting high values (Table 2).
The high gene diversity estimated for pumas could be examined in more detail with the use of haplotype networks (Figure 2A), which depicted intricate relationships among sequences, especially in South America. Such a pattern is indicative of a complex evolutionary history, with some suggestion of geographic structuring but no clear-cut sepa-ration of well-defined clades. Some portions of the network are suggestive of a recent population expansion involving South American lineages, with central haplotypes giving rise to multiple derived sequences differing by a single mutational step each. Central America was also observed to bear a complex mixture of haplotypic lineages, with more than one connection to basal South American sequences and evidence of internal structure (see Figure 2A and Table 3). In contrast, the lineages sampled in North America ex-hibited a much simpler pattern, dominated by a common haplotype (H23) shared with Central America, from which four other lineages have recently evolved. This shape is in-dicative of a recent population expansion involving these haplotypes, whose sampling locales indicate a present dis-tribution across North America and also in Central Amer-ica, especially in the northern portion of the latter (Figures 1 and 2).
In North America, an unusual pattern was observed in an individual from Florida (USA) that carried haplotype H24, which is shared with animals from southern Central America (Panama and Costa Rica) and is genetically dis-tant from the other lineages found throughout North Amer-ica. Given the record of human-induced introgression of puma mtDNA lineages from Central America to Florida in the 1960s (O’Brienet al., 1990), it is possible that this indi-vidual descends from a female translocated during that pe-riod, implying that such haplotype sharing may be a hu-man-induced artifact. If this were indeed the case, our results would in fact be an underestimate of the differentia-tion between SCA and NA+NCA, since haplotype H24 may only naturally occur in the former.
Central America and northern South America (NSA) did not share haplotypes, implying no evidence of historical matrilineal gene flow between these regions. Possible bar-riers include the northernmost Andean Cordillera or the Darien Straits in Panama, as suggested for jaguars by Eizi-riket al.(2001) (but see Ruiz-Garciaet al., 2013 for a dif-ferent view). Detailed sampling in that region would be required to distinguish between these two hypotheses. Al-though no haplotype was shared between Central America and northern South America, we did observe a shared haplotype (H09) between southern Central America (Costa Rica) and the central region of South America. This sug-gests some continued matrilineal connectivity between these areas (necessarily going through northern South America), or the retention of an ancestral polymorphism that predates the implicated phylogeographic subdivision. Figure 4- Bayesian Skyline plots derived from an alignment of puma
ND5sequences. In (A) the analysis was run for all puma samples, and in (B) for South American pumas only. The thick solid line represents the mean, while the 95% HPD (highest posterior density) limits are shown by the blue areas. The vertical dashed lines refer to thetMRCA, with the thin line
indicating the lower 95% HPD limit, and the thick line representing the mean. The x-axis is depicted on a scale of millions of years (myr). The y-axis represents the effective population size (Ne) multiplied by the
Since the available sampling for northern South America is still modest (see Figure 1), both hypotheses remain viable and should be the focus of additional scrutiny. Moreover, northwestern South America has been reported to harbor high levels of genetic diversity and a complex evolutionary history for several mammalian taxa (e.g. Eizirik et al., 1998; Ruiz-Garcíaet al., 2009, 2010, 2012; Thoisyet al., 2010), highlighting the need to further investigate pumas from this portion of their range to assess their role in the overall phylogeographic structure of the species.
The network root based on the outgroup Puma yagouaroundiindicates that the most ancestral lineage of current pumas is located primarily in central South Amer-ica. When we consideredM. trumanias the outgroup, once again the rooting was placed primarily in South America, reasserting the area of occurrence of the earliest ancestor of the current lineages and helping reveal the direction of evo-lution of pumas throughout their distribution.
Population structure
The AMOVA results revealed extremely high Fst values in many of the assessed scenarios (see Table 3). The highestFstvalue, used to define the scenario that best ex-plains the current partitioning of mtDNA diversity, was found when a 2-level AMOVA was conducted. The first level separated “subcontinents” as major units (NA+NCA, SCA and SA), while the second level identified subdivi-sions within the “subcontinents”. Several analyses, follow-ing the steps outlined in the AMOVA strategy 2b (data not shown), demonstrated that other possible groupings were almost as good, indicating that there is no clear-cut defini-tion of the structure in central South America, but demon-strating that this region is a genetic hotspot for this species, with considerable structure but complex historical relation-ships.
Our next step was to assess the role of major rivers as historical barriers to female gene flow. Our sampling al-lowed a test of two riverine barriers proposed by Culveret al.(2000), which postulated that the Amazon and Paraná rivers might have induced the differentiation of historical population units. Our results supported an important role for the Amazon River, corroborating the hypothesis previ-ously raised for pumas (Culveret al., 2000), and showing a pattern consistent with inferences made for other Neotropi-cal felids such as Leopardus pardalis, L. wiedii and Panthera onca(Eiziriket al., 1998, 2001). On the other hand, the influence of the Paraná River appears to be much lower than previously hypothesized, although we still ob-served significantFstvalues when we compared popula-tions separated by this watercourse. Although they were significant, the magnitude of the differentiation was con-siderably lower than that estimated for the Amazon River (see Table 3), and several AMOVA assessments comparing regional populations on the same side of the Paraná River yielded higherFstvalues than those obtained in the
com-parison between the two sides. These findings suggest that, although this river may play a role in limiting regional ma-ternal gene flow in pumas, it does not induce major differ-entiation between clear-cut historical units. Such an observation has implications for the definition and delimi-tation of puma subspecies, two of which (P. c. cabreraeand P. c. capricornensis) have been suggested to be separated by this river (Culveret al., 2000).
Demographic history
ThetMRCAestimates derived from both data sets were
very similar, indicating that the age of the common ancestor for all samples was essentially the same as that for the South American subset. Taken together with the other re-sults (e.g.network, diversity indices), this finding supports the inference that most of the extant diversity of the puma mtDNA resides in South America, and that the deepest his-tory of coalescence of its lineages is fully represented in this subcontinent.
The signal of demographic expansion on both sub-continents suggests that this process seems to have oc-curred simultaneously, after the last glacial maximum. This inference is consistent with the hypothesis raised by Culver et al.(2000), of an extinction of North American pumas in the late Pleistocene, followed by re-colonization from South America. Our results corroborate and extend this hy-pothesis, showing evidence for a substantial and very re-cent demographic expansion in South America, which likely preceded or included the re-colonization of North America. Such a pattern was not clearly observed in previ-ous studies and sheds light onto the historical demography of present-day puma lineages. Our findings indicate that pumas were substantially affected by faunal changes in-duced by the Late Pleistocene extinction of large mammals, likely disappearing from North America, as previously pos-tulated, with subsequent recolonization from the south. What is new in our results is the inference of a substantial demographic expansion in South America ca. 8,000 years ago, possibly induced by release from competitive interac-tions with other large carnivores that went extinct during the Late Pleistocene event. We see no evidence of a second-ary expansion in North America, as the full data set mirrors the results observed with South America alone. We thus conclude that pumas likely re-colonized North America spurred by this Holocene demographic expansion stem-ming from South America. If corroborated by additional genetic markers and more refined sampling, especially in northern South America, this hypothesis would provide a useful demographic framework for pumas against which local patterns of genetic structure, genomic variation and population connectivity can be assessed.
Acknowledgments
T.C. Trigo and T.L.L. Simão for laboratory assistance and helpful discussions regarding data analysis and interpreta-tion, as well as J. Schiefelbain and M. G. da Silva for addi-tional support. This work was funded by Conselho Nacional de Desenvolvimento Científico e Tecnológico (CNPq), Brazil, and Companhia Energética de São Paulo (CESP), Brazil. Part of this research was also supported by funds from the Intramural Research Program of the Na-tional Institutes of Health, NaNa-tional Cancer Institute, USA awarded to WEJ and SJO.
References
Akaike H (1974) A new look at the statistical model identifica-tion. IEEE Trans Autom Contr 19:716-723.
Avise JC (1998) The history and purview of phylogeography: A personal reflection. Mol Ecol 7:371-379.
Bandelt HJ, Forster P and Röhl A (1999) Median-Joining net-works for inferring intraspecific phylogenies. Mol Biol Evol 16:37-48.
Barnett R, Barnes I, Phillips MJ, Martin LD, Harington CR, Leon-ard JA and Cooper A (2005) Evolution of the extinct Sabre-tooths and the American cheetah-like cat. Curr Biol 15:R589-R590.
Beier P, Vaughan MR, Conroy MJ and Quigley H (2003) A re-view of literature related to the Florida panther. Bureau of Wildlife Diversity Conservation - Florida Fish and Wildlife Conservation Commission, Tallahassee, 203 pp.
Castilho CS, Marins-Sá LG, Benedet RC and Freitas TO (2011) Landscape genetics of mountain lions (Puma concolor) in
southern Brazil. Mammal Biol 76:476-483.
Culver M, Johnson WE, Pecon-Slattery J and O’Brien SJ (2000) Genomic ancestry of the American Puma (Puma concolor). J Hered 91:186-197.
Doyle JJ and Doyle JL (1987) A rapid DNA isolation procedure for small quantities of fresh leaf tissue. Phytochem Bull 19:11-15.
Drummond AJ and Rambaut A (2007) BEAST: Bayesian evolu-tionary analysis by sampling trees. BMC Evol Biol 7:e214. Drummond AJ, Rambaut A, Shapiro B and Pybus OG (2005) Bayesian coalescent inference of past population dynamics from molecular sequences. Mol Biol Evol 22:1185-1192. Eizirik E (2012) A molecular view on the evolutionary history and
biogeography of Neotropical carnivores (Mammalia, Carnivora). In: Patterson BD and Costa LP (eds) Bones, Clones, and Biomes: An Extended History of Recent Neo-tropical Mammals. University of Chicago Press, Chicago, pp 123-142.
Eizirik E, Bonatto SL, Johnson WE, Crawshaw Jr PG, Vie JC, Brousset DM, O’Brien SJ and Salzano FM (1998) Phylo-geographic patterns and evolution of the mitochondrial DNA control region in two Neotropical cats (Mammalia, Felidae). J Mol Evol 47:613-624.
Eizirik E, Kim J-H, Menotti-Raymond MA, Crawshaw Jr PG, O’Brien SJ and Johnson WE (2001) Phylogeography popu-lation history and conservation genetics of jaguars (Panthera onca, Mammalia, Felidae). Mol Ecol 10:65-79. Excoffier L and Lischer H (2010) Arlequin suite ver. 3.5: A new
series of programs to perform population genetics analyses under Linux and Windows. Mol Ecol Resourc 10:564-567.
Excoffier L, Smouse PE and Quattro JM (1992) Analysis of mo-lecular variance inferred from metric distances among DNA haplotypes: Application to human mitochondrial DNA re-striction data. Genetics 131:479-491.
Hasegawa M, Kishino H and Yano T (1985) Dating of human-ape splitting by a molecular clock of mitochondrial DNA. J Mol Evol 22:160-174.
Higgings DG, Thompson JD and Gibson TJ (1996) Using CLUS-TAL for multiple sequence alignments. Meth Enzymol 266:383-402.
Johnson WE, Culver M, Iriarte JA, Eizirik E, Seymour KL and O’Brien SJ (1998) Tracking the evolution of the elusive An-dean mountain cat (Oreailurus jacobita) from mitochondrial DNA. J Hered 89:227-232.
Johnson WE, Pecon-Slattery J, Eizirik E, Kim JH, Menotti-Raymond M, Bonacic C, Cambre R, Crawshaw P, Nunes A, O’Brien SJ,et al.(1999) Disparate phylogeography patterns
of molecular genetic variation in four closely related South American small cat species. Mol Ecol 8:S79-S92.
Johnson WE, Eizirik E, Pecon-Slattery J, Murphy WJ, Antunes A, Teeling E and O’Brien SJ (2006) The late Miocene radiation of modern Felidae: A genetic assessment. Science 311:73-77.
Kurtén B and Anderson E (1980) Pleistocene Mammals of North America. Columbia University Press, New York, 442 pp. Librado P and Rozas J (2009) DnaSP ver. 5: A software for
com-prehensive analysis of DNA polymorphism data. Bioinform Appl Note 25:1451-1452.
Logan KA and Sweanor LL (2001) Desert puma: evolutionary ecology and conservation of an enduring carnivore. Island Press, Washington, D.C., 470 pp.
Maehr DS, Land ED, Shindle DB, Bass OL and Hoctor TS (2002) Florida panther dispersal and conservation. Biol Conserv 106:187-197.
Mantel N (1967) The detection of disease clustering and a gener-alized regression approach. Cancer Res 27:209-220. Miller MP (2005) Alleles in Space (AIS): Computer software for
the joint analysis of interindividual spatial and genetic infor-mation. J. Hered 96:722-724.
Miotto RA, Cervini M, Figueiredo MG, Begotti RA and Galetti Jr PM (2011) Genetic diversity and population structure of pu-mas (Puma concolor) in southeastern Brazil: Implications
for conservation in a human-dominated landscape. Conserv Genet 12:1447-1455.
Miotto RA, Cervini M, Begotti RA and Galetti Jr PM (2012) Mon-itoring a puma (Puma concolor) population in a fragmented landscape in southeast Brazil. Biotropica 44:98-104. Nowak RM (1999) Walker’s Mammals of the World. Vol. 2. 6th
ed. The Johns Hopkins University Press, Baltimore, pp 818-820.
O’Brien SJ, Roelke M, Yuhki N, Richards KW, Johnson WE, Franklin WL, Anderson AE, Bass Jr OL, Belden RC and Martenson JS (1990) Genetic introgression within the Flo-rida Panther Felis concolor coryi. Natl Geogr Res 6:485-494.
Olson DM, Dinerstein E, Wikramanayake ED, Burgess ND, Powell GVN, Underwood EC, D’Amico JA, Itoua I, Strand HE, Kassem KR,et al.(2001) Terrestrial ecoregions of the
World: A new map of life on earth. BioScience 51:933-938. Posada D (2008) jModelTest: Phylogenetic model averaging. Mol
Pusey AE and Packer C (1987) The evolution of sex-biased dis-persal in lions. Behaviour 101:275-310.
Redford KH and Eisenberg JF (1992) Mammals of the Neo-tropics. Vol. 2, The Southern Cone. University of Chicago Press, Chicago, 460 pp.
Rogers AR and Harpending H (1992) Population growth makes waves in the distribution of pairwise genetic differences. Mol Biol Evol 9:552-569.
Ruiz-García M, Pacheco LF and Álverez D (2009) Genetic char-acterization of the Bolivian Andean puma (Puma concolor) at the Sajama National Park (SNP) and relationships with other north-western South American puma populations. Rev Chil Hist Nat 82:97-117.
Ruiz-García M and Pinedo-Castro MO (2010) Molecular system-atics and phylogeography of the genusLagothrix(Atelidae,
Primates) by means of the mitochondrialCOIIgene. Folia
Primatol 81:109-128.
Ruiz-García M, Vásquez C, Pinedo-Castro MO, Sandoval S, Castellanos A, Kaston F, Thoisy B and Shostell J (2012) Phylogeography of the Mountain Tapir (Tapirus pinchaque) and the Central American Tapir (Tapirus bairdii) and the or-igins of the three Latin-American tapirs by means of mtCyt-B sequences. In: Anamthawat-Jónsson K (ed) Cur-rent Topics in Phylogenetics and Phylogeography of Terres-trial and Aquatic Systems. InTech, Rijeka, pp 83-116. Ruiz-Garcia M, Vásquez C, Murillo A, Pinedo-Castro M and
Alvarez D (2013) Population genetics and phylogeography of the largest wild cat in the Americas: An analysis of the jaguar by means of microsatellites and mitochondrial gene sequences. In: Ruiz-García M and Shostell J (eds) Molecular Population Genetics, Evolutionary Biology and Biological Conservation of the Neotropical Carnivores. Nova Science Publishers Inc, New York, pp 413-464.
Saiki RK, Scharf S, Fallona F, Mullis KB, Horn GT, Erlich HA and Arnheim N (1985) Enzymatic amplification of ß-globin genomic sequences and restriction site analysis for diagnosis of sickle-cell anemia. Science 230:1350-1354.
Sambrook E, Fritsch F and Maniatis T (1989) Molecular Cloning. 2nd edition. Cold Spring Harbor Press, Cold Spring Harbor, New York.
Schneider S and Excoffier L (1999) Estimation of past demo-graphic parameters from the distribution of pairwise differ-ences when the mutation rates vary among sites: Application to human mitochondrial DNA. Genetics 152:1079-1089. Smith JLD (1993) The role of dispersal in structuring the Chitwan
tiger population. Behaviour 124:165-195.
Tamura K, Dudley J, Nei M and Kumar S (2007) MEGA4: Molec-ular Evolutionary Genetics Analysis (MEGA) Software ver. 4.0. Mol Biol Evol 24:1596-1599.
Tchaicka L, Eizirik E, Oliveira TG, Candido Jr F and Freitas TRO (2007) Phylogeography and population history of the crab-eating fox (Cerdocyon thous). Mol Ecol 16:819-838.
Thoisy B, Silva AG, Ruiz-García M, Tapia A, Ramirez O, Arana M, Quse V, Paz-y-Miño C, Tobler M, Pedraza C, et al.
(2010) Population history, phylogeography, and conserva-tion genetics of the last Neotropical mega-herbivore, the lowland tapir (Tapirus terrestris) BMC Evol Biol 10:e278. Trigo TC, Freitas TRO, Kunzler G, Cardoso L, Silva JCR,
John-son WE, O’Brien SJ, Bonatto SL and Eizirik E (2008) Inter-species hybridization among Neotropical cats of the genusLeopardus, and evidence for an introgressive hybrid zone betweenL. geoffroyiandL. tigrinusin southern Brazil.
Mol Ecol 17:4317-4333.
Trinca CS, De Thoisy B, Rosas FCW, Waldemarin HF, Koepfli KP, Vianna JA and Eizirik E (2012) Phylogeography and demographic history of the Neotropical otter (Lontra longicaudis). J. Hered 103:479-492.
Woodburne MO (2010) The great american biotic interchange: Dispersals, tectonics, climate, sea level and holding pens. J Mammal Evol 17:245-264.
Internet Resources
IBGE, Instituto Brasileiro de Geografia e Estatística, http://www.ibge.gov.br (April 30, 2012). Chromas Lite ver. 2.01 Program
(http://www.technelysium.com.au) (March 12, 2011). FinchTV ver. 1.4.0 Program (http://www.geospiza.com) (March
12, 2011).
Network ver. 4.5.1.6 Program (www.fluxus-engineering.com) (April 3, 2011).
Supplementary Material
The following online material is available for this ar-ticle:
Table S1-Geographic locales included in this study. Table S2 -Puma concolorsamples analyzed in this study.
Table S3 - Nucleotide and gene diversity levels ob-served inPuma concolormtDNAND5sequences.
Table S4 - PairwiseFstvalues among subcontinental groups ofPuma concolor.
Table S5 - PairwiseFstvalues among seven major groups ofPuma concolor.
Figure S1 - Graph depicting the correlation between genetic and geographic distances calculated forP. concolor ND5mtDNA sequences.
This material is available as part of the online article from http://www.scielo.br/gmb
Associate Editor: Fabrício Rodrigues dos Santos
1
Site Name (Region, Country) No. ofindividuals
Sample IDs Geographic Coordinates (Lat/ Long)
Contact and/or Institution
British Columbia, Canada 3 Pco242, Pco258, Pco357 54.9,-124.5 LGD/NCI
Oregon, USA 1 Pco007 43.935833,-120.575 LGD/NCI
Idaho, USA 1 Pco340 43.7,-116 LGD/NCI
Yellowstone National Park, USA 2 Pco372, Pco377 44.460556,-110.827778 LGD/NCI
Texas, USA 4 Pco036, Pco037, Pco128,
Pco356
25.833333,-93.516667 LGD/NCI
Florida, USA 2 Pco077, Pco348 24.5,-79.8 LGD/NCI
El Petén, Guatemala 2 Pco556, Pco446 16.9,-89.9 LGD/NCI
Northern Central Guatemala 1 Pco555 15.5,-90.25 LGD/NCI
Southern Guatemala 1 Pco557 15.5,-90.25 LGD/NCI
Granada, Nicaragua 1 Pco549 11.933333,-85.95 LGD/NCI
Chontales, Nicaragua 1 Pco550 12.083333,-85.4 LGD/NCI
Matagalpa, Nicaragua 1 Pco552 12.916667,-85.916667 LGD/NCI
Northern Nicaragua 2 Pco554, Pco551 12.904167,-84.921944 LGD/NCI
Nueva Guinea, Nicaragua 1 Pco553 11.683333,-84.45 LGD/NCI
Costa Rica 4 Pco545, Pco547, Pco548,
Pco546
10,-84 LGD/NCI
Guanacaste, Costa Rica 1 Pco544 10.433333,-85.4 LGD/NCI
Darién, Panama 2 Pco541, Pco542 8.408333,-77.915 LGD/NCI
Falcón, Venezuela 2 Pco704, Pco703 8,-66 LGD/NCI
Barquisimeto, Venezuela 1 Pco705 10.066667,-69.316667 LGD/NCI
Tefé, AM, BR 1 bPco358 -3.353889,-64.710833 Diogo Faria/
CETAS/IBAMA/ Pró-Carnívoros
Presidente Figueiredo, AM, BR 1 bPco342 -2.017222,-60.025 Diogo Faria/
CETAS/IBAMA/ Pró-Carnívoros
Rio Preto da Eva, AM, BR 1 bPco343 -2.698889,-59.7 Diogo Faria/
CETAS/IBAMA/ Pró-Carnívoros
Antofagasta, Chile 1 Pco214 -24.616667,-69.533333 LGD/NCI
Vicuña, Chile 1 Pco208 -33,-71.516667 LGD/NCI
Ovalle, Chile 2 Pco207, Pco215 -30.6,-71.2 LGD/NCI
Mendoza, Argentina 3 Pco570, Pco573 -32.88,-69.00 LGD/NCI
Santiago, Chile/ Mendoza, Argentina 10 Pco201, Pco209, Pco210, Pco211, Pco212, Pco216, Pco217, Pco564, Pco570, Pco573
-33.073131,-70.059814 LGD/NCI
Angol/Coñaripe, Chile 1 Pco213 -32.653056,-70.011944 LGD/NCI
Villarica, Chile 1 Pco218 -39.266667,-72.216667 LGD/NCI
Torres Del Paine National Park, Chile
1 Pco200 -50.983056,-72.966389 LGD/NCI
Punta Arenas, Chile 1 Pco202 -53.15,-70.916667 LGD/NCI
Chubut, Argentina 1 Pco567 -45.8,-67.5333 LGD/NCI
La Pampa, Argentina 1 Pco565 -36.833333,-66 LGD/NCI
Cordoba, Argentina 1 Pco577 -31.416667,-64.183333 LGD/NCI
Northern Argentina 1 Pco562 -23.408333,-64.427778 LGD/NCI
Uruguay 2 Pco580, Pco582 -31.683333,-55.416667 LGD/NCI
Chaco, Paraguay 3 Pco699, Pco701, Pco581 -23.0,-58.0 LGD/NCI
Potosí, Bolivia 3 Pco706, Pco709, Pco710 -19.583333,-65.75 LGD/NCI
Santa Cruz, Bolivia 2 Pco707, Pco708 -17.8,-63.166667 LGD/NCI
2
Pró-Carnívoros Miranda, MS, BR 3 bPco063, bPco064, bPco062 -20.240833,-56.377778 Fernando Azevedo/
Projeto Gadonça
Corumbá, MS, BR 2 bPco037, bPco038 -19.008889,-57.652778 Ronaldo Morato/
Pró-Carnívoros
Corguinho, MS, BR 1 bPco326 -19.831944,-54.828889 Roberta Humberg/
CRAS Barão de Melgaço, MT, BR 11 bPco024, bPco025, bPco029,
bPco031, bPco032, bPco026, bPco027, bPco028, bPco030, bPco033, bPco036
-16.278889,-55.957778 Rodrigo Jorge/ Pró-Carnívoros
Alta Floresta, MT, BR 1 bPco041 -9.875556,-56.086111 Fernanda Michalski
/Pró-Carnívoros
Santarém, PA, BR 1 bPco082 -2.442778,-54.707778 Glaucia Pontes
Guaramiranga, CE, BR 1 bPco069 -4.262778,-38.932778 Marcos Renato
Mattos
Quixeramobim, CE, BR 1 bPco070 -5.198889,-39.292778 Marcos Renato
Mattos
Campina Grande, PB, BR 1 Pco700 -7.230556,-35.881111 LGD/NCI
Araguaína, TO, BR 1 Pco601 -7.190833,-48.206944 LGD/NCI
São Geraldo Araguaia, PA 1 bPco346 -6.400833,-48.555 Joares May/ Inst.
Biotrópicos
Araguaia, GO, BR 1 Pco697 -13.275,-50.162778 LGD/NCI
Chapada Gaúcha, MG, BR 2 bPco337; bPco338 -15.305833,-45.617778 Joares May, Edsel Amorim Jr/ Inst. Biotrópicos
Luziânia, GO, BR 1 bPco333 -16.318611,-47.78 COFAU
Goiás, BR 2 bPco316; Pco602 -15.933889,-50.14 Ivaldo M. Carvalho/
Pró-Carnívoros; LGD/NCI
Bataguassu, MS, BR 1 bPco001 -21.713889,-52.421944 Projeto Porto
Primavera
MS, BR 1 bPco019 -20.442778,-54.645833 Pró-Carnívoros
Anaurilândia, MS, BR 16 bPco020, bPco021, bPco022,
bPco023, bPco044, bPco045, bPco046, bPco047, bPco048, bPco049, bPco054, bPco056, bPco057, bPco058, bPco059, bPco067,
-22.187778,-52.717778 Dênis Sana/ Pró-Carnívoros
Batayporã, MS, BR 2 bPco043, Pco712 -22.295,-53.270833 Dênis Sana/
Pró-Carnívoros/ LGD/NCI
Ivinhema, MS, BR 7 bPco050, bPco051, bPco052,
bPco053, bPco055, bPco060, bPco066
-22.305,-53.815 Dênis Sana/ Pró-Carnívoros
Ilha Solteira, SP, BR 2 bPco319, bPco320 -20.432778,-51.342778 Rodrigo Jorge/
Pró-Carnívoros
Porto Primavera, MS, BR 2 bPco002, Pco702 -22.58,-53.058889 LGD/NCI
Bataguassu, MS, BR 1 bPco042 -21.713889,-52.421944 Dênis Sana/
Pró-Carnívoros Parque Nacional do Monte Pascoal,
Porto Seguro, BA, BR
1 bPco349 -16.45,-39.065 Sandra Becker
Centralina, MG, BR 1 bPco071 -18.583889,-49.198889 Frederico Genésio
Lemos and Hugo C. M. Costa
P. E. Cantareira, SP, BR 1 bPco034 -23.318889,-46.586944 Pró-Carnívoros
Extrema, MG, BR 1 bPco331 -22.855,-46.317778 Pró-Carnívoros
Getulina, SP, BR 1 bPco351 -21.798889,-49.928889 Alexandre Vogliotti
and Javier A. /NUPECCE
Cananéia, SP, BR 1 bPco014 -25.015,-47.926944 Fábio Olmos
Analândia, SP, BR 2 bPco317, Pco dot-d25 -22.125833,-47.662778 Renata Miotto/
3
UFSCar
Sertãozinho, SP, BR 1 Pco dot-d51 -21.198611,-48.170278 Renata Miotto/
UFSCar
Northwestern SP, BR 1 Pco599 -20.512778,-50.351944 LGD/NCI
Ribeirão Branco, SP, BR 1 bPco318 -24.220833,-48.765833 Ronaldo Morato/
Pró-Carnívoros
Itapetininga, SP, BR 1 bPco302 -23.591944,-48.052778 Ronaldo Morato/
Pró-Carnívoros
Ribeirão Preto, SP, BR 1 bPco332 -21.177778,-47.81 Jorge Bin/
Pró-Carnívoros
Itirapina, SP, BR 1 Pco dot-d29 -22.240556,-47.806667 Renata Miotto/
UFSCar
Itirapina, SP, BR 1 Pco dot-d99 -22.351944,-47.915278 Renata Miotto/
UFSCar
Matão, SP, BR 1 Pco dot-d42 -21.585833,-48.446944 Renata Miotto/
UFSCar
Catanduva, SP, BR 1 Pco dot-d43 -21.142222,-49.00833 Renata Miotto/
UFSCar
Cajuru, SP,BR 1 Pco dot-d44 -21.17,-47.294167 Renata Miotto/
UFSCar
Araraquara, SP, BR 1 Pco dot-d70 -21.736389,-48.170278 Renata Miotto/
UFSCar
Ibirarema, SP, BR 1 bPco315 -22.817778,-50.072778 Elizeu P. Ribeiro/
IBAMA
Londrina, PR, BR 1 bPco080 -23.31,-51.162778 Fernando Jerep
Blumenau, SC, BR 2 PC26cc, PC27cc -26.908889,-49.072222 Camila S. Castilho/
Projeto Leão Baio
Lages, SC, BR 6 PC08cc, PC10cc, PC15cc,
PC18cc, PC19cc, PC23cc
-27.815833,-50.325833 Camila S. Castilho/ Projeto Leão Baio
Ponta Alta, SC, BR 1 PC11cc -27.484167,-50.380278 Camila S. Castilho/
Projeto Leão Baio
São Joaquim, SC, BR 2 PC20cc, PC49cc -28.293889,-49.931667 Camila S. Castilho/
Projeto Leão Baio
Urubici, SC, BR 6 PC01cc, PC03cc, PC04cc,
PC06cc, PC07cc, PC22cc
-28.015000,-49.591667 Camila S. Castilho/ Projeto Leão Baio
4
Individual Sampling Locale Biome Haplotype AMOVA
group
bPco001 Bataguassu, MS, BR Atlantic Forest H01 CNESA
bPco002 Usina de Porto Primavera,MS, BR Atlantic Forest H02 CNESA
bPco014 Cananéia, SP, BR Atlantic Forest H03 ESA
bPco019 MS, BR Atlantic Forest / Cerrado/ Pantanal H01 CNESA
bPco020 Anaurilândia, MS, BR Atlantic Forest H02 CNESA
bPco021 Anaurilândia, MS, BR Atlantic Forest H01 CNESA
bPco022 Anaurilândia, MS, BR Atlantic Forest H14 CNESA
bPco023 Anaurilândia, MS, BR Atlantic Forest H01 CNESA
bPco024 Barão de Melgaço, MT, BR Pantanal H02 CNESA
bPco025 Pantanal - MT, BR Pantanal H02 CNESA
bPco026 Barão de Melgaço, MT, BR Pantanal H03 CNESA
bPco027 Barão de Melgaço, MT, BR Pantanal H21 CNESA
bPco028 Pantanal, MT, BR Pantanal H21 CNESA
bPco029 Barão de Melgaço, MT, BR Pantanal H02 CNESA
bPco030 Barão de Melgaço, MT, BR Pantanal H21 CNESA
bPco031 Barão de Melgaço, MT, BR Pantanal H02 CNESA
bPco032 Pantanal, MT, BR Pantanal H02 CNESA
bPco033 Pantanal, MT, BR Pantanal H06 CNESA
bPco034 PE Cantareira, SP, BR Atlantic Forest H01 CNESA
bPco035 Jardim, MS, BR Cerrado H07 CNESA
bPco036 Pantanal - MS ou MT, BR Pantanal H06 CNESA
bPco037 Corumbá, MS, BR Pantanal H05 CSSA
bPco038 Corumbá, MS, BR Pantanal H05 CSSA
bPco039 Ponta Porã, MS, BR Cerrado H09 CNESA
bPco040 Jardim, MS, BR Cerrado H10 CNESA
5
bPco044 Anaurilândia, MS, BR Atlantic Forest H01 CNESA
bPco045 Anaurilândia, MS, BR Atlantic Forest H01 CNESA
bPco046 Anaurilândia, MS, BR Atlantic Forest H02 CNESA
bPco047 Anaurilândia, MS, BR Atlantic Forest H07 CNESA
bPco048 Anaurilândia, MS, BR Atlantic Forest H10 CNESA
bPco049 Anaurilândia, MS, BR Atlantic Forest H01 CNESA
bPco050 Ivinhema, MS, BR Atlantic Forest H10 CNESA
bPco051 Ivinhema, MS, BR Atlantic Forest H10 CNESA
bPco052 Ivinhema, MS, BR Atlantic Forest H10 CNESA
bPco053 Ivinhema, MS, BR Atlantic Forest H01 CNESA
bPco054 Anaurilândia, MS, BR Atlantic Forest H09 CNESA
bPco055 Ivinhema, MS, BR Atlantic Forest H14 CNESA
bPco056 Anaurilândia, MS, BR Atlantic Forest H01 CNESA
bPco057 Anaurilândia, MS, BR Atlantic Forest H09 CNESA
bPco058 Anaurilândia, MS, BR Atlantic Forest H10 CNESA
bPco059 Anaurilândia, MS, BR Atlantic Forest H10 CNESA
bPco060 Ivinhema, MS, BR Atlantic Forest H07 CNESA
bPco062 Miranda_MS_BR Pantanal H12 CSSA
bPco063 Miranda_MS_BR Pantanal H07 CSSA
bPco064 Miranda_MS_BR Pantanal H12 CSSA
bPco066 Ivinhema, MS, BR Atlantic Forest H01 CNESA
bPco067 Anaurilândia, MS, BR Atlantic Forest H09 CNESA
bPco069 Guaramiranga, CE, BR Caatinga (Xeric Shrublands) H13 CNESA
bPco070 Quixeramobim, CE, BR Caatinga (Xeric Shrublands) H13 CNESA
bPco071 Centralina, MG, BR Atlantic Forest H03 ESA
bPco080 Londrina, PR, BR Atlantic Forest H09 CNESA
bPco082 Santarém, PA, BR Amazon Forest H22 CNESA
6
bPco316 GO, BR Cerrado H09 CNESA
bPco317 Analândia, SP, BR Cerrado H02 CNESA
bPco318 Ribeirão Branco,SP, BR Atlantic Forest H09 CNESA
bPco319 SP, BR Atlantic Forest H01 CNESA
bPco320 SP, BR Atlantic Forest H02 CNESA
bPco326 Corguinho, MS, BR Atlantic Forest H09 CSSA
bPco327 Ponta Porã, MS, BR Cerrado H06 CNESA
bPco331 Extrema, MG, BR Atlantic Forest H01 CNESA
bPco332 Ribeirão Preto,SP, BR Cerrado H15 ESA
bPco333 Luziânia, GO, BR Cerrado H02 CNESA
bPco337 Chapada Gaúcha, MG, BR Cerrado H02 CNESA
bPco338 Chapada Gaúcha_MG_BR Cerrado H02 CNESA
bPco342 Presidente Figueiredo, AM,
BR Amazon Forest H16 NSA
bPco343 Rio Preto da Eva, AM, BR Amazon Forest H16 NSA
bPco346 São Geraldo do Araguaia,
PA Amazon Forest H17 CNESA
bPco349 ParNA Montel Pascoal, BA,
BR Atlantic Forest H03 ESA
bPco351 Getulina, SP, BR Atlantic Forest H02 CNESA
bPco358 Tefé, AM, BR Amazon Forest H16 NSA
d23 Rio Claro, SP, BR Atlantic Forest H02 CNESA
d25 Analândia, SP, BR Cerrado H02 CNESA
d29 Itirapina, SP, BR Cerrado H15 CNESA
d42 Matão, SP, BR Cerrado H15 ESA
d43 Catanduva, SP, BR Atlantic Forest H15 ESA
d44 Cajuru, SP, BR Atlantic Forest / Cerrado H02 ESA
d45 Paulínia, SP, BR Atlantic Forest H03 ESA
d51 Sertãozinho, SP, BR Cerrado H03 CNESA
7
PC03cc Urubici, SC, BR Atlantic Forest H02 CNESA
PC04cc Urubici, SC, BR Atlantic Forest H02 CNESA
PC06cc Urubici, SC, BR Atlantic Forest H02 CNESA
PC07cc Urubici, SC, BR Atlantic Forest H02 CNESA
PC08cc Lages, SC, BR Atlantic Forest H02 CNESA
PC10cc Lages, SC, BR Atlantic Forest H02 CNESA
PC11cc Ponta Alta, SC, BR Atlantic Forest H02 CNESA
PC15cc Lages, SC, BR Atlantic Forest H10 CNESA
PC18cc Lages, SC, BR Atlantic Forest H10 CNESA
PC19cc Lages, SC, BR Atlantic Forest H02 CNESA
PC20cc São Joaquim, SC, BR Atlantic Forest H02 CNESA
PC22cc Urubici, SC, BR Atlantic Forest H02 CNESA
PC23cc Lages, SC, BR Atlantic Forest H10 CNESA
PC26cc Blumenau, SC, BR Atlantic Forest H10 CNESA
PC27cc Blumenau, SC, BR Atlantic Forest H16 CNESA
PC49cc São Joaquim, SC, BR Atlantic Forest H02 CNESA
Pco007 Oregon, USA H23 NCA+NA
Pco036 Texas, USA H23 NCA+NA
Pco037 Texas, USA H23 NCA+NA
Pco077 Florida, USA H24 NCA+NA
Pco128 Texas, USA H23 NCA+NA
Pco200 Torres Del Paine NP, Chile Temperate grasslands and Shrublands H18 SWSA
Pco201 Chile Mediterranean scrub, montane grasslands, Desert and xeric Shrublands H18 SWSA
Pco202 Punta Arenas, Chile Patagonian Pampas (Temperate Grasslands, Savannas and Shrublands) H18 SWSA
Pco207 Ovalle, IV region, Chile Mediterranean scrub H19 SWSA
Pco208 Vicuña, IV region, Chile Mediterranean scrub H18 SWSA
Pco209 Chile Mediterranean scrub, montane grasslands, Desert and xeric Shrublands H19 SWSA
8
Pco212
Chile/Mendoza, Argentina Montane grasslands H18 SWSA
Pco213 Angol/Coñaripe, Chile Mediterranean scrub H18 SWSA
Pco214 Antofagasta, Chile Mediterranean scrub H18 SWSA
Pco215 Ovalle, Chile Mediterranean scrub H19 SWSA
Pco216 Chile Mediterranean scrub, montane grasslands, Desert and xeric Shrublands H19 SWSA
Pco217 Chile Mediterranean scrub, montane grasslands, Desert and xeric Shrublands H19 SWSA
Pco218 Villarica, Chile Mediterranean scrub H18 SWSA
Pco242 British Columbia, Canada H23 NCA+NA
Pco258 British Columbia, Canada H23 NCA+NA
Pco340 Idaho, USA H23 NCA+NA
Pco348 Florida, USA H25 NCA+NA
Pco356 Texas, USA H23 NCA+NA
Pco357 British Columbia, Canada H23 NCA+NA
Pco372 Yellowstone NP, USA H23 NCA+NA
Pco377 Yellowstone NP, USA H23 NCA+NA
Pco446 El Petén, Guatemala H26 NCA+NA
Pco541 Darién, Panama H23 SCA
Pco542 Darién, Panama H24 SCA
Pco544 Guanacaste, CostaRica H23 NCA+NA
Pco545 Costa Rica H09 SCA
Pco546 Costa Rica H24 SCA
Pco547 Costa Rica H09 SCA
Pco548 Costa Rica H09 SCA
Pco549 Granada, Nicaragua H23 NCA+NA
Pco550 Chontales, Nicaragua H23 NCA+NA
Pco551 Nicaragua H27 NCA+NA
Pco552 Matagalpa, Nicaragua H23 NCA+NA
9
Pco556 El Petén, Guatemala H23 NCA+NA
Pco557 Sul Guatemala H28 NCA+NA
Pco562 North Argentina Montane grasslands, trop. and subtrop. moist forests, trop. and subtrop. grasslands and shrublands, trop. and
subtrop. dry forests H07 CSSA
Pco564 Foothills of Andes,
Argentina Montane grasslands H07 SWSA
Pco565 La Pampa, Argentina Patagonian Pampas (Temperate Grasslands, Savannas and Shrublands) H18 SWSA
Pco567 Chubut, Argentina Patagonian Pampas (Temperate Grasslands, Savannas and Shrublands) H07 SWSA
Pco570 Mendoza, Argentina Montane grasslands H18 SWSA
Pco573 Mendoza, Argentina Montane grasslands H18 SWSA
Pco577 Córdoba, Argentina Patagonian Pampas (Temperate Grasslands, Savannas and Shrublands) H07 CSSA
Pco580 Mercedes Zoo, Uruguay Pampa (tropical and subtropical grasslands and shrublands) H09 CSSA
Pco581 Paraguay Tropical and subtrop. grasslands and shrublands, trop. and subtrop. dry forest, chaco H07 CNESA
Pco582 Zoo Durazno, Uruguay Pampa (tropical and subtropical grasslands and shrublands) H09 CSSA
Pco599 Northwest SP, BR Atlantic Forest/ Cerrado H03 ESA
Pco601 Araguaína, TO, BR Cerrado H10 CNESA
Pco602 Goiás, BR Cerrado H02 CNESA
Pco697 Araguaia, GO, BR Cerrado H02 CNESA
Pco699 Chaco Paraguay Pantanal (Chaco) H02 CNESA
Pco700 Campina Grande, PB, BR Caatinga (Xeric Shrublands) H02 CNESA
Pco701 Paraguay Tropical and subtrop. grasslands and shrublands, trop. and subtrop. dry forest, chaco H01 CNESA
Pco702 Usina de Porto Primavera,
MS, BR Atlantic Forest H15 CNESA
Pco703 Venezuela Tropical and subtrop. moist forests, trop. and subtrop. grasslands and shrublands, trop. and subtrop. dry forest H20 NSA
Pco704 Falcón, Venezuela Coriano System H16 NSA
Pco705 Barquisimeto, Venezuela Coriano System H16 NSA
Pco706 Potosí, Bolivia Montane grasslands H09 CSSA
Pco707 Santa Cruz, Bolivia Beni Savanna, Tropical and subtrop. dry broadleaf forest/Amazon Rainforest (trop. moist forests) H06 CSSA