MIGRATION OF
HEALTH PERSONNEL, SCIENTISTS, AND
ENGINEERS FROM LATIN AMERICA
u:
1
PAN AMERICAN HEALTH ORGANIZATION Pan American Sanitary Bureau, Regional Office of the
WORLD HEALTH ORGANIZATION
MIGRATION OF
HEALTH PERSONNEL, SCIENTISTS, AND
ENGINEERS FROM LATIN AMERICA
Report prepared by the
PAHO Subcommittee on Migration
for the
PAHO Advisory Committee on Medical Research
Scientific Publication No. 142
PAN AMERICAN HEALTH ORGANIZATION Pan American Sanitary Bureau, Regional Office of the
WORLD HEALTH ORGANIZATION 525 Twenty-third Street, N.W. Washington, D.C. 20037, U.S.A.
September 1966
* *1 ib
PAHO ADVISORY COMMITTEE ON MEDICAL RESEARCH
Dr. Hernán Alessandri
Ex-Decano, Facultad de Medicina Universidad de Chile
Santiago, Chile
Dr. Otto Bier
Departamento de Microbiologia e Imunologia
Escola Paulista de Medicina Sáo Paulo, Brazil
Dr. Roberto Caldeyro-Barcia Jefe, Servicio de Fisiología Obstétrica Facultad de Medicina
Montevideo, Uruguay
Dr. Carlos Chagas
Chief, Brazilian Delegation to UNESCO Paris, France
Dr. Ignacio Chávez
Ex-Rector, Universidad Nacional Autónoma de México Mexico, D.F., Mexico
Dr. René Dubos Professor and Member The Rockefeller University New York, New York, U.S.A.
Dr. Bernardo A. Houssay Director, Instituto de Biología y
Medicina Experimental Buenos Aires, Argentina
Dr. Alberto Hurtado Decano, Facultad de Medicina Universidad Peruana Cayetano Heredia Lima, Peru
Dr. Walsh McDermott
Chairman, Department of Public Health Cornell University Medical College New York, New York, U.S.A.
Dr. James V. Neel
Department of Human Genetics University of Michigan School of
Medicine
Ann Arbor, Michigan, U.S.A.
Dr. Anthony M.-M. Payne
Chairman, Department of Epidemiology and Public Health
Yale University Medical School New Haven, Connecticut, U.S.A.
Dr. Marcel Roche
Director, Instituto Venezolano de Investigaciones Científicas Caracas, Venezuela
Dr. James A. Shannon
Director, National Institutes of Health Bethesda, Maryland, U.S.A.
Dr. J. C. Waterlow
Tropical Metabolism Research Unit University of the West Indies z Kingston, Jamaica
Professor Abel Wolman
Emeritus Professor of Sanitary Engineer-ing and Water Resources
The Johns Hopkins University Baltimore, Maryland, U.S.A.
SECRETARIAT Office of Research Coordination Dr. M. Martins da Silva
Chief Mr. Louis MunanResearch Scientist
4t
PAHO SUBCOMMITTEE ON MIGRATION
Dr. Hernán Alessandri Dr. Roberto Caldeyro-Barcia
Dr. Carlos Chagas Dr. Ignacio Chávez
Dr. Bernardo A. Houssay Dr. Alberto Hurtado
Dr. Charles V. Kidd, Chairman
Dr. Marcel Roche
Consultants
Dr. Kelly M. West University of Oklahoma
Oklahoma City, Oklahoma, U.S.A.
Dr. Hernando Groot Universidad de los Andes
Bogotá Colombia
CONTENTS
Page
FOREWORD ... ix
1. Introduction ... 1
2. Who Migrates? ... 6
3. Migration by Profession ... 16
4. The Special Case of Physicians ... 25
5. What Causes Migration? ... 36
6. What Should Be Done? ... 46
BIBLIOGRAPHY ... 55
Appendices I. Migration of Trained People from Latin America-State-ment of Goals and Procedures for a Study ... 59
II. Immigrants Admitted to the United States in the Profes-sional, Technical, and Kindred Worker Group, by Country or Region and by Occupation ... 64
III. Latin American Scientists in the United States, by Highest Degree, Citizenship, and Field, 1964 ... 96
IV. Latin American Medical Graduates in the United States, by School and Country of Origin ... 97
V. Latin American Medical Graduates Licensed by Examina-tion to Practice in the United States, 1960-1964 ... 100
VI. Status in the United States of Graduates of the University of Buenos Aires, the National University of Mexico, and Colombian Medical Schools ... 103
VII. Special Note on the Migration of Cuban Physicians ... 107
VIII. Questionnaire for Latin American Medical Graduates in the United States ... 109
IX. Establishment of a Special Committee to Study the Migra-tion of Argentine Scientists, Professionals, Technicians, and Skilled Workers-Decree 7,558 of 1965 ... 112
¿L
Tables and Figures
Page
Table 1 Persons Engaged in Six Principal Professions, in Five Latin American
Coun-tries, 1961-1965 ... 3
Table 2 University Graduates in Given Years, Selected Professions, in Eighteen Latin
American Countries ... 3
Figure 1 Professional, Technical, and Kindred Workers Admitted as Immigrants to the United States, from Selected Areas in the Americas, 1956-1965 ... 6
Table 3 Movement of Professional and Technical Workers In and Out of Argentina,
1960-1964 ... 10
Table 4 Physicians Admitted to the United States, by Country of Birth and by
Country of Last Permanent Residence, Selected Countries and Regions, 1964. 10
Figure 2 Professional, Technical, and Kindred Workers Admitted as Immigrants to the United States, from Selected Countries of the Americas, 1959-1965 .... 13
Table 5 Persons Admitted to the United States with Immigrant Visas, from South
America, Argentina, and Colombia, Selected Professions, 1965 ... 14
Figure 3 Potential Loss of Professional and Technical Workers, by Country, Latin
America, 1965 ... ... 14
Figure 4 Persons Admitted to the United States with Immigrant Visas from Latin
America, Selected Countries and Occupations, 1965 ... 16
Table 6 Nurses and Medical Technicians from Latin America Admitted to the United
States with Immigrant Visas, 1965 ... 19
Table 7 Engineers from Latin America Admitted to the United States with Immigrant
Visas, 1965 ... 20
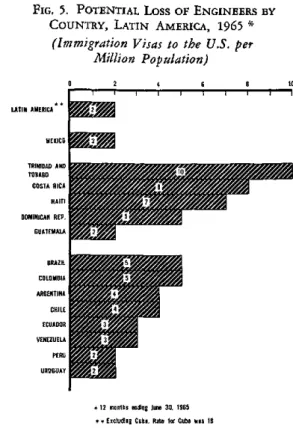
Figure 5 Potential Loss of Engineers by Country, Latin America, 1965 ... 21
Table 8 Latin American Students in the United States, by Field of Major Interest,
1964 ... 22
Table 9 Percentages of Graduate Students in Selected Fields of Specialization, in
Seven Latin American Countries, 1963-1964 ... 22
Table 10 Latin American Citizens Recruited Internationally for International Agencies,
1964 ... 23
Table 11 Latin American Citizens Recruited Internationally for International Agencies,
Representation by Groups of Countries, 1964 ... 24
Figure 6 U.S. Immigrant Visas to Graduates of Latin American Medical Schools,
1957-1965 ... 25
Page
Table 12 Graduates of Foreign Medical Schools Residing in the United States, 1966.. 26
Table 13 Physicians Admitted to the United States with Immigrant Visas, 1965 .... 27
Table 14 Latin American Medical Schools Having the Largest Number of Graduates
in the United States, 1966 ... 28
Figure 8 Potential Physician Immigrants to the United States per Million Population,
1965 ... ... ... 28
Figure 9 Potential Physician Immigrants to the United States as a Percentage of
Annual Output of Physicians, 1965 ... 28
Table 15 Biomedical Research Trainees from Latin America Supported by NIH
Training Grants to U.S. Institutions ... 30
Table 16 NIH International Postdoctoral Fellowships to Latin Americans, 1958-1965.. 30
Table 17 Former NIH Research Trainees from Latin America, Follow-up and
Citizen-ship Status in 1962 ... 31
Table 18 Comparative Income Distribution of Chilean Migrants to the United States,
Before and After Migration, as of 1963 ... 38
Table 19 Migration of Professional, Technical, and Kindred Workers from Argentina,
FOREWORD
This study was suggested by the Pan American Health Organization in its report
Science Policy in Latin America (PAHO Scientific Publication 119, March 1966).
The report made the following recommendation: "The Pan American Health Organiza-tion should institute a study of the migraOrganiza-tion of scientists, in cooperaOrganiza-tion with all groups that have an interest in the question, for the purpose of obtaining a more specific diagnosis and a practical prescription." A Subcommittee on Migration was formed, and Dr. Charles V. Kidd of the Office of Science and Technology, Executive Offices of the President of the United States, was asked to prepare a draft statement of goals and procedures for a study (see Appendix I). This was done with the collabora-tion of Dr. Kelly West, Professor of Continuing Educacollabora-tion, University of Oklahoma School of Medicine. A preliminary draft was reviewed by the Subcommittee at a meet-ing in Rio de Janeiro in May 1966, and a revised draft was subsequently reviewed and discussed by the PAHO Advisory Committee on Medical Research at its Fifth Meeting in June 1966. The final report was then prepared by Dr. Kidd.
The Department of Scientific Affairs of the General Secretariat of the Organization of American States, which is engaged in establishing a more effective base for manpower statistics in Latin America, was extremely helpful in providing data. Hopefully, the present exploratory study on migration will provide guides to the kind of data that should be collected and analyzed on a long-term basis.
The American Medical Association and the Immigration and Naturalization Service of the U.S. Department of Justice kindly made available previously unpublished data. The National Science Foundation also made available special data derived from the National Register of Scientific and Technical Personnel.
1. INTRODUCTION
1.1 The Basic Significance of Migration
Modern economics is attaching new signifi-cance to two factors hitherto not strongly emphasized: the effect of the quality of the work force on economic well-being, and the impact of science and technology on economic development. With regard to the first, earlier economic analysis had dealt with the work force as if it were composed of equally effec-tive units of unchanging capacity. Later studies have clearly demonstrated, however, that the education, health, alertness, and motivation of workers constitute a major factor in economic development. Thus, theory, after many years, has almost overtaken common sense. As to the role of science and technology, reassessment in recent years has shown that innovation in products and in production techniques turns the process of change itself into an important factor of economic growth. This is a basic shift from the earlier views of economic theorists, which essentially stressed improve-ment in the efficiency of existing processes for the output of existing goods.
When these two factors, the significance of work-force quality and the effects of science and technology, are considered together, the critical importance of scientists, engineers, and physicians to national development becomes evident. While, on one hand, a balanced, high-quality total work force is important and necessary, on the other hand, scientists, engi-neers, and physicians comprise a group of
singular significance to developing nations. In addition to having an economic value, these highly trained people constitute the small slice of the population that provides intellectual, political, and cultural leadership.
Any measures that increase the supply of such people are important. Similarly, any factors that contribute to a decrease are
sig-nificant. Migration is one such factor.
In a number of countries of Latin America, many scientists have become so discouraged by the obstacles to a career in science and teaching
that they have migrated. They are, in effect,
pushed out of their native country. At the
same time, they are pulled toward countries
where career prospects are much brighter in both economic and intellectual terms. The country that has held the most attraction in recent years is the United States. While exact and full details concerning the migration of physicians, scientists, and engineers are not known, it is abundantly clear that the loss of such talent is in some countries a severe handi-cap to national economic, cultural, and intel-lectual development. It is also dear that the situation differs widely from one country to another.
The central question is not whether the forces that repel or those that attract are most powerful; it is, rather, how both these forces can be moderated in a suitable way. There can be no realistic hope that the forces leading to migration of scientists from Latin America will be eliminated and that migration will cease. The forces at work are too deeply ingrained and too powerful. Indeed, the cessation of migration is not only impossible but unwise. International migration of scientists is a pro-ductive phenomenon with which the world has long been familiar. The object of policy should be to establish conditions under which the rate of migration from Latin America may be moderated by voluntary individual decision. Fortunately, practical, inexpensive measures for reducing migration do, in fact, exist.
The present study first summarizes all the facts that could be obtained on the subject. With the cooperation of the nations concerned, the numbers and characteristics of migrants have been reasonably well identified. It then analyzes the forces leading to migration. Finally, it suggests measures to reconcile the legitimate aspirations of highly trained people with the legitimate needs of the countries for highly trained manpower.
1.3 The Countries of Latin America
For the purpose of this study, the term "Latin America" shall include the following countries:
Mexico
Costa Rica El Salvador Guatemala
Argentina Bolivia Brazil Guyana*
Chile Colombia
Honduras Nicaragua Panama
Ecuador Paraguay Peru Surinam Uruguay Venezuela
* Formerly British Guiana.
Although this classification excludes the Caribbean countries, certain data on them will be presented.
1.4 Migration to the United States
1.2 Migration Defined
The focus of the report is on permanent rather than temporary change of an individual's country of residence. All kinds of temporary changes of residence are excluded. For example, the sojourns of thousands of Latin American students who come to the United States to study and then return home are not counted as migration. Study in the United States, however, is regarded as a factor affecting migration, since the opportunity to learn about the United States and to become familiar with the English language unquestionably plays a part in the ultimate decision to migrate. Visits to the United States for business or pleasure are also excluded from the study.
The original intent of this study was to examine the migration patterns of scientists, engineers, and physicians and other health per-sonnel from all Latin American countries to all other countries. However, it soon became evident that, practically speaking, the only country to which people from Latin America migrate in significant numbers-numbers suffi-cient to arouse concern on the part of the countries being left-is the United States. Migration of highly trained Latin Americans to Europe and to other parts of the world has not reached high enough levels to cause general concern, although migration to Europe shows signs of increasing. For these reasons, it was decided to confine the study to migration to the United States.
1.5 Availability of Migration Statistics
Enough is known almost entirely from sources within the United States about the numbers and characteristics of migrants from Latin America to the United States to provide
a basis for national policies and action. The
formulation of policies in this field does not depend on precise statistics; knowledge of the
general magnitude, nature, and causes of a
problem is an adequate guide for action. Indeed, there is no reason why an appropriate action program should be affected even by quite substantial changes in magnitudes.
Unfortunately, detailed facts that would
further illuminate problems, guide programs, and stimulate action by professional and other groups are not available.
Data on the various professions-the number of people working and the number graduating annually in each one (Tables 1 and 2)-are inadequate in most Latin American countries. Such information is necessary to assess the significance of migration figures. This type of
data can be produced only by a general
TABLE 2. UNIVERSITY GRADUATES IN
strengthening of national manpower statistics. Such a program is now being advocated, aided,
and implemented by the Organization of American States.
The volume of migration into the Latin American countries is almost entirely unknown. The wide dissemination of the few facts available has had unfortunate consequences. The most serious effect has been an exaggerated idea of the number of migrants. Another
TABLE 1. PERSONS ENGAGED IN SIX PRINCIPAL PROFESSIONS, IN FIVE LATIN AMERICAN
COUNTRIES, 1961-1965
Professional Argen- Colom- Ecua-group Brazil Chile tina bia dor
Physicians 5,200 35,400 7,500 2,500
Engineers 25,000 21,700 7,300 2,000
Lawyers 21,900
Dentists 3,300 14,100 2,500
Pharmacists 12,100
Architects 4,700
Source: UNESCO, Los Estudios de Recursos Humanos en el Contexto de la Planificación y en Metodología en América Latina (paper prepared for the Conference on the Application
of Science and Technology to the Development of Latin America, Santiago, Chile, September 1965), Cuadro 35.
GIVEN YEARS, SELECTED PROFESSIONS, IN EIGHTEEN LATIN AMERICAN COUNTRIES
Natural
Country Year Humanities Engineering sciences Law Medicine
24nA
Costa Rica Cuba
Dominican Republic El Salvador Guatemala Haiti Honduras Jamaica Mexico Argentina Brazil Chile Colombia Ecuador Paraguay Peru Uruguay Venezuela 1960 1962 1961 1959 1961 1961 1960 1960 1960 1962 1961 1961 1961 1961 1959 1959 1958 1961 6 66 52 4 56 12 1,566 3,302 35 196 2 21 7 2 144 21 70 65 20 25 15 7 818 1,167 1,489 284 575 36 6 204 124 312 5 23 15 13 33 239 497 784 86 73 1 68 297 31 24 83 153 14 23 65 8 558 1,432 3,509 73 263 89 41 389 124 385 20 458 231 33 48 51 24 33 1,341 4,363 3,989 606 660 288 77 810 170 831
Source: Prepublication extract from the UNESCO Statistical Yearbook for 1964.
consequence is that discussions of migration have been placed in a rather theoretical light. The absence of sound data has led people to search for any facts at all that might illumi-nate the situation. In Mexico, for example, experts studying the supply and demand for physicians have had to rely on statistical reports of physicians tested for practice in the United States. On this basis, they arrived at the follow-ing estimate:
Some 150 young physicians from Mexico are tested annually for settling and practicing in the United States. Of these, 100 are graduates from the Medical School of the National University and the remaining 50 are graduates from State medical schools. From 66 to 75 per cent pass the test successfully the first time; those who fail have the opportunity of passing the test at a later date. Thus, Mexico loses 100 physicians per year.1
Actually, the maximum annual number of physicians migrating from Mexico to the United States between 1961 and 1965 has been about 80. In the absence of precise data, the Mexican estimate was remarkably accurate and provided an order of magnitude not at all misleading in terms of policy implications. Thus, any country could take the number of its physicians who pass the test of the Educa-tional Council on Foreign Medical Graduates as a usable measure of migration.
Argentina, however, made a rather serious error some years back. On the basis of no facts whatever, a statement was made that Argentina had lost 5,000 engineers to the United States. No source was specified and no time period was given. The true figures indi-cated that a maximum of 700 engineers had migrated to the United States over the period 1951-1961.2 But the real situation was serious enough in itself, since the number of migrants
D. G. Alarcón, Evaluación de la Necesidad de Médicos de la Reública Mexicana y Planeación de la Enseñanza Médica, México, D.F., Facultad de
Medi-cina, Universidad Autónoma de México, 1965.
2 M. A. Horowitz, La Emigración de Profesionales
y Técnicos Argentinos, Buenos Aires, Instituto
Tor-cuato di Tella, 1962, p. 1.
equaled 8 per cent of the number of new
engineers graduating over the period 1951-1961.
Far more serious than the inadequacy of statistics, however, is the lack of interest, con-cern, and action that prevails with regard to the migration problem.
1.6 Interpretation of Migration
Statistics
Figures on migration are quite abundant in the United States, particularly from the Immi-gration and Naturalization Service of the U.S. Department of Justice. These statistics indicate by country and by occupation, for every year, the number of persons admitted as immigrants to the United States (Appendix II). So far as is known, no comparable information is avail-able in any other country in the Western Hemisphere. Data with respect to physicians who have come to the United States from other countries are also available in great detail. Finally, the Institute of International Educa-tion in New York collects and publishes annual information on foreign students in the United States in its report Open Doors.
individuals enter the United States they them-selves do not know whether they will eventually migrate, and people often change their minds. Sometimes figures relating to the total move-ment to the United States are cited as if they were numbers of immigrants, thus leading to exaggerated ideas with respect to the magnitude of the problem.
This report is oriented towards policy deci-sions-towards what can and should be done to moderate migration where it seems excessive. In such a context, extreme refinement of sta-tistical data is not required. The statistics are a guide to the nature and magnitude of the problem to be solved, and not an end in them-selves. Fortunately, good judgments as to the seriousness of the migration problem can be made on the basis of rough data, since any action that might be taken is the same over
a fairly wide range. To take an example, 82 physicians from Colombia were admitted to the United States as immigrants in 1965. With respect to any action Colombia might find desirable and possible to take, it would not make much difference if this figure were 62 or 102. And it would not make much difference whether 10 or 30 per cent of those admitted as immigrants later decided to return to Colombia. The problem for Colombia is essentially the same over the possible range of figures. This example, taken at random, applies to all Latin American countries.
2. WHO MIGRATES?
2.1 The Broad Tides of Movement
Over the past five years, approximately 4,000 university-educated persons have entered the United States from Latin America with immi-grant visas. About three quarters of these, or
some 3,000, are probably permanent migrants. If the cost of training one person is con-servatively estimated at $20,000, the loss to the Latin American countries caused by the migration of 3,000 university-trained people
to the United States, measured solely in terms of education cost, has been in the neighborhood of $60,000,000 over the past five years.
The number of professional, technical, and kindred workers migrating to the United States from Latin America, and particularly from South America, is becoming greater each year
(Figure 1). The total in 1961 was about 3,100, and in 1965 it was about 5,400. The number of migrants from South America increased from 1,900 in 1961 to 3,600 in 1965, and the Central
FIG. 1. PROFESSIONAL, TECHNICAL, AND KINDRED WORKERS ADMITTED AS IMMIGRANTS
TO THE UNITED STATES, FROM SELECTED AREAS IN THE AMERICAS, 1956-1965
3,000 _/
CUBA
SOUTH AMERICA
CENTRAL
AMERICA-¡ ¡ ¡L~1
1956 57 58 59 60
Y E A
61 62 63 64 1965
R S 2,000ooot
0:
LU
en
1,000
l -
-r
American annual total went from 550 to 900 during the same period. Those from Mexico increased from 600 to 900.
Over the 1961-1965 period, a total of 19,100 professional, technical, and kindred workers entered the United States from Latin America with immigrant visas. Of these, 2,900
were from Mexico, 3,500 from Central America, and 12,700 from South America.
Unless specifically mentioned, emigration from Cuba is not included in this summary because of the unique circumstances in that country. Migrants from the West Indies are also excluded.
The number of actual migrants (persons who remain permanently in the United States) is less than these figures indicate, since a large but unknown number of entrants secure immi-grant visas even though they return to their own countries after a short period in the United States. For purposes of considering policy and action, however, the number entering with im-migrant visas will be considered as the number of migrants, with the understanding that this
figure is somewhat high.
In no Latin American country is the loss of highly trained people to the United States as significant as the losses experienced by the Philippines, India, Turkey, Korea, and Iran. Even for certain Western European countries the movement to the United States is more sig-nificant, in terms of the proportion of highly trained people who migrate as well as in terms of numbers, than it is for the Latin American countries. For example, the number of scien-tists and engineers who migrated from the Netherlands, Norway, and Switzerland in 1959 amounted to between 15 and 17 per cent of the year's total graduates in these particular professions. Thus, the situations of other coun-tries can provide a useful point of reference from which to assess the significance of migra-tion from Latin America.
The relatively high rates of migration from Western Europe as contrasted with Latin Amer-ica testify to the complexity of the forces
affect-ing migration and to the fact that much more than economic factors are involved. The real in-come of the average professional person is much greater in Western Europe than in Latin Amer-ica. Therefore, if only economic factors oper-ated, one would expect migration to the United States to be much more prevalent from Latin America than from Western Europe. Yet the migration rate from Western Europe is as great or greater than that from Latin America.
The total emigration to the U.S.A. from West-ern Europe (France, Germany, the Netherlands, and the United Kingdom) amounted to 6,500 scientists and engineers from 1956 to 1961, prob-ably equivalent to about 6 per cent of Western European new graduates in science and engineer-ing in those years. This was equivalent to about 3 per cent of new graduates in science and 9 per cent of new graduates in engineering.3
Viewed from this perspective, the wonder is not why so many Latin American engineers, scientists, and physicians migrate to the United States, but rather why so few migrate. Two important and related considerations are raised by this question.
First, it is evident that the existence of rela-tively low income opportunities for individuals in a given country does not necessarily lead to migration. Countries with relatively low per capita income need not be fatalistic about the migration question; they do not have to ap-proach the level of the United States in order to keep migration within reasonable bounds. Second, the fact that out-migration to the United States from Latin America has not been as heavy as migration from Western Europe, even though average income levels are lower in Latin America, suggests that significant non-economic factors inhibit migration from Latin America.
3 C. Freeman and A. Young, The Research and Development Effort in Western Europe, North America, and the Soviet Union, Paris, Organisation
The primary difficulties generated for Latin American countries by migration come less from the loss of absolute numbers than from the loss of a critical few highly qualified pro-fessional people. These people-engineers,
scientists, physicians, and the like-contribute to national development not only by practicing their professions but also by serving, in the capacity of teachers and intellectual leaders, as agents of change. The narrower the human-resource base of any nation, the more significant is the loss of small numbers of highly trained people. The importance of migration to Latin American countries must therefore be measured in terms of the proportion of the highly skilled labor force that migrates as well as in terms of the number who migrate.
The loss of teacher-investigators is particu-larly serious, since these are the people responsi-ble for expanding the future supply of pro-fessionals. The shortage of teacher-investigators
is illustrated by the situation in engineering and medicine. In all of Latin America, about 15,000 engineers devote some time to university teaching. Of these, however, only 2,000 are full time, even in the sense of spending a formal full work week at the university. A still smaller number devote themselves com-pletely to academic work. Only 600 to 700 engineers in all of Latin America are engaged exclusively in academic teaching and research.4 In medicine the proportion of professionally trained persons who devote themselves com-pletely to university teaching and research is a little larger, but not much. The proportion
in science, however, is definitely higher, and of the same number of engineers and scientists who migrate a much larger number of teacher-investigators will be found among the scientists. The better the scientist and the better the laboratory in which he works, the more likely
4 UNESCO, Personal Docente, Niveles, Grado de Especialización, y Condiciones de Ingreso en Estudios de Ingenieria (document prepared for the Conference on the Applicatíon of Science and Technology to the Development of Latin America, Santiago, Chile, September 1965), p. 3.
he is to be offered an opportunity to work in a laboratory in the United States. Even the outstanding laboratories in Latin America have difficulty at times in providing the resources investigators consider essential for the optimum progress of their research. Graphic examples of this condition can be cited from laboratories with which members of the PAHO Advisory Committee on Medical Research are associated.
The loss of highly talented leaders through migration cannot be measured by statistics, for a person with the extraordinary gifts of lead-ership is uniquely valuable and may be worth 10 or 100 persons who have a high degree of professional training but do not have these rare personal attributes. Every country has a small nucleus of persons with the combination of leadership qualities needed for establishing institutions and ensuring their growth, produc-tivity, vitality, and stability. These institutions may be ministries, professional parts of min-istries, independent institutes, universities, or parts of universities. Informed people in virtu-ally every Latin American country can name persons of outstanding talent who have mi-grated to the United States. The numbers vary from country to country and they are small, but they constitute a serious blow to development. On the whole, these losses seem to be more serious in medicine and science than in engineering.
The number of scientists who had their secondary schooling in Latin America and are now working in the United States may serve as a rough guide to the volume of migration of highly trained people. In 1964, 272 scientists with a Ph.D. degree and another 62 with a professional medical degree who had their secondary schooling in Latin America were working in the United States (Appendix III). Three quarters of them came from Argentina, Brazil, Colombia, Mexico, and the West Indies. The problem cannot be assessed statistically, and there is no point in attempting to do so. The critical fact is that the dimension of qual-ity must be borne explicitly in mind when statistics are examined.
2.2 The Complex Flow of People
While the flow of highly trained people to the United States from Latin America has been the clearly dominant pattern of migration, other paths of movement are significant as well. These include such patterns as migration from outside the hemisphere to Latin America before entering the United States and migra-tion within Latin America.
2.2.1 Migration from Europe after World War II
The student of migratory movements within the Western Hemisphere should keep in mind that all the people but the Eskimos and the Indians are either migrants or descendants of migrants. And the flow of people to the hemisphere has not ceased. About 4.4 million people migrated from Europe and Russia dur-ing the decade immediately followdur-ing World War II.5 Of these, 1.2 million came to the United States and 1.1 million to Latin America. Of the group that migrated to Latin America, 600,000 came to Argentina, 200,000 to Vene-zuela, and 300,000 to the other countries. Although scientists, engineers, and physicians may constitute a much smaller proportion among these immigrants to Latin America than they do among the migrants leaving the area, even so, the total flow of people to Latin America has been so much greater than the out-migration that the region as a whole has had an important net in-migration of scientists, engi-neers, and physicians since World War II. The pattern has consisted of a heavy inflow from Europe and a much smaller outflow almost entirely to the United States.
While the post-World War II mass migra-tion from Europe to Latin America has sharply diminished, migration on a smaller scale to particular areas and in particular occupations
5 D. Kirk, Major Migrations Since World War II,
in Milbank Memorial Fund, Selected Studies of Mi-gration Since World War II, New York, 1958.
continues. For example, an important source of in-migration to Latin America is the move-ment of professors from Europe under the auspices of the Intergovernmental Committee for European Migration. Between January 1964 and April 1966 the Committee sponsored the relocation of 60 European professors in the following Latin American countries:
Total
Colombia ... Brazil ... Ecuador ...
Costa Rica ...
Nicaragua ... Chile ... Guatemala ... Venezuela ...
60
33
11 7 2 1 4 1 1
By field, they were distributed as follows: Total
Physical sciences ... Social sciences ... Agricultural and biological sciences ... Engineering ...
60 24
23 7
6
These people, very few of whom have sub-sequently migrated to the United States, are making an important contribution to the devel-opment of Latin America.
While data are incomplete, it appears that over recent years most migrants to Latin Amer-ica in the professional categories have come to Argentina, Mexico, Venezuela, and Colombia. Argentina has the most extensive data.
Argentina is a "country of immigrants." If the country had received no migrants over the last 100 years the current population would be only 45 per cent of what it is today.6 As late as 1914, 30 per cent of the population of Argentina was foreign born. In 1964 the net migration to Argentina had reached a cumula-tive level of 5.7 million in a country of 30 million.
6 Z. de Lattes, Consecuencias Demográficas de los
Movimientos Migratorios Nacionales en la República Argentina, 1870-1960 (paper prepared for the United
During the years since World War II, Argen-tina has continued to be a country of net in-migration. Over the period 1960-1964, 3,858 persons in the professional and technical category migrated to Argentina from all other countries while 3,531 such persons migrated from Argentina to the United States (Table 3).
TABLE 3. MOVEMENT OF PROFESSIONAL AND TECHNICAL WORKERS IN AND OUT OF
ARGENTINA, 1960-1964
Immigration
from all Emigration Net Year countries* to the U.S. immigration
Total 3,858 3,531 327
1960 759 508 251
1961 815 552 263
1962 793 531 262
1963 639 781 -142
1964 852 1,159 -307
Source: Argentina, Ministerio del Interior, Dirección de Migraciones, La Emigración de Técnicos Argentinos, por H.P.O. Ciapuscio, Buenos Aires, 1965 (typewritten study).
* The immigration figures include only persons who have become Argentine citizens; they do not include persons who remain in Argentina for various periods but who do not become citizens.
In all probability, the country gained about as many professional and technical workers as it lost over the period in question. This assess-ment, however, does not take into account the qualifications of the individuals in the two groups, and it is quite possible that more out-standing individuals left the country than en-tered. Still, the basic fact that Argentina has experienced only a small net loss of profes-sional and technical persons over recent years is not generally appreciated.
Very little occupational data are available on in-migrants. A special study of engineers migrating to and from Argentina 7 shows that
although 77 left to come to the United States,
7H.P.O. Ciapuscio, "Emigración e Inmigración de Técnicos," Revista de la Dirección Nacional de Migraciones, Buenos Aires, 1965.
Ciapuscio points out that 1961 was not a particu-larly favorable year for Argentina, but it was the year for which detailed occupational statistics were obtained.
97 entered Argentina with the intention of re-maining permanently and another 246 entered on a temporary basis. This "cross migration" is primarily the result of specific professional requirements generated by a developing econ-omy and the inability of the local universities to provide the needed training.
The amount of permanent in-migration of all classes of professionals to Latin America is not known. Whether more detailed study would bring to light situations like that of Argentina is problematical. The data on in-migration to Venezuela cited in the following section are of
interest in this connection.
2.2.2 Migration before entering the United States
While most migrants to the United States enter directly from their country of birth, some enter from another country to which they have migrated first. For example, 440 physicians
entered the United States from Canada in 1964, but only 205 physicians born in Canada entered the United States in that year (Table 4). It is clear that Canada is a "way station" for migra-tion to the United States. Spain is another important way station. From Cuba, in
particu-TABLE 4. PHYSICIANS ADMITTED TO THE UNITED
STATES, BY COUNTRY OF BIRTH AND BY COUNTRY
OF LAST PERMANENT RESIDENCE, SELECTED
COUNTRIES AND REGIONS, 1964
Number admitted
Country or region Country of Country of
birth last residence
Total 2,249 2,249
Europe 516 623
Greece 30 44
Spain 39 108
Turkey 53 29
United Kingdom 157 165
Asia 235 204
Canada 205 440
Mexico 61 77
Cuba 401 229
South America 435 454
All others 239 57
Source: Direct information, U.S. Department of Justice, Iminigration and Naturalization Service.
f-lar, many migrants are entering the United States after residing in other countries.
Most physicians migrating to the United States from Mexico and South America were born there. The part of the migration ac-counted for by physicians not born in South America who move to the United States after residing in Latin America in quite small. In general, South America and Mexico are not important way stations. On the contrary, most persons who migrate to Mexico and South America from Europe and elsewhere stay in those countries and do not migrate again to the United States.
2.2.3 Migration within Latin America
There is no question that there are substan-tial movements of highly trained people within Latin America, but the absence of statistics leaves only impressions, experience, and in-formed judgments to go by. Fortunately, however, these impressionistic views are quite adequate to describe the major movements.
The most significant movements of skilled people in Latin America take place within the countries rather than from one country to another. Every nation has problems arising from
the movement of people to major cities, usually the capital.
The most carefully studied aspect of this situation is the distribution of physicians be-tween rural and urban areas in Latin America. Physicians gravitate to the big cities to such a degree that the provision of medical services to rural areas has become an exceedingly difficult problem. On the average, there are five times as many physicians in capitals and large cities as in the remaining areas of the countries, or 15 per 10,000, as against 3 per 10,000.8 In the individual countries the urban ratio is any-where from three to twenty times as great as
the rural ratio.
8 Pan American Sanitary Bureau, Health Conditions
in the Americas, 1961-1962 (prepared for the XV Meeting of the Directing Council), Washington, D.C., 1964, p. 62. (Scientific Publication No. 104)
Scientists tend to cluster around universities, and the largest and most prestigious universi-ties are found in the largest ciuniversi-ties. Moreover,
opportunities for supplemental income are gen-erally best in large cities. As the seat of na-tional governments, capital cities are the locus of political power and generally the center of the cultural life as well. They tend to hold a particular attraction for scientists, engineers, physicians, and other highly trained people.
The country-to-city, poor-area-to-rich-area in-ternal migration that is typical of Latin Amer-ican countries can be illustrated by the case of Mexico:
The available data on the extent and direction of internal migration during the periods of reform and rapid industrialization indicate that a growing number of Mexicans have been migrat-ing from the villages to the cities, from smaller to larger cities and from dry to irrigated land. They have foresaken less developed areas with few opportunities for the most developed areas with greater prospects for further development. Of equal importance is the nature of the mi-grants arriving in the more advanced areas.
It is likely that many graduates with middle and higher education from the less advanced states are now living outside them. Upon com-pletion of each phase of their education, ambi-tious students are often forced to migrate in order to pursue further study and later to find employment opportunities commensurate with their level of education, as well as living stand-ards potentially equal to their expectations. Primary graduates in rural areas must migrate to larger towns to attend secondary school and sometimes to cities to attend preparatory school. University education of high quality and diversity often necessitates travel to the Federal District, and once having left the poorer states, many stu-dents do not return.9
Just as international migration is caused by basic differences between one country and the next that are difficult to change, so, too, the special situation of large cities is brought
9 C. N. Myers, Education and National
Develop-ment in Mexico, in Harbison and Myers (eds.),
about by powerful historical forc sequences are not easily altered. must be dealt with in the conte:
tional development-social, cult nomic.
Migration of professional peo country to another within Lati substantial. The most significant r
Venezuela, whose prosperity and rate are key factors. Personal in average, are the highest in L Incomes for scientists, engineers, are sufficiently generous to attrat lent people from Western Europe monthly salaries of scientists eng in research in Venezuela are high:10
Monthly salary (approximate U.S. dollar equivalent)
170-400 ... 400-440 ... 440-550 ... 550-660 ... 660-770 ... 770-880 ... 880-990 ...
Over 990 ...
:es whose con- England than from any single Latin American Both problems country. In all, 14 European countries are xt of total na- represented by the scientists who have moved ural, and eco- to Venezuela.
Indeed, more scientists have been
at-ople from one tracted to Venezuela from Europe than from
in America is elsewhere in Latin America. Two reasons for novement is to this are that there are many more scientists in rapid growth Europe than in Latin America and that con-icomes, on the ditions for scientific work in many European .atin America. countries have not been the best in the world. and physicians The case of Venezuela is particularly instruc-.ct many excel- tive because it illustrates the powerful influence e. Indeed, the of money. The ability of Venezuela to attract aged full time scientists can be primarily attributed to her rich extraordinarily endowment of petroleum. But general pros-perity alone was not enough. Venezuela has had to take specific steps to ensure high salaries for scientists. While Venezuelan salaries are Percentage of very high by Latin American standards and
scientists high by European standards, they are not high 6 by U.S. standards. Thus, it is not necessary 7 for the Latin American countries to match ... 14 U.S. salary levels in order to keep their pro-.. 33 fessionals at home and to attract migrants from ... 17 other countries.
... 13
T'Mr-
mnolres --- F>m»"- ^_crio-c--C-6 4
There are about 750 scientists in Venezuela. Of these, approximately 20 per cent are for-eigners and another 17 per cent are naturalized citizens. In the first group, foreigners who have migrated but who have not become naturalized citizens, about 50 are from Latin America, 80 from Europe, and 15 from elsewhere. Spain has supplied the largest number-about 35-and Argentina the next-about 15. Other Latin American scientists have come from Peru, Brazil, Bolivia, Chile, Colombia, Costa Rica, Cuba, Ecuador, Mexico, and Uruguay. Still, more migrants have come from Italy and from
10 Bases para la Creación de un Consejo Nacional de Investigaciones Científicas y Tecnológicas en Venezuela; Informe que Presenta la Comisión Prepa-ratoria Designada al Efecto, Caracas, Junio 1964.
k11UIC. ID Il 1U.IUIi:{kU 111UVUIIiUilL[ MbUCII{.l.1
among other Latin American countries, most notably to Mexico, but this flow is not large enough to raise questions of national policy.
2.3 Movement by Country-Numbers and Rates
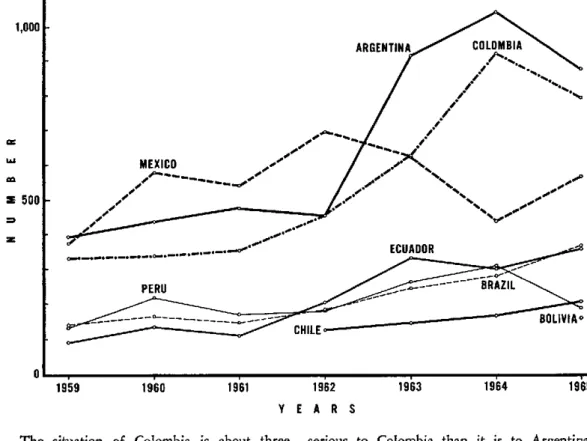
The Latin American country most adversely affected by migration in recent years has been Cuba, primarily as a consequence of unique political circumstances. Apart from Cuba, the two countries with the largest number of emi-grants have been Argentina and Colombia. In both of them, the number of emigrants remained fairly level in the 350-to-500 range from 1959 through 1962, but it took an upward turn in 1963 and had increased to nearly 1,000 from Argentina and 900 from Colombia by 1965 (Figure 2 and Table 5).
i
FIG. 2. PROFESSIONAL, TECHNICAL, AND KINDRED WORKERS ADMITTED AS IMMIGRANTS TO THE UNITED STATES, FROM
SELECTED COUNTRIES OF THE AMERICAS, 1959-1965
1,000
-AR(
5005U
O
ECUADOR
-
---PERU -- -BRAZIL
-L----EI - - BOLIVIA°
CHILE
1959 1960 1961 1962
YEARS
1963 1964
The situation of Colombia is about three times as difficult as that of Argentina. In the first place, per capita gross national product in Colombia is only about half of that in Argentina-approximately $300 as compared to approximately $600. Therefore, fewer re-sources are available to make for the kind of conditions that will attract and hold profes-sional people. In the second place, although Colombia's population of 15 million is about 70 per cent of Argentina's 22 million, the base of professional people is much smaller. Co-lombia has 50 physicians for every 10,000 people, whereas Argentina has about 150 per 10,000. Colombia has only about 7,000 en-gineers, whereas Argentina has about 22,000. Generally speaking, Argentina has a skilled, professional manpower base about three times as large as that of Colombia. Thus, the loss of a single person is about three times more
serious to Colombia than it is to Argentina. Some of the countries with a low level of out-migration still have problems, however. Ecuador and Brazil provide an interesting con-trast in this regard. Every year over the last decade about the same number of professional and related persons have migrated to the United States from both countries. The trend of migration from each country has risen moder-ately but steadily. However, Brazil has more than 25,000 physicians and 25,000 engineers, whereas Ecuador has fewer than 2,000 in each of these categories. Brazil and Ecuador have roughly the same ratio of physicians to popula-tion, but the total population of Brazil is ap-proximately 80 million, whereas that of Ecuador is only about 5 million. The per capita gross national product in each of the two countries is roughly $200, but Brazil has a number of im-portant economic and cultural centers where
13
TABLE 5. PERSONS ADMITTED TO THE UNITED STATES WITH IMMIGRANT VISAS, FROM SOUTH AMERICA, ARGENTINA, AND COLOMBIA,
SELECTED PROFESSIONS, 1965
Professional group South America Argentina Colombia
Total, all professionals 3,562 973 868
Chemists 60 20 6
Professors (all kinds) 134 36 46
Physicians 348 140 82
Engineers, total 299 88 70
Civil 49 12 12
Electrical 28 5 10
Mechanical 36 10 6
Other 186 61 42
Biologists and agricultural scientists 39 6 13
Mathematicians and physicists 9 4 2
Nurses 220 43 58
Economists 33 9 14
Teachers, total 689 196 111
Technicians, total 384 130 115
Medical 61 18 19
Electronic 122 43 37
Scientific 20 11 4
Other 181 58 55
Source: Direct information, U.S. Department of Justice, Immigration and Naturalization Service (see Appendix II).
incomes are well above the national average. Clearly, when an equal number of professionals migrate from each country, Ecuador suffers a much more serious loss than does Brazil.
Bolivia and Chile are another example. Roughly the same number of professional persons migrate from each of the countries. But Chile has more than 8 million inhabitants, whereas Bolivia has about 4 million. The per capita gross national product is approximately
$500 in Chile and about $150 in Bolivia. Chile has about 5,000 physicians; Bolivia, about 1,000. Thus, the migration of professional persons is a far more serious matter for Bolivia than it is for Chile.
In terms of per million inhabitants, migra-tion from Costa Rica, the Dominican Republic, Haiti, and Trinidad and Tobago is particularly significant, even though the absolute numbers of migrants are small (Figure 3).
The two South American countries most affected by migration are Ecuador and Co-lombia, with Argentina in third place. Mexico, Chile, and Venezuela are in an intermediate
FIG. 3. POTENTIAL1) LOSS OF PROFESSIONAL AND TECHNICAL WORKERS, BY COUÑTRY,
LATIN AMERICA, 1965
(Immigrant Visas to the U.S. per Million Population)
0 20 40 60 80 100 , 200
. . . .. . ,
LATI1 AMERICA2) i
MEIC
CDSTA RiCA
MINICAl REP. TRINIDAD AiO
TOAlGO
GUATEMALA
ECUADOO
COOMBIlJ
ARGENTUN
Cxiif
lWUEZUEU
PERi
URUGUAI
88iZ~
11 A sulbrtlotl p.,erceta of thse who obin iroAo Vt v.isas w ii return
position. Peru, Uruguay, and Brazil-particu-larly Brazil-lose relatively few highly trained people.
2.4 Migration by Occupational Group
Migration of highly trained persons is not concentrated in any specific occupational field.
Countries from which large numbers migrate lose many people in all professions. For ex-ample, Argentina, Colombia, and Mexico have lost the largest numbers in all of the major
skilled groups. (More professors have entered the United States from Colombia, however, than from any other Latin American country.) By and large, the factors giving rise to migra-tion are common to all fields. The basic issues in Latin America do not, as in some other parts of the world, relate to the establishment of priorities among the different scientific fields, allocation of resources to the various disciplines, or the like; rather, they pertain to the operation of the total society and economy and to the emphasis placed on science and higher educa-tion as contrasted with other important areas of activity.
3. MIGRATION BY PROFESSION
3.1 Physicians
Every year about 300 physicians migrate from Latin America to the United States.1l
This number is equal to the annual output of
three large U.S. medical schools. It would cost
at least $60 million to build three teaching medical centers and more than $15 million
1 The number who enter with an immigrant visa
is a firm figure. The number of these who actually migrate is an estimate.
a year to operate them. In these terms, the value of the physicians coming to the United States is roughly equal to that of all U.S. medical assistance to Latin America.
Migration of Latin American physicians to the United States was uncommon before 1950, but in recent years the rate has increased
pro-gressively.12 Between 1956 and 1960 a total
12 See Chapter 4 for a full discussion of the data presented in this summary.
FIG. 4. PERSONS ADMITTED TO THE UNITED STATES WITH IMMIGRANT VISAS FROM LATIN AMERICA, SELECTED COUNTRIES AND OCCUPATIONS, 1965
N U Ba E R
120 160
ARGENTINA
COLOMBIA
ECUADOR
BRAZIL
CHILE
PERU
40 80 1 20U
40 50 120
TECHNICIANS
a MEDICAL A aLL TYPES
Xl
I
NURSES
ARGENTINA
MEXIC
COLOMBIA
BRAI11
PERt
ECUADO0
CHILE
PHYSICIANS
IM
[]
10o 200 I
TEACHERS ALL TYPES
ARGENTINA COLOMBIA MEXICO
BRAZIL
CHILE PERO ECUADOR
COLOMBIA
ARGENTINA
BRAsIL
MEXICO PERU CHILE ECUADOO
ENGINEERS
ALL KIOS
ARGENTINA
COLOMBIA MEXICO ECUADOR
CHILE
BRAZIL
PERU
COLOMBIA
MEXICO
ARGENTINA ECUADOR
BRA1IL PERU CHILE
PROFESSORS
ALL TYPES
I
·
I
1 I
I
I I r I I I I I I I~~~~~~~~~~~~~~~~~~~~~~~~~~~~~~~~~~~~~~~~~~~~~~~~~~~~~~~~~~~~~~~~~~~~NIEXICgOi~
· , . . ·
. .· .
v
a s ·
g Z l a i
6 I 9 1 6
il1
zQ0zm
EMEROM
m= m m m a
of 1,765 physicians wc States with immigrant
(not including Cuba) 1965 some 2,500 wc tribution by major follows:
Area Total Mexico
Central America South America
ere admitted to the United As in the case of professionals in general, visas from Latin America the migration of physicians to the United ), whereas from 1961 to States does not pose as severe a problem to the ere admitted. Their dis- Latin American countries as it does to certain eographical areas was as countries in other parts of the world. For example, as many physicians migrate annually to the United States from the Philippines as
1956- 1961- from all the countries of South America
com-Total 1960 1965 bined. As many physicians migrate to the
4,257 1,742 2,515 United States from Turkey as from Argentina,
704 286 418 but Turkey only produces a third as many
762 300 462 physicians each year as Argentina does and
2,791 1,156 1,635 has only one fourth as many physicians in
relation to total population. Most physicians who have immigrated
en-tered the United States as interns or residents. There are currently about 2,200 interns and residents in the United States who are graduates of Latin American schools.
Of the 3,773 graduates of Latin American medical schools in the United States who are not interns or residents, approximately 1,300 are from Cuba, 933 from Mexico (about one third of these are U.S. citizens), 399 from Argentina, 294 from the Dominican Republic,
211 from Colombia, 186 from Peru, and 101 from Brazil.
The 1965 rate of immigration represents about 5 per cent of the annual output of all medical schools (excluding the Cuban schools) in Latin America. If Cuba is included, the proportion goes up to 8 per cent. To ap-preciate the magnitude of this trend, the situa-tion may be imagined in reverse: What would happen in the United States if every year a comparable proportion of the annual U.S. out-put-between 300 and 500 physicians-were to migrate to Latin America? An acute reaction indeed could be expected.
Approximately 25 per cent of those physicians who are potential scientists and teachers are being lost to Latin America by migration to the United States. Probably as many as 100 highly trained Latin American physicians in the United States would return to their countries to pursue academic careers if suitable oppor-tunities were available.
Of the physicians who migrate to the United States from Latin America, three out of every four come from Argentina, Colombia, Mexico, and Peru. Moreover, three out of four migrants come from eight Latin American medical schools:
Argentina
National University of Buenos Aires 13
National University of Córdoba
Colombia
National University of Bogotá
Dominican Republic
University of Santo Domingo
Haiti
University of Haiti
Mexico
National University of Mexico 13
University of Nuevo León
Peru
San Marcos National University
Six of these universities (all except the National University of Córdoba and the Na-tional University of Bogotá) accounted for al-most 60 per cent of those who migrated in 1960.
As background for these data, it is useful to bear in mind that 80 per cent of all Latin
t3 Appendix VI gives detailed information on the current status of graduates now in the United States from these two universities.
American physicians come from six co Argentina, Brazil, Colombia, Cuba, and Venezuela-and that two thirds duced by Argentina, Brazil, and Mexi
The effects of migration on ir
countries depend not only on the nur also on the proportion of physicians Annual migration in relation to ann duction of new physicians is estin follows for the period 1961-1965:
Area and country Total
Migrar
as a perce of gradu
5
Mexico ... 8 Central America ... 22 South America ... 9
Argentina ... Colombia .
For countries that have relatively 1
sicians, the loss of even a small numbei migration can generate serious di Smaller countries having a high rate c
tion are the following:
Migran as a perce
Country of gradu
Dominican Republic ... 14
Haiti ... ... 2C
Nicaragua .... 1E
3.2 Nurses 14
Nurses throughout Latin America difficult economic and social position, is the primary cause of migration. Sal
low; working conditions are often un opportunities for advancement are qu and job stability is sometimes affe political changes. Moreover, nurses
14 The Zone Offices of PAHO, officials American governments, the central nursing PAHO, and the American Nursing Associat cooperated in supplying data for this sect
untries- enjoy a very high social status. Thus, many Mexico, have a clear motive to migrate, particularly to are pro- the United States where wages and working co alone. conditions are relatively good. But there are ndividual many factors that inhibit migration as well. A mber but number of nurses belong to religious orders and leaving. are completely dedicated to their work in their nual pro- home countries or other Latin American coun-nated as tries. Women often have very strong family ties, and the prospect of migration poses a forbidding personal and cultural change. Also, nts many of them do not have the kind of training entage required for easy employment in the United ates States. Frequently they do not speak English. Jobs are available in the United States for well-trained Latin American nurses who have an adequate command of English.'5 Salaries,
6 working conditions, and status are all more 16 favorable, often markedly so, than in the Latin American countries. The yearly salary of the
few phy- average registered nurse in a nonfederal metro-through politan hospital is $4,500. Thus, the United ifficulties. States offers strong attracting forces for nurses. of migra- The migration pattern of nurses varies wide-ly from one country to another. Of the 510 Latin American nurses admitted to the United *ts States with immigrant visas in 1965, almost LIL48V
ates
are in a and this laries are pleasant; ite poor; ected by
do not
of Latin g office of
ion kindly :ion.
60 per cent came from seven countries-Argentina, Colombia, Costa Rica, Cuba, the Dominican Republic, Ecuador, and Mexico-whereas only a few came from Bolivia, Brazil, Chile, and Peru (Table 6).
In most Latin American countries the migra-tion of nurses is not a serious problem, but in a few of them, specifically noted below, the situation is cause for concern.
15 "National Crisis in Nursing," Medical World News, January 20, 1966. The shortage of nurses in
the United States approaches a crisis stage. This shortage arises from two primary sets of factors-those affecting the supply of nurses and factors-those affect-ing the demand. The supply is restricted by such factors as low salaries relative to those available to girls in other occupations, relatively unfavorable working conditions, and marriage. Demand is high because of rising standards of medical care, rising demand for medical care, and increases in the range of services provided by nurses.
.1