Trends of Some Public Health Indicators in Chile,
1971-1980
The health policy of the Government of Chile is focused basically on services to individuals and environmental ac-tion. The health sector-which has been reorganized to help accomplish its objectives more efficiently-includes the Ministry of Health, a system of 27 health services, and other agencies that, because of their specific function, answer to the Ministry. Eighty per cent of the population (estimated at around 11 million) comes under the Na-tional Health Services System.1
Some biodemographic indicators show the develop-ment of public health in the country during the
1971-1980 period (Table 1).
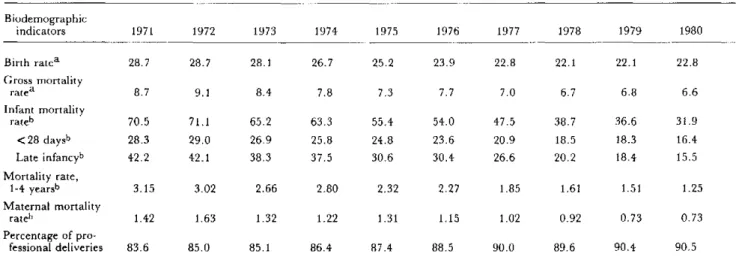
In 1980, the birth rate was 22.8 per 1,000 population, which represents an increase over 1978 and 1979 (22.1). On the other hand, the death rate (6.6 per 1,000 popula-tion) showed a decline over previous years. As a result of these two factors, the increase in the vegetative growth of the population was 1.62 per cent.
In 1980 the total number of deaths of those under one year of age was 8,072, which reduced the rate per 1,000 live births to 31.9 (36.6 per 1,000 in 1979). This decrease was also noted in mortality among infants under 28 days and in late infant mortality, and was due mainly to the
1
Estrategias de salud de Chile hasta el año 2000. Office of Communica-tions and Public RelaCommunica-tions, Ministry of Health, Chile, 1981.
reduction in the principal causes of death in children under one year: diarrhea and bronchopneumonia. Mor-tality in infants under 28 days for the first time exceeded the death rate in the following 11 months.
For the last two years, the maternal death rate has re-mained at 0.73 per 1,000 live births, mainly because abortion-related deaths rose from 0.24 in 1979 to 0.28 per 1,000 live births in 1980. However, an overall decline was noted in maternal deaths, and is directly related to the in-crease in professional deliveries.
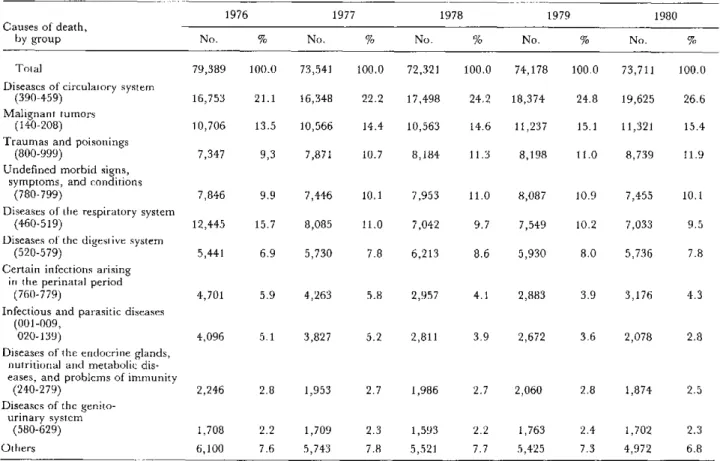
The changes noted in the biodemographic indicators examined also modify the relative importance of the prin-cipal causes of deaths (Table 2). In effect, as the easily controllable causes, generally occurring in younger groups, are overcome, the causes of death characteristic of older age groups remain high or change at a slower rate. Cardiovascular diseases, which went from fifth to first place as a major cause of death in the last 40 years, re-mained at the top of the list in 1980, with an annual rise of more than 1,000 deaths as compared with 1979; these figures represent 24.8 per cent and 26.6 per cent of the total in those two years.
In the same period, cancer rose from eighth to second place, growing slightly worse between 1979 when it caused 15.4 per cent of all deaths. Accidents and other violent deaths, which did not appear among the 10 principal causes 40 years ago, continued to multiply until they
.
.
Table 1. Biodemographic indicators, Chile, 1971-1980.
Biodemographic
indicators 1971 1972 1973 1974 1975 1976 1977 1978 1979 1980
Birth ratea 28.7 28.7 28.1 26.7 25.2 23.9 22.8 22.1 22.1 22.8
Gross mortality
ratea 8.7 9.1 8.4 7.8 7.3 7.7 7.0 6.7 6.8 6.6
Infant mortality
rateb 70.5 71.1 65.2 63.3 55.4 54.0 47.5 38.7 36.6 31.9
<28 daysb 28.3 29.0 26.9 25.8 24.8 23.6 20.9 18.5 18.3 16.4
Late infancyb 42.2 42.1 38.3 37.5 30.6 30.4 26.6 20.2 18.4 15.5
Mortality rate,
1-4 yearsb 3.15 3.02 2.66 2.80 2.32 2.27 1.85 1.61 1.51 1.25
Maternal mortality
rateb 1.42 1.63 1.32 1.22 1.31 1.15 1.02 0.92 0.73 0.73
Percentage of
pro-fessional deliveries 83.6 85.0 85.1 86.4 87.4 88.5 90.0 89.6 90.4 90.5
Total population 9,533,989 9,697,448 9,860,611 10,026,069 10,196,423 10,371,939 10,550,886 10,732,863 10,917,485 11,104,293
aper 1,000 population. bPer 1,000 live births.
Table 2. Principal causes of death, by group, Chile, 1976-1980.
1976 1977 1978 1979
Causes of death,
by group No. % No. % No. % No. % No. %
Total
Diseases of circulatory system (390-459)
Malignant tumors (140-208)
Traumas and poisonings (800-999)
Undefined morbid signs, symptoms, and conditions
(780-799)
Diseases of the respiratory system (460-519)
Diseases of the digestive system (520-579)
Certain infections arising in the perinatal period
(760-779)
Infectious and parasitic diseases (001-009,
020-139)
Diseases of the endocrine glands, nutritional and metabolic dis-eases, and problems of immunity
(240-279)
Diseases of the genito-urinary system
(580-629)
Others
79,389 100.0 73,541 100.0 72,321 100.0 74,178 100.0 73,711 100.0
16,753 21.1 16,348 22.2 17,498 24.2 18,374 24.8 19,625 26.6
10,706 13.5 10,566 14.4 10,563 14.6 11,237 15.1 11,321 15.4
7,347 9,3 7,871 10.7 8,184 11.3 8,198 11.0 8,739 11.9
7,846 9.9 7,446 10.1 7,953 11.0 8,087 10.9 7,455 10.1
12,445 15.7 8,085 11.0 7,042 9.7 7,549 10.2 7,033 9.5
5,441 6.9 5,730 7.8 6,213 8.6 5,930 8.0 5,736 7.8
4,701 5.9 4,263 5.8 2,957 4.1 2,883 3.9 3,176 4.3
4,096 5.1 3,827 5.2 2,811 3.9 2,672 3.6 2,078 2.8
2,246 2.8 1,953 2.7 1,986 2.7 2,060 2.8 1,874 2.5
1,708 2.2
6,100 7.6
1,709 2.3
5,743 7.8
1,593 2.2
5,521 7.7
1,763 2.4
5,425 7.3
1,702 2.3
4,972 6.8
Note: The figures in brackets correspond to categories in the Ninth Revision of the International Classification of Diseases.
became the third major cause, exceeding 1979 figures by almost 7 per cent, to account for 11.9 per cent of all deaths.
On the other hand, deaths due to early infant diseases continued to decline, as did those resulting from infec-tious and parasitic diseases, falling from second to eighth place, with 2,078 deaths (2.8 per cent of the total).
Tuberculosis, which caused almost 13,000 deaths a year four decades ago (at a rate of 260 per 1,000 popula-tion), disappeared from the list of the 10 major causes, with only 1,355 deaths in 1980.
The changes mentioned above reflect the efforts made in disease control, which in addition to reducing the total
number of deaths have also altered the age composition of the population. For example, as a result of the increase in older age groups, the causes of death characteristic of those groups also rose. Accidents, though a cause in which improvements can be made, are the one exception since they increase constantly among the young and middle-aged, influenced as they are by the transformation of an agrarian society into an industrial one and by the dis-placement of rural populations to urban areas.
(Source. Boletin de Vigilancia Epidemiológica,
Vol. VII, Nos. 5 and 6, May-June 1981, Ministry of Health, Chile.)