3. Age 60 years or older at diagnosis
4. Age under 28 days (neona-tal) at diagnosis
5. An immune deficiency atypical of AIDS, such as one involving hypogam-maglobulinemia; or an immune deficiency of which the cause appears to be a genetic or devel-opmental defect (e.g., thymic dysplasia)
3. Kaposi's sarcoma
4. Toxoplasmosis, cytomegalo-virus, or herpes simplex virus infections
5. Any infection or cancer diagnosed before or during such immune deficiency
Basic surveillance principles, including careful case definition, case reporting, and data analysis can be ap-plied to AIDS surveillance. In the absence of any inter-vention, the goal of surveillance must be the identifica-tion of patients for further epidemiological and bio-logical study. Case definition must take into considera-tion the level of laboratory capability.
PAHO's Epidemiology Unit at Headquarters will act as a clearinghouse to collect voluntary data on the occurrence of cases in the Region.
(Source: Epidemiology Unit, Health Programs Development, PAHO.)
Surveillance of the Leading Causes of Premature Death
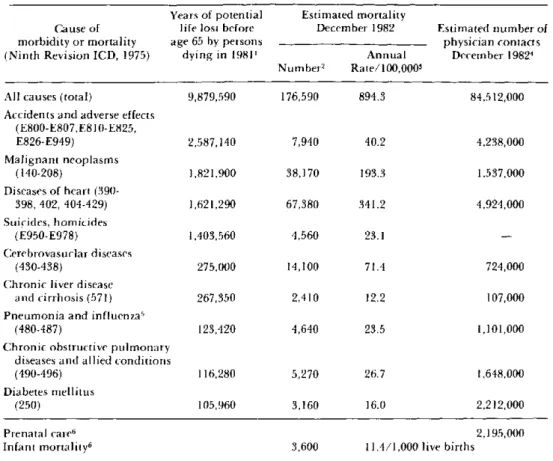
Because death is inevitable, the goal of public health is not to reduce the total number of deaths, but rather to increase the number of years that a person is active and healthy. Thus, the years of potential life lost due to a particular cause is a more useful index for public health practitioners than is the total number of deaths due to that cause. In March 1982 the U.S. Centers for Disease Control introduced a new table in its Morbidity and Mortality Weekly Report (Vol. 32(18):243): "Table V. Potential years of life lost, deaths, and death rates, by cause of death, and estimated number of physician con-tacts by principal diagnosis" (1) (Table 1). The table was designed to provide the reader information on the relative importance and magnitude of certain health issues. In the past, the importance of specific health problems has often been gauged by the number of deaths attributed to each. The new table was developed to emphasize the concept that the age of those who die from a particular problem is also an important de-terminant of the public health significance of that problem. Thus, a condition that causes a number of deaths among predominantly young people may have a higher priority for prevention than one which causes the same number of deaths among a generally elderly population.
The relative importance of causes of death changes dramatically when viewed in terms of potential years of life lost prematurely (before age 65). For example, in 1981 heart disease, cancer, and cerebrovascular disease accounted for 67.7 per cent of all deaths in the United
States; motor vehicle and other accidents, suicide, and homicide accounted for 7.8 per cent (2). However, for the same year, motor vehicle and other accidents, sui-cide, and homicide accounted for 40.4 per cent of the total years of life lost prematurely; heart disease, cancer, and cerebrovascular disease accounted for 37.6 per cent (3).
The age-specific nature of health problems in the United States was addressed in 1979 in Healthy People: The Surgeon General's Report on Health Promotion and Disease Prevention (4). This report established
priority areas for preventing morbidity and mortality by life stages in the United States; these included:
Infants:
Children:
Adolescents and young adults:
Adults:
low birth weight, birth defects, injuries at birth, sudden infant death syndrome, and accidents;
learning disorders, mental retardation, child abuse and neglect, nutrition, and accidents;
motor vehicle and other accidents, sui-cide, homisui-cide, sexually transmissible diseases, teenage pregnancy, alcohol
and drug misuse, and mental health;
heart disease, malignant neoplasms, cerebrovascular disease, pneumonia and influenza, diabetes mellitus, and cirrhosis.
Table 1. Years of potential life lost, cleaths, and death rates, by cause of death, and estimated number of physician contacts, by principal diagnosis, United States.*
Years of potential Estimated mortality
Cause of life lost before December 1982 Estimated number of morbidity or mortality age 65 by persons physician contacts (Ninth Revision ICD, 1975) dying in 1981' Annual December 19824
Number2 Rate/100,0003
All causes (total) 9,879,590 176,590 894.3 84,512,000
Accidents and adverse effects (E800-E807,E810-E825,
E826-E949) 2,587,140 7,940 40.2 4,238,000
Malignant neoplasms
(140-208) 1,821,900 38,170 193.3 1,537,000
Diseases of heart
(390-398, 402, 404-429) 1,621,290 67,380 341.2 4,924,000
Suicides, homicides
(E950-E978) 1,403,560 4,560 23.1
-Cerebrovasuclar diseases
(430-438) 275,000 14,100 71.4 724,000
Chronic liver disease
and cirrhosis (571) 267,350 2,410 12.2 107,000
Pneumonia and influenzas
(480-487) 123,420 4,640 23.5 1,101,000
Chronic obstructive pulmonary diseases and allied conditions
(490-496) 116,280 5,270 26.7 1,648,000
Diabetes mellitus
(250) 105,960 3,160 16.0 2,212,000
Prenatal care6 2,195,000
Infant mortality6 3,600 11.4/1,000 live births
*Reproduced from Morbidity and Mortality Weekly Report 32(18):243, 1982. Table V.
'Years of potential life lost for persons between I year and 65 years old at the time of death are derived from the number of deaths in each age category as reported by the National Center for Health Statistics, Monthly Vital Statistics Report (MVSR), Vol. 30, No. 13, December 20, 1982, multiplied by the difference between 65 years and the age at the midpoint of each category. As a measure of mortality, "Years of potential life lost" underestimates the importance of diseases that contribute to death without being the underlying cause of death.
2
The number of deaths is estimated by CDC by multiplying the estimated annual mortality rates (MVSR Vol. 32, No. 1, April 18, 1983, pp. 8-9)and the provisional U.S. population in that month (MVSR Vol. 31, No. 12, March 14, 1983, p. I and dividing by the days in the month as a proportion of the days in the year.
'Annual mortality rates are estimated by NCHS(MVSR Vol. 32, No. 1, April 18, 1983, pp. 8-9), using the underlying cause of death from a systematic sample of 10 percent of death certificates received in state vital statistics offices during the month and the provisional population of those states included in the sample for that month.
41IMS America National Disease and Therapeutic Index (NDTI), Monthly Report, December 1982, Section III. This estimate comprises the number of office, hospital, and nursing home visits and telephone calis prompted by each medical condition based on a stratified random sample of office-based physicians (2,100) who record all private patient contacts for 2 consecutive days each quarter.
SData for "infectious diseases and their sequelae" as a cause of death and physician visitscomparable to other multiple-code categories (e.g., "malignant neoplasms") are not presently available.
6"Prenatal care' (NDTI) and "Infant mortality" (MVSR Vol. 31, No. 12, March 14, 1983, p. 1) are included in the table because "Years of potential life lost" does not reflect deaths of children < 1 year.
In American (excluding the United States) and Caribbean countries, the leading causes of premature death and unnecessary morbidity may include other conditions. For example, enteritis, pneumonia and influenza, and measles were the three leading causes of
mortality in children 1-4 years of age in Guatemala in 1978 (5).
In Healthy People, the Surgeon General maintained that further improvements in health could be achieved through actions of individuals as well as through
12
.
e
efforts by administrators in the public and private sec-tors to promote a safer, healthier environment. In con-junction with this philosophy, "Table V" (our Table 1) informs the reader about health areas that offer the
greatest potential for improvement.
Specifically, the index used in the table is an estimate of the number of years of potential life lost before age 65 for persons 1-65 years of age at the time of death. The estimates are derived yearly by multiplying the annual number of deaths in each age category by the difference between 65 years and the median age of death in each category. CDC chose to use the terminal age of 65 years because if deaths of persons older than 65 years are included, greater weight is given to natural causes of death, and premature and preventable causes of death become less distinct. Infant deaths are excluded because the leading causes of infant mortality in the United States are conditions specific to the perinatal period (e.g., birth asphyxia, respiratory distress syndrome) whose preventability has not been well demostrated. It was believed these deaths of low preventability would contribute a disproportionately large share of years of potential life lost. In an effort not to exclude or underrepresent these deaths in this table, a separate measure provides the reader with the mnonthly infant mortality rate.
The concept of years of potential life lost was rapidly and enthusiastically embraced by public health practi-tioners; however, the method used to estimate this number has been a source of controversy: the main problem lies in the choice of years of life to be included in the analysis. Several proposed alternatives for esti-mating the "normal" terminal year of complete life include: 1) an arbitrary terminal year, e.g., 70; 2) cur-rent life expectancy at birth; and 3) curcur-rent life expec-tancy at the age of premature death. A measurement of life expectancy at the age of premature death with the cause of death partially or completely eliminated in the calculation of life expectancy, reflects the cause-specific reduction in mortality risks. This provides the best estimate of the potential gain in life years that could result from disease control. However, because of the complexity of this estimate, CDC chose to use an arbi-trary terminal age for surveillance purposes.
In addition to years of potential life lost, the table also shows the monthly mortality rate and a measure of morbidity for each of the leading causes of premature death. The measure of morbidity is based on a random sample of contacts with office-based physicians in the continental United States.
As with all data summaries, complexity and detail are sacrificed, and subtle issues may be obscured. There-fore, the table is usually accompanied by an article presenting a more detailed analysis of a particular health issue, including health-status indicators, risk-factor prevalence, and other risk-factors affecting public health.
The new table presents measures of morbidity and mortality to emphasize the impact some preventable problems have on public health. The table's develop-ment and publication reflects CDC's increased respon-sibility to promote action that reduces unnecessary morbidity and premature mortality.
References
(1) Introduction to Table V: Premature deaths, monthly mortality, and monthly physician contacts-United States.
MMWR 31:109-110, 1982.
(2) National Center for Health Statistics. Monthly Vital
Statistics Report 31(6), 1982.
(3) Premature Death-United States. MMWR 32:188-189. 1983.
(4) Healthy People: The Surgeon General's Report on
Health Promotion and Disease Prevention. Washington,
D.C., U.S. Department of Health and Human Services, Public Health Service, Office of the Assistant Secretary for Health and Surgeon General. Publication No. 79-55071, 1979.
(5) PAHO. Mortality in children 1-4 years of age in the Americas. Epidemiological Bulletin 4(2):1-4, 1983.
(Source: Division of Surveillance and
Epidemio-logic Studies, Epidemiology Program Office, U.S. Centers for Disease Control, Atlanta, Georgia.)
Editorial Comments
This article is an excellent example of the need to adopt new points of view and use new methods in the process of identifying health priorities. The develop-ment-in Latin America and the Caribbean-of a sim-ilar methodology, or perhaps the adaptation of that used by the CDC, will bring new elements to bear on the evaluation of the importance of current health prob-lems and on the establishment of programs to reduce early or unnecessary mortality and morbidity.
13