www.nat-hazards-earth-syst-sci.net/14/1223/2014/ doi:10.5194/nhess-14-1223-2014
© Author(s) 2014. CC Attribution 3.0 License.
Integrated tsunami vulnerability and risk assessment: application to
the coastal area of El Salvador
P. González-Riancho1, I. Aguirre-Ayerbe1, O. García-Aguilar1, R. Medina1, M. González1, I. Aniel-Quiroga1,
O. Q. Gutiérrez1, J. A. Álvarez-Gómez2, J. Larreynaga3, and F. Gavidia3
1Environmental Hydraulics Institute IH Cantabria, Universidad de Cantabria, C/Isabel Torres no. 15, Parque Científico y
Tecnológico de Cantabria, 39011 Santander, Spain
2Department of Geodynamics, Faculty of Geology, Complutense University of Madrid, C/ José Antonio Novais, s/n, 28040
Madrid, Spain
3Ministry of Environment and Natural Resources, Kilómetro 5 1/2 Carretera a Santa Tecla, Calle Las Mercedes, San
Salvador, El Salvador
Correspondence to:P. González-Riancho (grianchop@unican.es)
Received: 8 May 2013 – Published in Nat. Hazards Earth Syst. Sci. Discuss.: 26 June 2013 Revised: 28 March 2014 – Accepted: 4 April 2014 – Published: 22 May 2014
Abstract. Advances in the understanding and prediction of tsunami impacts allow for the development of risk reduc-tion strategies for tsunami-prone areas. This paper presents a tsunami vulnerability and risk assessment for the case study of El Salvador, the applied methodology dealing with the complexity and variability of coastal zones by means of (i) an integral approach to cover the entire risk-related process from the hazard, vulnerability and risk assessments to the fi-nal risk management; (ii) an integrated approach to combine and aggregate the information stemming from the different dimensions of coupled human and natural systems; and (iii) a dynamic and scale-dependent approach to integrate the spa-tiotemporal variability considerations. This work also aims at establishing a clear connection to translate the vulnerability and risk assessment results into adequate target-oriented risk reduction measures, trying to bridge the gap between science and management for the tsunami hazard. The approach is ap-plicable to other types of hazards, having been successfully applied to climate-change-related flooding hazard.
1 Introduction
Advances in the understanding and prediction of tsunami im-pacts allow for the development of risk reduction strategies for tsunami-prone areas. Tsunami risk assessments are es-sential for the identification of the exposed areas and of the
most vulnerable communities and elements, with the hazard, vulnerability and risk results being critical for the formula-tion of adequate, site-specific and vulnerability-oriented risk management options.
al., 2012; Koeri et al., 2009; Jelínek et al., 2009), the en-vironmental resources (Fundación-Terram, 2012; ECLAC, 2003) or the socioeconomic system (ECLAC, 2003). Many deal with resilience, coping capacities, preparedness, etc. (UNESCO, 2009a; Wegscheider et al., 2011; US IOTWSP, 2007), with some of them concentrating on tsunami evacu-ation modelling (Van Zuilekom et al., 2005; Aboelata and Bowles, 2005; Mück, 2008; Clerveaux et al., 2008; Alvear Brito et al., 2009; Kolen et al., 2010).
Individual risk, hazard and/or vulnerability assessments can be partial, sectoral or specific. However, risk manage-ment requires an integrated and holistic understanding of the coupled human and natural system (CHANS) dealt with, otherwise management options can produce unexpected and sometimes undesired results. According to Rotmans and Dowlatabadi (1998), the integrated assessment is aimed at combining, interpreting and communicating knowledge from diverse scientific fields in order to comprehensively tackle an environmental problem by stressing its cause–effect links in their entirety. Integration refers in this paper to the under-standing and combination of risk components, dimensions and scales affecting a CHANS, one of the major challenges being the systematic combination and aggregation of differ-ent types of data and information (i.e. quantitative vs. qual-itative) from various disciplines, scales and data acquisition methodologies.
Vulnerability is multi-dimensional and differential, as it varies across physical space and among and within social groups; scale dependent regarding time, space and analysis units; and dynamic, as the characteristics and driving forces of vulnerability change over time (Vogel and O’Brien, 2004). The current literature encompasses several different defini-tions, concepts, frameworks and methods to systematise vul-nerability (Birkmann, 2006), very little information being provided about how to apply the different existing theoret-ical and conceptual frameworks and how to integrate the dif-ferent risk-related concepts. Furthermore, risk assessment re-sults sometimes do not provide conclusions on how to reduce the risk at the identified areas, lacking a clear correlation be-tween risk assessment and management.
The starting point of this work is the existing theoretical frameworks and approaches such as the MOVE framework (Birkmann et al., 2013), Turner et al. (2003) or the BBC conceptual framework (Birkmann, 2006). The main expected contribution is to provide a straightforward method to fa-cilitate the implementation of some theoretical concepts to case studies, as this is sometimes complex due to site-specific problems, lack of data or the lack of information about par-ticular methodological aspects. The final aim of the risk as-sessment is the identification of the expected impacts on each dimension as input for the formulation of adequate target-oriented risk reduction measures.
The objectives and structure of this paper are the presen-tation of the integrated tsunami vulnerability and risk assess-ment carried out in El Salvador, considering the different
risk components, dimensions and spatiotemporal scales and the methodological process to integrate them (Sect. 2), and the establishment of a clear connection to translate the vul-nerability and risk assessments into risk reduction measures, trying to bridge the gap between science and management for the tsunami hazard, and its application to the coastal area of El Salvador (Sect. 3). Finally, some conclusions are pre-sented in Sect. 4.
2 Integrated tsunami risk assessment for El Salvador
Due to the large array of terms on risk and vulnerability and the often unclear relationships between them, it is essen-tial to first clarify the conceptual framework applied in this paper. Regarding the risk components, this methodology is based on the definition ofriskas the probability of expected
harmful consequences or losses resulting from interactions between natural or human-induced hazards and vulnerable conditions (UN/ISDR, 2004), the mentioned consequences being the negative effects of disaster expressed in terms of human, economic, environmental, infrastructural and social impacts (adapted from ISO, 2009). Therefore, risk depends on the specific impact analysed (e.g. loss of human lives), the characteristics of the threat (e.g. flooding), the exposure of the studied elements (e.g. people in urban areas) and their vulnerability (sensitive groups and resilience).
Thehazardas a dangerous phenomenon (UN/ISDR, 2009)
is analysed based on the different associated threats (which are characterised by their location, intensity, duration, fre-quency and probability) together with their dynamics – i.e. variables and physical processes, involved in their genera-tion. As an example, the specific threats to deal with when analysing climate change hazard could be, among others, sea level rise or an increase in tropical cyclones and droughts, while the dynamics to study would be waves, tides, sea level, sea temperature, precipitation, etc.
Exposurerefers to people, property, systems, or other
el-ements present in hazard zones that are thereby subject to potential losses (UN/ISDR, 2009), whilevulnerabilityto the
conditions is determined by physical, social, economic and environmental factors or processes, which increase the sus-ceptibility of the exposed elements to the impact of hazards (adapted from UN/ISDR, 2004). These vulnerability condi-tions are here understood to be of two types, internal (un-changeable individual conditions, such as the age of the pop-ulation) and external (changeable community conditions, im-provable through learning and experience, such as risk pre-paredness within the communities), the improvement of the latter being a possible countermeasure to reduce the vul-nerability of highly sensitive areas. Accordingly,sensitivity
system, community or society exposed to hazards to resist, absorb, accommodate to and recover from the effects of a hazard in a timely and efficient manner, including through the preservation and restoration of its essential basic struc-tures and functions (UN/ISDR, 2009).
The success or failure of many policies and management practices is based on their ability to take into account com-plexities of CHANS (Liu et al., 2007). Understanding the in-terrelationships between human societies and their behaviour patterns, coastal resources and their uses, as well as poli-cies and institutions that govern human activities is essential for adequate coastal management. This requires an integrated and multidisciplinary approach to analyse the entire system in order to understand the feedback loops that manage its be-haviour and equilibrium instead of simply considering spe-cific aspects of a single sector or scientific discipline. This approach is applied here throughout the exposure and vul-nerability assessments, as they are fragmented to incorporate different coastal dimensions (human, environmental, socioe-conomic and infrastructural dimensions) within the tsunami risk assessment, based on EC (2010), the Hyogo Framework for Action (UN, 2005) and the impacts generated in recent tsunami events. Contrary to other previous works found in the literature, the human and socioeconomic dimensions are separated here on purpose, as the information regarding the human dimension will directly feed the evacuation planning of the area (González-Riancho et al., 2013), while the so-cioeconomic dimension focuses on livelihoods and economic losses. The elements at risk vary with time and space, as both factors will change the amount and type of exposed and vulnerable elements. For this reason, and according to EC (2010), impact assessments are defined based on a reference space-time window.
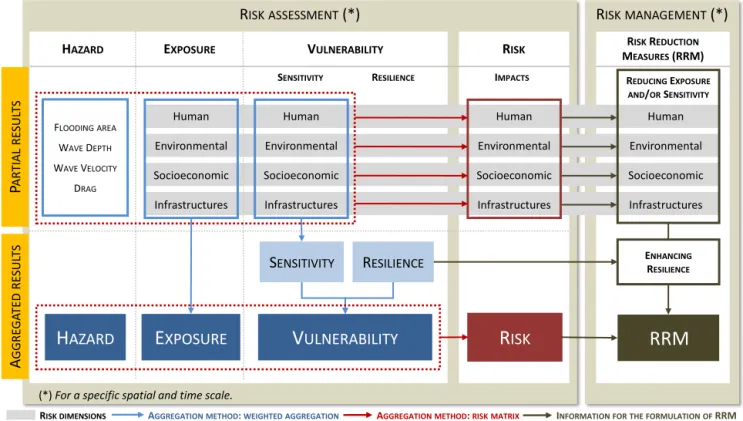
Figure 1 shows the entire process to integrate the risk com-ponents, dimensions and spatial scales. Regarding the inte-gration of dimensions and according to EC (2010), two types of results are provided, partial and aggregated results. The former allow having the analysed impacts available sepa-rately for the different dimensions and components, while the latter combines all the dimensions. Based on the results of the risk assessment and according to UNESCO (2009b), the risk can be mitigated by reducing the vulnerability to the hazard and improving preparedness. Within the work pre-sented here, this translates into the formulation of risk reduc-tion measures to reduce the partial exposure and sensitivity, and to enhance the resilience at the municipality level.
As shown through the colour-coded arrows, the construc-tion of aggregated indices – i.e. exposure, sensitivity and vul-nerability, is performed through weighted aggregation (blue vertical arrows) while the risk calculation, both partial and aggregated results, is performed through the risk matrix (red horizontal arrows). The main advantage of this approach is the generation of partial and aggregated results as well as the possibility of disaggregating them again into risk com-ponents, dimensions and indicators, in order to understand
the precise cause of the obtained results, and thereby provide essential information for risk management (black arrows).
This approach, although presented in this paper for the tsunami hazard, can be used for other types of hazards, hav-ing been already applied by IH Cantabria to climate change-related flooding in Peru and El Salvador within the frame-work of the Inter-American Development Bank project Prob-abilistic Hazard and Vulnerability Assessment Report based on Climate Change Projections (2012).
2.1 Case study
El Salvador is located in an area of high seismic activity which was hit by 15 tsunamis between 1859 and 2012, 9 of which were recorded in the 20th century. All of the tsunamis were generated by earthquakes, and two of them were highly destructive; one in 1902 that affected the eastern coast of the country and one in 1957 that affected Acajutla. The most re-cent, albeit of lesser magnitude, occurred in August 2012, affecting Jiquilisco Bay (IH Cantabria-MARN, 2012). The work presented here is framed within a project for assess-ing the tsunami risk in coastal areas worldwide, and applied specifically to the coast of El Salvador during the 2009–2012 period.
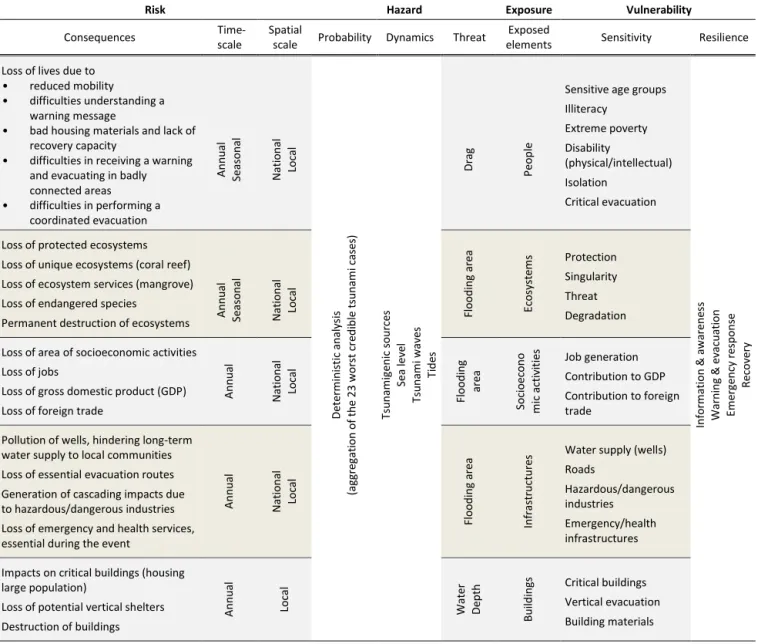
Table 1 shows the specific structure of the tsunami risk assessment applied to the coastal area of El Salvador, which is based on the pre-established expected consequences that are of interest to the Ministry of Environment and Natural Resources (MARN) of El Salvador; it is according to them that the vulnerability indicators (described in Sect. 2.3) are defined.
The spatial scale considers the national and local levels, the municipality being the planning unit. The national level includes the 29 coastal municipalities, while the local scale focuses on 3 specific areas that include 10 municipalities: the Western Coastal Plain (San Francisco Menéndez, Jujutla and Acajutla municipalities), La Libertad municipality and Jiquilisco Bay (Jiquilisco, Puerto El Triunfo, Usulután, San Dionisio, Jucuarán and Concepción Batres municipalities). As proposed by Turner et al. (2003), different factors shap-ing the risk at various spatio-temporal scales are considered, the population movements due to holiday patterns (rainy sea-son/dry season, week/weekend) in the human system and the migration patterns or breeding/nesting periods for the envi-ronmental system.
AGGREGATIONMETHOD: RISKMATRIX INFORMATIONFORTHEFORMULATIONOF RRM AGGREGATIONMETHOD: WEIGHTEDAGGREGATION
RISKDIMENSIONS
RISK MANAGEMENT (*) RISK ASSESSMENT (*)
RISK REDUCTION
MEASURES (RRM)
HAZARD EXPOSURE VULNERABILITY RISK
H
AZARDHuman
Environmental
Socioeconomic
Infrastructures
E
XPOSUREHuman
Environmental
Socioeconomic
Infrastructures
SENSITIVITY
V
ULNERABILITYHuman
Environmental
Socioeconomic
Infrastructures
R
ISKFLOODINGAREA
WAVE DEPTH
WAVE VELOCITY
DRAG
RESILIENCE
RRM
Human
Environmental
Socioeconomic
Infrastructures SENSITIVITY RESILIENCE
P
AR
TIA
L
RE
SU
LT
S
A
G
G
RE
G
A
TE
D
RE
SUL
T
S
REDUCING EXPOSURE
AND/OR SENSITIVITY
(*) For a specific spatial and time scale.
ENHANCING
RESILIENCE
IMPACTS
Figure 1.Structure of the risk assessment and different kind of results to be obtained (RRM = risk reduction measures).
threat analysis differs according to each dimension to better understand the potential impacts or due to the lack of de-tailed information and/or methods in the literature to assess the specific damage levels. As a result, in this case study drag is applied to the human dimension, water depth to buildings, and flooded area to the environmental, socioeconomic and infrastructural dimensions.
Accordingly, the national assessment focuses on the iden-tification of the most critical municipalities in terms of like-lihood of impacts for the worst credible event, which facil-itates their prioritisation regarding further detailed studies, risk management efforts and resources (Fletcher, 2005). The likelihood of impacts within this qualitative risk assessment derives from the vulnerability variability and uncertainties. The local assessment aims at the calculation of specific ex-pected impacts on the different dimensions by municipality. These worst-credible-event results allow the authorities or-ganising and managing the risk to provide the most protec-tive situation, so that the formulation of measures is on the side of safety and as conservative as possible in order to en-sure their validity for different scenarios. Some of the results obtained for the national level and the Western Coastal Plain are presented in this paper.
2.2 Tsunami hazard assessment
The hazard assessment is based on propagation models for earthquake-generated tsunamis, developed through the
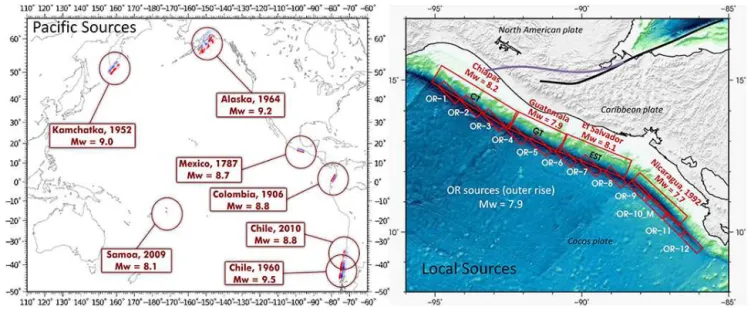
char-acterisation of tsunamigenic sources – seismotectonic faults – and other dynamics such as tsunami waves, sea level, etc. Simulations of historical and potential tsunamis with greater or lesser impacts on the country’s coast have been per-formed (Fig. 2), including distant sources (distances greater than 2000 km to the coast, with tsunami travel times greater than 4 h), regional sources (between 700 and 2000 km with tsunami travel times between 1 and 4 h), and local sources (located in the subduction trench off the country’s coast with tsunami travel times of less than 1 h).
Table 1.Structure of the Tsunami Risk Assessment applied to El Salvador coastal area.
Risk Hazard Exposure Vulnerability
Consequences Time -scale
Spatial
scale Probability Dynamics Threat
Exposed
elements Sensitivity Resilience
Loss of lives due to • reduced mobility • difficulties understanding a
warning message
• bad housing materials and lack of recovery capacity
• difficulties in receiving a warning and evacuating in badly connected areas • difficulties in performing a
coordinated evacuation A nn ua l S e as o na l N at io na l Lo cal D e te rm ini st ic a na ly si s (ag g re g at io n o f t he 23 wo rst c re di bl e t su na m i c as e s) T su na m ig e ni c s o ur ce s S e a le v e l T su na m i wav e s T ide s D rag P e o pl e
Sensitive age groups
Illiteracy Extreme poverty Disability (physical/intellectual) Isolation Critical evacuation Inf o rm at io n & a war e ne ss W ar ni ng & e v ac ua ti o n E m e rg e nc y r e sp o ns e R e co v e ry
Loss of protected ecosystems
Loss of unique ecosystems (coral reef)
Loss of ecosystem services (mangrove)
Loss of endangered species
Permanent destruction of ecosystems A
nn ua l S e as o na l N at io na l Lo cal F lo o di ng a re a E co sy st e m
s Protection
Singularity
Threat
Degradation
Loss of area of socioeconomic activities
Loss of jobs
Loss of gross domestic product (GDP) Loss of foreign trade
A nn ua l N at io na l Lo cal F lo o di ng ar e a S o ci o e co no m ic a ct iv it ie s Job generation
Contribution to GDP
Contribution to foreign
trade
Pollution of wells, hindering long-term water supply to local communities
Loss of essential evacuation routes
Generation of cascading impacts due to hazardous/dangerous industries
Loss of emergency and health services, essential during the event
A nn ua l N at io na l Lo cal F lo o di ng a re a Inf ras tr uc tur e
s Water supply (wells)
Roads
Hazardous/dangerous industries
Emergency/health infrastructures
Impacts on critical buildings (housing large population)
Loss of potential vertical shelters
Destruction of buildings
A nn ua l Lo cal W at e r D e pt h B ui ldi ng
s Critical buildings
Vertical evacuation
Building materials
866
elevation at every point on the grid, or temporal series of ve-locity and total depth at each point. In the case studied in this paper, 4 levels of nested grids have been used in order to ob-tain a cell size of 30 m on the coast of El Salvador. The run-up calculation at the areas where no local grids were available has been carried out using the Synolakis (1987) validated empirical formulations. Further information on this hazard assessment is provided by Álvarez-Gómez et al. (2013) and IH Cantabria-MARN (2010).
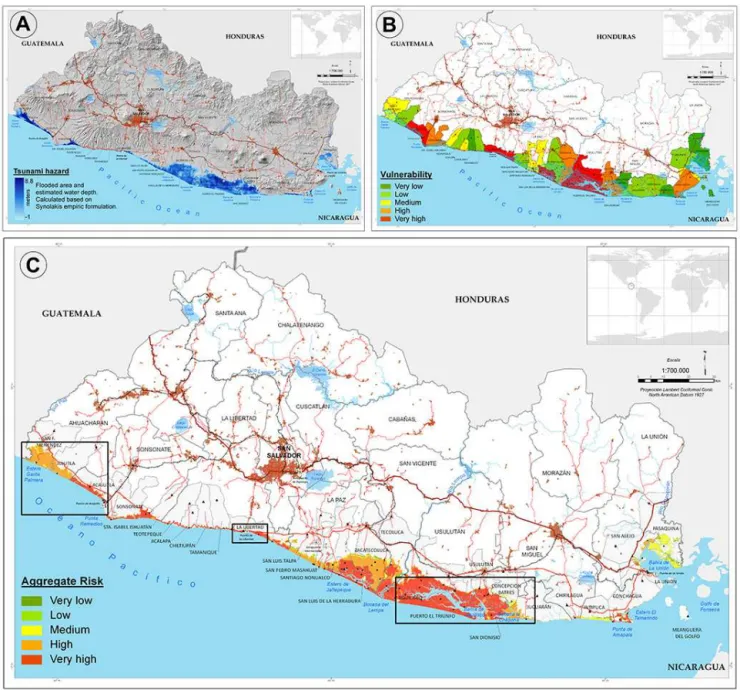
As mentioned above, a deterministic analysis which ag-gregates the 23 worst credible cases of tsunamis that could impact on the Salvadoran coast (see Fig. 2) has been car-ried out, with the main output being different hazard maps along the coast of El Salvador and at some relevant locations with high-resolution analysis. The generated hazard maps in-clude the following: maximum wave height elevation,
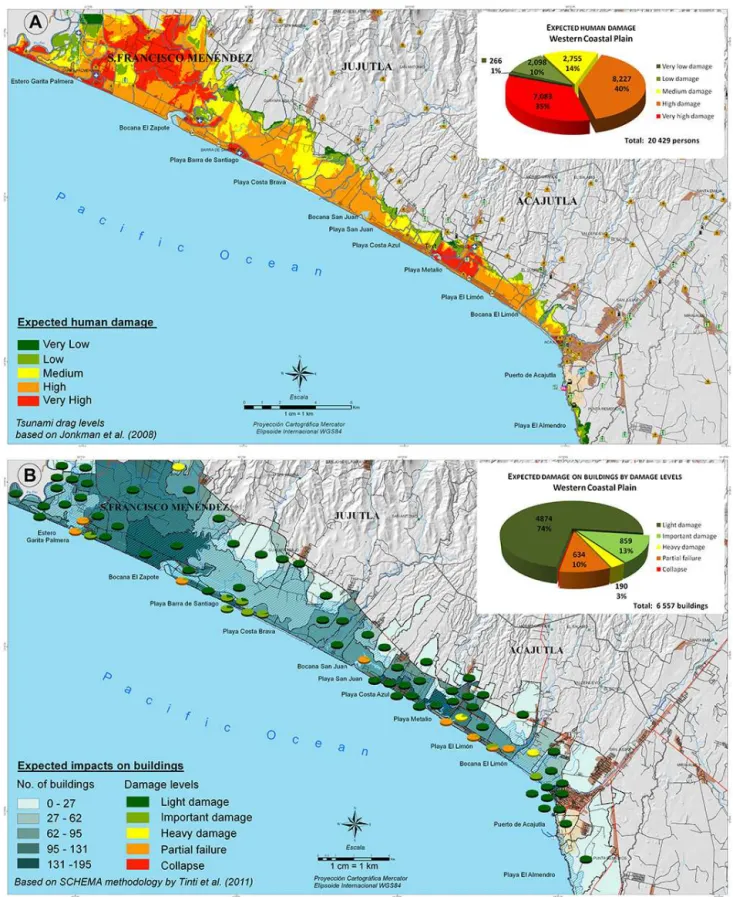
maxi-mum water depth, minimaxi-mum tsunami arrival time, maximaxi-mum flooding level or “run-up”, and maximum potential drag (un-derstood as the hazard degree for human instability based on incipient water velocity and depth). Fig. 5a shows one of the tsunami hazard maps generated at the national level, which allows for the identification of the areas subjected to higher tsunami water depths and consequently to a higher impact.
2.3 Tsunami vulnerability and risk assessment
Figure 2.Distant, regional and local tsunamigenic sources of historical and potential tsunamis that could impact on the Salvadoran coast have been aggregated for the deterministic hazard assessment.
susceptible to suffering the selected impacts. Thus, vulner-ability focuses on the expected impacts by municipality on the different dimensions and their potential worsening im-plications for the populations due to existing feedback loops (for example, the loss of household income due to loss of livelihood-related natural resources, the loss of recovery ca-pacity of the country due to the loss of area of specific so-cioeconomic activities, or the lack of long-term water re-sources for some coastal communities due to the affection of coastal wells, among others). This is the main justifica-tion for the mixed indicator approach presented below. A partial human analysis could seem enough for reducing life losses; however, understanding all the potential implications of a tsunami event in a specific area will help in promoting awareness and preparedness. On the other hand, this global understanding of the system has the disadvantage of some-times resulting in a superficial analysis of some of the im-pacts analysed.
Two different and complementary aspects for feedback loops existing in CHANS are perceived depending on the ref-erence to specific static assessments or to holistic and time-evolving management. As described by Cutter et al. (2008) for the antecedent conditions of resilience, the sensitivity as-sessment is carried out in this work for a specific moment, it can be seen as a snapshot in time or a statistic state, the re-sult being a precise value for each partial sensitivity (human, environmental, etc.) independently of the existing feedback loops within the system. Feedback loops are essential and are considered in this work as the only way to understand the behaviour of the system and to correctly manage it in terms of risk reduction, this being the reason for designing the set of indicators through the integrated approach.
2.3.1 Definition of exposure and vulnerability indicators
A set of indices and indicators are developed to calculate the exposure and sensitivity of the coastal dimensions as well as the resilience of the society and communities at risk. To carry this task out, several mathematical–statistical proce-dures are applied in order to produce comparable and com-binable information. A Geographic Information System al-lows supporting every decision with geo-referenced informa-tion, being an essential tool for the combination of partial maps related to each dimension and particularly useful for evacuation modelling and planning (González-Riancho et al., 2013). The following sections describe the set of indicators and the methodology used to integrate them.
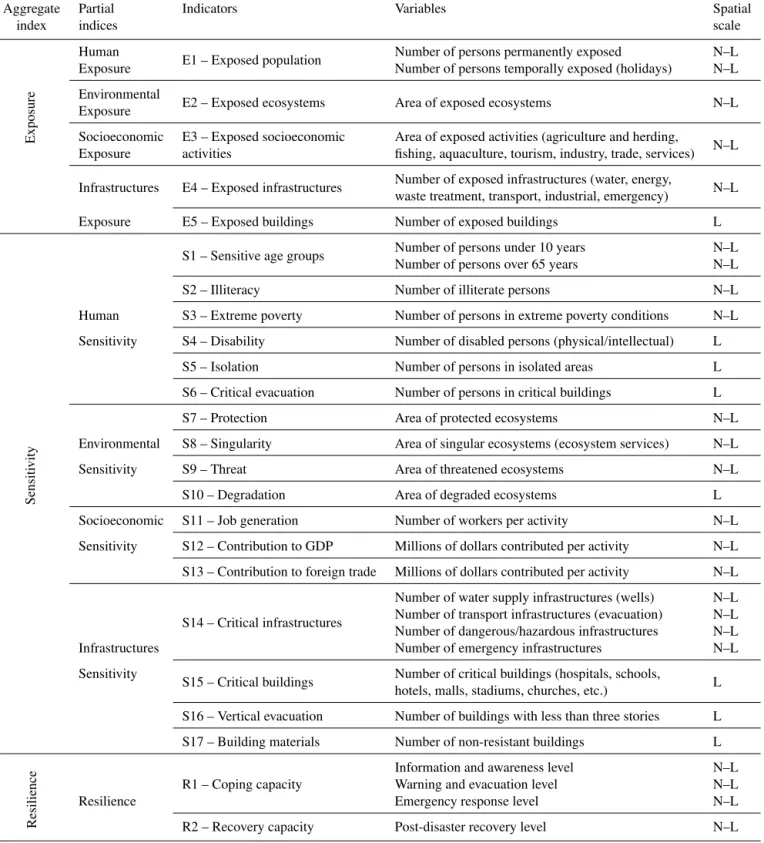
Based on the steps suggested by the Handbook on Con-structing Composite Indicators (OECD, 2008), the proposed set of indicators is presented in Table 2. This set is adapted to different spatiotemporal scales: the spatial scale includes both national and local levels, while the timescale considers the movements caused by holiday patterns in the human pop-ulation. It is important to point out the analytical soundness of all the indicators, the independence among them and the relevance of the measured phenomenon. The robustness, sen-sitivity and transparency of the indicator system allow man-aging the information at the index level as well as separat-ing them into the different indicators and workseparat-ing directly with the base data, which is essential for not losing infor-mation while aggregating results, and for the formulation of adequate risk reduction measures.
Table 2.Tsunami Exposure and Vulnerability indices and indicators (N = national scale, L = local scale, GDP = gross domestic product).
Aggregate Partial Indicators Variables Spatial
index indices scale
Exposure
Human E1 – Exposed population Number of persons permanently exposed N–L
Exposure Number of persons temporally exposed (holidays) N–L
Environmental E2 – Exposed ecosystems Area of exposed ecosystems N–L
Exposure
Socioeconomic E3 – Exposed socioeconomic Area of exposed activities (agriculture and herding, N–L Exposure activities fishing, aquaculture, tourism, industry, trade, services)
Infrastructures E4 – Exposed infrastructures Number of exposed infrastructures (water, energy,waste treatment, transport, industrial, emergency) N–L
Exposure E5 – Exposed buildings Number of exposed buildings L
S1 – Sensitive age groups Number of persons under 10 yearsNumber of persons over 65 years N–LN–L
S2 – Illiteracy Number of illiterate persons N–L
Human S3 – Extreme poverty Number of persons in extreme poverty conditions N–L
Sensitivity S4 – Disability Number of disabled persons (physical/intellectual) L
S5 – Isolation Number of persons in isolated areas L
S6 – Critical evacuation Number of persons in critical buildings L
Sensiti
vity
S7 – Protection Area of protected ecosystems N–L
Environmental S8 – Singularity Area of singular ecosystems (ecosystem services) N–L
Sensitivity S9 – Threat Area of threatened ecosystems N–L
S10 – Degradation Area of degraded ecosystems L
Socioeconomic S11 – Job generation Number of workers per activity N–L
Sensitivity S12 – Contribution to GDP Millions of dollars contributed per activity N–L S13 – Contribution to foreign trade Millions of dollars contributed per activity N–L
S14 – Critical infrastructures
Number of water supply infrastructures (wells) N–L Number of transport infrastructures (evacuation) N–L Number of dangerous/hazardous infrastructures N–L
Infrastructures Number of emergency infrastructures N–L
Sensitivity S15 – Critical buildings Number of critical buildings (hospitals, schools, L hotels, malls, stadiums, churches, etc.)
S16 – Vertical evacuation Number of buildings with less than three stories L
S17 – Building materials Number of non-resistant buildings L
Resilience
Information and awareness level N–L
R1 – Coping capacity Warning and evacuation level N–L
Resilience Emergency response level N–L
R2 – Recovery capacity Post-disaster recovery level N–L
(S1, S2, S4-intellectual disability), problems with mobility and reduced evacuation speed (S1, S4-physical disability), difficulties with evacuation related to the built environment and coordinated evacuations (S6), difficulties with receiv-ing a warnreceiv-ing message and reachreceiv-ing the safe area before the
tsunami arrives (S5); and the difficulties in recovering after a disaster (S3) are analysed.
livelihood-related ecosystem services. Thus, the loss of rel-evant ecosystems (S7, S8, S9), the potential permanent de-struction of ecosystems (S10), and the loss of livelihood-related ecosystem services, such as coral reefs and man-groves (S8) is assessed. The potential capacity of manman-groves to mitigate the hazard is included in this work through the hazard assessment, as a higher roughness coefficient was as-signed to mangrove areas.
The socioeconomic sensitivity indicators (S11–S13) are oriented to measure the potential social and economic im-pacts by municipality in terms of loss of income at the house-hold level and economic losses for the country, respectively. The social impacts (S11) are calculated through the number of jobs that would be lost per socioeconomic activity, while the economic impacts (S12, S13) are expressed in millions of dollars lost per socioeconomic activity in case of having a percentage of its area affected.
The infrastructures sensitivity indicators (S14–S17) mea-sure the number of critical infrastructures and buildings that would be affected by municipality and the subsequent impli-cations for the population, the term critical applied to those elements that if affected would worsen the situation both during and after the event. Accordingly, S14 calculates the potential number of polluted wells hindering long-term wa-ter supply to local communities, loss of essential evacua-tion routes, generaevacua-tion of cascading impacts due to affected hazardous/dangerous industries, and loss of emergency and health services which are essential during the event. S15 pro-vides the number of buildings that would require a coor-dinated and previously planned evacuation due to the high number of people (in some cases sensitive population) in them, such as hospitals, schools, clinics for elderly people, malls, stadiums, churches, hotels, etc. S16 and S17 measure the number of buildings not able to provide shelter for the population, due to the number of floors or to the weak ma-terials. S17 permits the calculation of the buildings damage level according to the materials and the water depth (based on SCHEMA methodology by Tinti et al., 2011). The damage level of the specific infrastructures (water, energy, industrial, transport, emergency) is not included in this study.
The Pearson correlation coefficient was calculated to se-lect the indicators. Most of the indicators had low correlation except extreme poverty & illiteracy (r=0.92),
environmen-tal threat & protection (r=0.68), and GDP contribution &
job generation (r=0.90). These relationships between
vari-ables were carefully evaluated to consider the removal of some of them; however, their analytical relevance and differ-entiation prevailed to the correlation result, as agreed by the assistants in a participatory workshop and for the sake of bet-ter refined risk reduction measures. In this sense, (i) poverty gives information about areas which would struggle more af-ter the event due to the lack of financial resources to recover, while illiteracy provides information about the ability to un-derstand a warning message during the event; (ii) maintain-ing both threat and protection indicators permitted the
identi-fication of areas where unprotected endangered species were located and formulate specific measures for these areas; (iii) maintaining both GDP contribution and job generation per-mitted a clear differentiation between social and economic impacts of the event to understand the medium to long-term effects of the tsunami. Weights have been carefully assigned to these indicators to correct the doubling effects when ag-gregating.
Data collection for exposure and sensitivity indicators is based on the best available information for the human1,
envi-ronmental2, socioeconomic3and infrastructural4dimensions in El Salvador. Besides this, field work was carried out to pro-duce the information that was not officially available or that was incomplete, such as the one regarding isolated commu-nities (with the help of local authorities and Civil Protection local departments), critical buildings, building materials and vertical evacuation.
The consideration of factors shaping risk at various scales (as proposed by Turner et al., 2003) is considered in this pa-per through the variable “Number of pa-persons exposed tem-porarily (holidays)” within the human exposure indicator, which permitted the comparison of specific areas at different times of the year (spatio-temporal variability) and showing higher exposure and vulnerability values in holiday periods. This effect in specific hotspots is explained by holiday move-ments of foreigners to very specific sites and associated for example with surf promotion campaigns developed at the na-tional level. These overcrowded places are likely to be higher risk areas in holiday periods. Other factors that could be con-sidered are the planned coastal development for the coming years in exposed areas, or national initiatives (like the one resulting in this paper) which are aimed at reducing the vul-nerability of communities at the local level. Further research work is needed in order to properly include these types of factors within risk assessments.
An additional explanation is provided for the resilience as-sessment. The resilience of a community with respect to po-tential hazard events is determined by the degree to which the community has the necessary resources and is capable of absorbing disturbance and reorganising into a fully func-tioning system (Cutter et al., 2008). This is understood as the capacity of a community to organise itself before, dur-ing and after the event in order to minimise the impacts. Thus, two of society’s capacities are analysed to evaluate the
1Censo de Población 2007, Encuesta de Hogares de
Propósi-tos Múltiples 2011 (Dirección General de Estadística y Censos DI-GESTYC), Ministerio de Turismo MITUR
2Ministerio de Medio Ambiente y Recursos Naturales MARN 3DIGESTYC 2007, Banco Central de Reserva BCR
4Asociación Nacional de Acueductos y Alcantarillados ANDA,
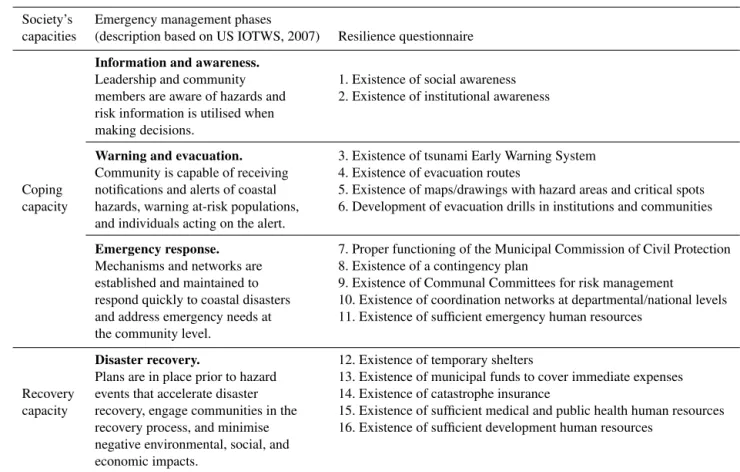
resilience: coping capacity, as the ability of people, organi-sations and systems, using available skills and resources, to face and manage adverse conditions, emergencies or disas-ters (UN/ISDR, 2009) before and during the event; and re-covery capacity, as the ability of the system to recover af-ter a disasaf-ter. These two indicators are assessed through the analysis of the four phases of emergency management: infor-mation and awareness, warning and evacuation, emergency response, and disaster recovery.
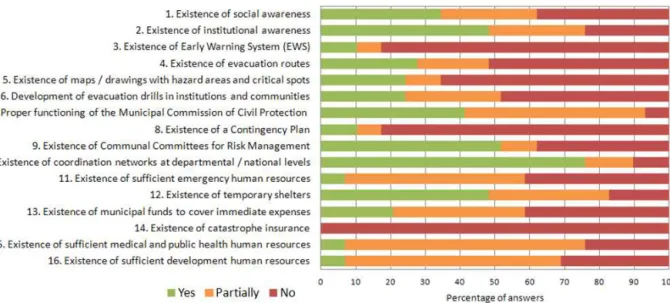
Due to the lack of thematic and geographically homoge-neous data regarding resilience, data collection for the con-struction of the resilience index has been carried out through a short questionnaire which identifies the degree of organi-sation and response within a community in case of an emer-gency. The type of questionnaire applied is based on the as-sessment of the level of implementation of Integrated Coastal Zone Management (ICZM) in Europe, proposed by Pick-aver et al. (2004) and carried out through a questionnaire with three possible answers (yes/no/no answer) against each ICZM action and for three spatial levels to identify the main existing gaps in ICZM implementation and a trend through time. Using appropriate questionnaires for the resilience as-sessment solves the commonly faced problem regarding the limits of measurability and the collection of quantitative data to be analysed together with the sensitivity data. Table 3 shows the relation between the elements of resilience, the phases of emergency management and the questionnaire.
The resilience questionnaire offers three response al-ternatives, yes/no/partially, together with space for fuller comments, and has been filled in by 34 stakeholders. Al-though the statistical sample could be considered small, the coherence of the assessment is ensured at the national level through the answers of those responsible for emer-gency management in every coastal municipality (Munic-ipal Civil Protection Committees). Additional stakeholders were interviewed for the local studies, such as some non-governmental organisations, companies and business asso-ciations, and community leaders; in case of contradictory answers (“yes/no”) the intermediate value (“partially”) has been finally assigned, the incoherence between authorities’ and society’s perception about the preparedness of the mu-nicipality being automatically identified as a critical issue for resilience enhancement measures.
The complexity of having the resilience as a component inversely proportional to risk (a higher resilience reduces the risk) in a multidisciplinary study, which combines different risk components, dimensions and timescales and therefore indicators from various disciplines, sources and units, high-lights the need to translate this factor into a directly pro-portional one. Therefore, the authors propose the use of a new component named “lack of resilience”, as applied by the MOVE framework (Birkmann et al., 2013). Consequently, the indicators coping capacity and recovery capacity will analyse the lack of resilience and focus on the negative re-sponses of the questionnaire. The aggregation of each type
of answer multiplied by its coefficient and divided by the to-tal number of questions providing the value of the lack of resilience index, the coefficients being 0, 1 and 0.5 for pos-itive, negative and intermediate answers, respectively. This is necessary for aggregation purposes (i.e. aggregating sen-sitivity and resilience to build the vulnerability); however, to analyse the resilience itself, the lack of resilience is trans-lated again into the resilience concept through the expression Resilience = 1−Lack of resilience.
2.3.2 Integration of risk concepts
The method for the integration of risk concepts included in the process from the exposure and vulnerability data collec-tion and processing up to the risk assessment is explained in the next paragraphs. This method has several steps: (i) build-ing indicators through normalizations; (ii) buildbuild-ing partial and aggregated indices through weighted aggregation, (iii) index classification via the natural breaks method; and (iv) risk assessment using the risk matrix.
Based on OECD (2008), in order to correct the imbalance caused by the different variable units, thus allowing for their comparison and combination, the transformation of the vari-ables range of values is carried out through the minimum– maximum (Min–Max) method, which normalises the indi-cators so as to obtain an identical range [0,1]. A weighted aggregation is applied to them in order to build the partial (for each dimension) and aggregated indices. Weights are assigned in this work using participatory methods: a work-shop has allowed the authors to collect the opinions of dif-ferent experts, with the participation of 10 technicians from theMARN(Ministry of Environment and Natural Resources,
El Salvador) and the team fromIH Cantabria
(Environmen-tal Hydraulics Institute, Spain), in order to reflect political and social priorities, technical factors related to the tsunami hazard and the reliability of the data used.
Table 3.Resilience assessment: society’s capacities, related emergency phases and questionnaire applied.
Society’s Emergency management phases
capacities (description based on US IOTWS, 2007) Resilience questionnaire
Information and awareness.
Leadership and community 1. Existence of social awareness members are aware of hazards and 2. Existence of institutional awareness risk information is utilised when
making decisions.
Warning and evacuation. 3. Existence of tsunami Early Warning System Community is capable of receiving 4. Existence of evacuation routes
Coping notifications and alerts of coastal 5. Existence of maps/drawings with hazard areas and critical spots capacity hazards, warning at-risk populations, 6. Development of evacuation drills in institutions and communities
and individuals acting on the alert.
Emergency response. 7. Proper functioning of the Municipal Commission of Civil Protection Mechanisms and networks are 8. Existence of a contingency plan
established and maintained to 9. Existence of Communal Committees for risk management
respond quickly to coastal disasters 10. Existence of coordination networks at departmental/national levels and address emergency needs at 11. Existence of sufficient emergency human resources
the community level.
Disaster recovery. 12. Existence of temporary shelters
Plans are in place prior to hazard 13. Existence of municipal funds to cover immediate expenses Recovery events that accelerate disaster 14. Existence of catastrophe insurance
capacity recovery, engage communities in the 15. Existence of sufficient medical and public health human resources recovery process, and minimise 16. Existence of sufficient development human resources
negative environmental, social, and economic impacts.
As conducted by Greiving et al. (2006) and Jelínek et al. (2009), the risk is calculated through a risk matrix by combining the classes obtained for the hazard and the vulner-ability indices, or hazard and sensitivity indices in the case of partial results. The sensitivity and vulnerability are calcu-lated on the exposed elements; therefore, the exposure is im-plicitly incorporated into the matrix. Once the municipalities with higher risk values are identified, in other words those which are expected to have serious negative consequences due to the combination of the hazard scenario modelled and the vulnerability conditions, the calculation of the specific expected impacts at the local level is carried out. The differ-ent methods applied to the Western Coastal Plain of El Sal-vador are described in Sect. 2.3.3 together with the obtained results.
2.3.3 Results and discussion
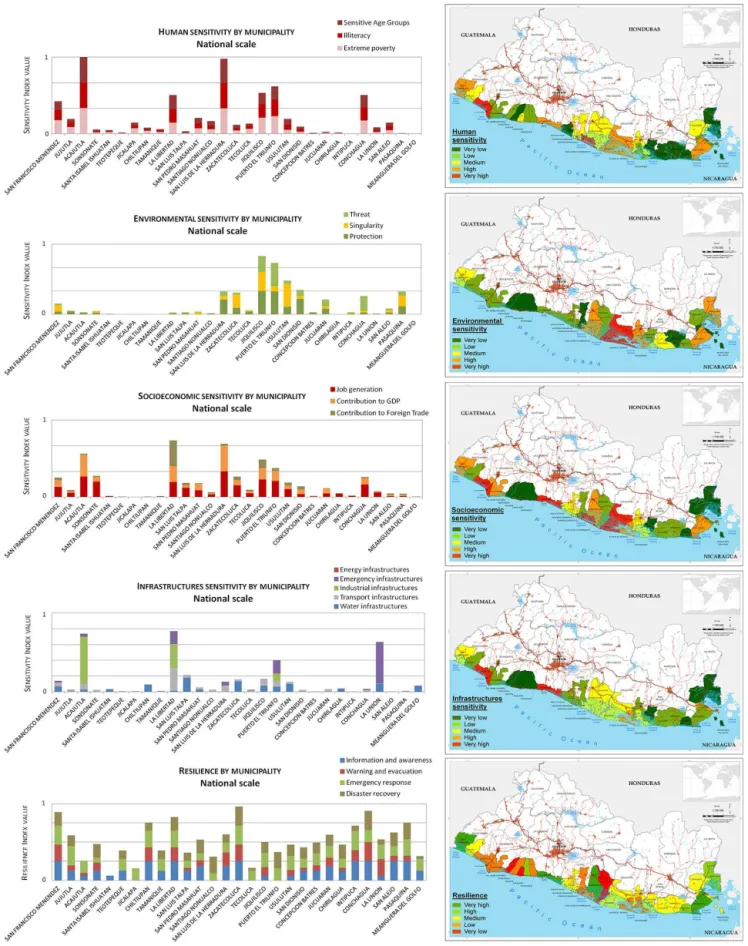
The vulnerability results for the coastal area of El Salvador are analysed and mapped in Fig. 3. The municipalities are or-ganised geographically within the graphs, thereby facilitating the comparison of numerical and cartographic results.
The sensitivity index numerical and cartographic results explain how sensitive the exposed municipalities are regard-ing the different dimensions. The sensitivity is represented through the graph columns and the colour code on the maps.
The identification of the causes that make each municipal-ity more or less susceptible to the hazard is based on the sensitivity indicators, with the different colours within the columns representing the contribution of the different indi-cators to their index. For example, one can differentiate the reasons why two municipalities have similar socioeconomic sensitivity, identifying whether it is due to the potential loss of contribution to foreign trade or GDP. The results obtained will feed the risk reduction measures for each dimension.
Figure 4.Resilience questionnaire results for tsunami hazard on the coastal area of El Salvador.
terms of, for instance, the number of temporary shelters or doctors by population density and municipality.
The importance of each indicator or variable and the crit-ical role of some of them within the assessment have been considered through the weighted aggregation. Accordingly, in the case of resilience, coping capacity is weighted more than the recovery capacity due to the prioritisation of sav-ing lives, and resilience is weighted less than sensitivity due to the use of more subjective information. The workshop made evident the difficulties in weighting the different re-silience variables: the first impulse for almost everyone was to give higher weights to early warning system and evacu-ation routes; however, a lack of social awareness regarding evacuation (question 1) or a communication and coordination malfunction between the different warning responsible levels (questions 7, 9, 10) could turn a tsunami warning ineffective. Regarding social awareness in the case of a local tsunami, a community informed and trained about the tsunami haz-ard would start evacuating just after feeling the earthquake, which could save valuable time before the warning is issued and, hopefully, lives.
The aggregated result (sensitivity or resilience) per se should not be understood as the final aim of the work, but the generation of information for the formulation of risk re-duction measures; i.e. the assessments allow the identifica-tion of site-specific topics that should be managed before a tsunami event happens. In other words, and as an exam-ple, the resilience assessment identifies in which municipal-ities one should work on designing evacuation routes and in which ones the focus should be on social awareness or an early warning system. Similarly, the sensitivity results iden-tify in which municipalities specific attention must be paid regarding the evacuation of critical buildings such as schools,
hospitals, etc., where an alternative water supply for coastal communities with potential polluted wells must be planned, or where specific information and training campaigns must be designed for isolated areas or municipalities with a large amount of people with difficulties understanding a warning message.
The national risk assessment (Fig. 5c), obtained from the combination of hazard and vulnerability results (Fig. 5a and b, respectively), allowed for the identification of the critical areas in which a more detailed analysis is needed. The spe-cific expected impacts have been calculated for the three lo-cal areas framed by black squares in the figure, with some of the results for the Western Coastal Plain being presented next. The calculation of the extent of the negative conse-quences (damage levels) varies according to the available methodologies in literature and information, not being de-fined for every dimension or exposed element in a homoge-neous way. The specific results, which differ in format and scope, cover the different dimensions as well, providing es-sential knowledge for risk management and the formulation of adequate risk reduction measures.
Figure 5.National tsunami risk assessment in El Salvador:(a)hazard assessment: flooded area and water depth results;(b)vulnerability as-sessment by municipality including the human, environmental, socioeconomic and infrastructural dimensions;(c)risk assessment combining hazard and vulnerability results via the risk matrix (the areas framed by black squares show the local studies carried out; from left to right: Western Coastal Plain, La Libertad municipality and Jiquilisco Bay).
management options can be applied. Knowing the evacua-tion speed of the populaevacua-tion, which can depend on the age, disabilities, etc., will allow modelling the evacuation in order to identify critical areas where people would not be able to reach a shelter before the tsunami reaches the coast. Know-ing where the sensitive population in terms of evacuation is located facilitates planning alternative measures for them.
Figure 6b shows the number of buildings exposed to the tsunami event by census segment (blue colour code) and the expected impacts on buildings (pie charts) calculated through the adaptation of the SCHEMA methodology to El Salvador
based on water depth and building materials (Tinti et al., 2011). In total, 6557 buildings are exposed in the Western Coastal Plain, 26 % of them being included among the im-portant damage and partial failure classes.
0 10 20 30 40 50 60 SAN FRANCISCO MENENDEZ JUJUTLA ACAJUTLA A re a ( k m 2)
LOSS OF AREA BY SOCIOECONOMIC ACTIVITY
Western Coastal Plain
Public and private services Industry and mining Construction Tourism Trade Aquaculture Agriculture 0 500 1.000 1.500 2.000 2.500 3.000 3.500 4.000 SAN FRANCISCO MENENDEZ JUJUTLA ACAJUTLA N u m b e r o f w o rk e rs
LOSS OF JOBS BY SOCIOECONOMIC ACTIVITY
Western Coastal Plain
Public and private services Industry and mining Construction Tourism Trade Aquaculture Agriculture 0 5 10 15 20 25 30 35 SAN FRANCISCO MENENDEZ JUJUTLA ACAJUTLA M il li o n s o f d o la rs
LOSS OFGDP CONTRIBUTION BY SOCIOECONOMIC ACTIVITY
Western Coastal Plain
Public and private services Industry and mining Construction Tourism Trade Aquaculture Agriculture 0 1 2 3 4 5 SAN FRANCISCO MENENDEZ JUJUTLA ACAJUTLA M il li o n s o f d o ll a rs
LOSS OF FOREIGN TRADE CONTRIBUTION BY SOCIOECONOMIC ACTIVITY
Western Coastal Plain
Public and private services Industry and mining Construction Tourism Trade Aquaculture Agriculture
A. EXPECTED IMPACTS ON SOCIOECONOMIC ACTIVITIES
0 2 4 6 8 10 12 SAN FRANCISCO MENENDEZ JUJUTLA ACAJUTLA N u m b e r o f in fr a st ru ct u re s
POTENTIAL INDUSTRIAL CASCADING RISK EFFECTS
Western Coastal Plain
Infrastructures municipality Exposed infrastructures 0 1 2 3 4 5 6 SAN FRANCISCO MENENDEZ JUJUTLA ACAJUTLA N u m b e r o f in fr a st ru ct u re s
POTENTIAL INDUSTRIAL CASCADING RISK EFFECTS
Western Coastal Plain
Petrochemical Chemical Cement
Iron, steel, metallurgy Food and drinks Textile and clothing Paper Storage Industrial parks 0 1 2 3 4 5 SAN FRANCISCO MENENDEZ JUJUTLA ACAJUTLA N u m b e r o f in fr a st ru ct u re s
LOSS OF OPERABILITY OF EMERGENCY TEAMS
Western Coastal Plain
Infrastructures municipality Exposed infrastructures 0 1 2 3 4 5 SAN FRANCISCO MENENDEZ JUJUTLA ACAJUTLA N u m b e r o f in fr a st ru ct u re s
LOSS OF OPERABILITY OF EMERGENCY TEAMS
Western Coastal Plain
Health Center Hospital Military Civil Protection Firemen station 0 2 4 6 8 10 12 SAN FRANCISCO MENENDEZ JUJUTLA ACAJUTLA N u m b e r o f w e ll s
LOSS OF LONG-TERM WATER SUPPLY(WELLS) Western Coastal Plain
Infrastructures municipality Exposed infrastructures 0 200 400 600 800 1000 1200 SAN FRANCISCO MENENDEZ JUJUTLA ACAJUTLA N u m b e r o f ro a d s e g m e n ts
LOSS OF OPERABILITY OF EVACUATION ROADS
Western Coastal Plain
Infrastructures municipality
Exposed infrastructures
B. EXPECTED IMPACTS ON INFRASTRUCTURES
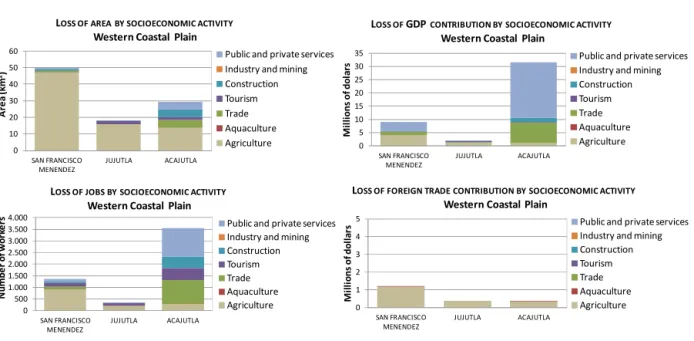
Figure 7. Expected impacts in the Western Coastal Plain of El Salvador: (a)impacts on socioeconomic activities, and (b) impacts on infrastructures.
is mainly agricultural land in the three municipalities; this implies practically the entire expected loss of contribution to foreign trade. The other smaller exposed socioeconomic area is dedicated to tourism, trade, construction and services, mainly in urban areas, and especially in Acajutla municipal-ity. This small multi-activity area would imply the biggest impacts in terms of loss of jobs and loss of contribution to GDP.
DRM
Exposure assessmentVulnerability assessment
Consequences prediction
Management targets: exposed elements
Management targets: vulnerable elements
Specific objectives: reducing the consequences
General objectives: reducing the risk
Hazard assessment Hazard knowledge
RISK ASSESSMENT RISK MANAGEMENT
Risk assessment
Figure 8.Left: translating vulnerability and risk results into a management framework. Right: disaster risk management (DRM) dartboard framework.
present in the study area, which probably will not be able to help the population in case of a tsunami event.
3 Tsunami risk management: application to El Salvador
Scientific risk assessment studies are frequently charac-terised by a linear structure that goes from the hazard and vulnerability assessments to the final risk calculation, very few of them providing specific risk reduction options. This linear structure and the lack of a clear and straightforward link with the disaster risk management (DRM) may gener-ate a lack of connection between the authorities’ decision-making and the technical results obtained from the risk as-sessment. This section focuses on how to enhance the value of the gathered knowledge to translate the results into some-thing closer to the management options the decision-maker needs. Figure 8 shows how the risk assessment process can directly feed the various steps within the risk management process. Once the connection between both processes is iden-tified, the structures of the studies are reoriented in order to have the DRM as the main goal to achieve. The scheme on the right, in a dartboard shape, shows that the closer a study arrives to the centre of the dartboard, the more useful it be-comes for the managers.
Based on the results of the national and local risk assess-ment carried out for El Salvador and the main expected im-pacts due to the modelled tsunami event, different adaptation and mitigation measures can be proposed. It is here under-stood that mitigation measures aim to reduce the hazard’s effect on the coastal system, while adaptation measures basi-cally aim to reduce the vulnerability by reducing the sensitiv-ity or enhancing the resilience-identified shortcomings. The
overlap of mitigation and adaptation measures on the expo-sure component is due to territorial and time factors – i.e. a risk reduction measure aimed at reducing the exposure will be a mitigation measure if it intends to change the location of existing elements, but can be considered an adaptation mea-sure if it intends to plan the future location of elements so as to limit as much as possible their presence in the area.
DRM must be site-specific and needs to be detailed and individually applied to the different study areas. Fig. 9 shows an example of general planning structure based on some of the results presented. The main goal is the DRM in the cen-tre of the figure, and to achieve it different tasks are needed: (i) knowledge acquisition about the hazard; (ii) identifica-tion and locaidentifica-tion of the exposed elements of that hazard to be considered; (iii) from the exposed ones, analysis of the vulnerable elements as management targets; (iv) formulation of DRM-specific objectives to reduce the expected negative consequences on each dimension; and (v) DRM general ob-jectives to guide the management of the study area. Focusing for example on the human dimension in Fig. 9, the general objective is reducing human risk by ensuring effective evac-uation, this can be achieved by minimising the population evacuation and reaction time. Table 4 shows the translation of the tsunami risk results obtained in Acajutla municipality into risk reduction measures by following the steps suggested in Fig. 8. According to this approach, specific risk reduction measures are proposed to address each of the identified im-pacts in every dimension. However, it is normally politically and economically difficult for a country to implement them all, a prioritisation of measures being required.
ENSURE EFFECTIVE EVACUATION
PROMOTE SAFE ECONOMY ENSURE
ECOLOGICAL INTEGRITY ENSURE
INFRASTRUCTURES OPERABILITY
INCREASE COMMUNITY
RESILIENCE
Reducing evacuation
time
Reducing reaction time
Ensuring ecological services Ensuring
ecological integrity
Protecting household economy
Protecting national economy Ensuring
essential infrastr. operability Reducing
risk cascades
Increasing Coping Capacity Increasing
Recovery Capacity
Sensitive Age Groups
Disability Illiteracy
Isolation
Critical buildings
Poverty Local Livelihoods
Job generation Contribution
to GDP Contribution
to Foreign Trade Scarce
ecosystems Threatened
ecosystems Basic needs
Evacuation roads Emergency
Dangerous - hazardous
Information and awareness Alert and
evacuation Emergency
response Disaster recovery
DRM
HAZARDDegraded ecosystems
DRM General Objectives DRM Specific Objectives
Management Targets: vulnerable elements Management Targets: exposed elements Hazard knowledge
Critical buildings
Non-resistant buildings
Figure 9.Example of risk management framework for tsunami hazard in El Salvador.
governance, resilience, emergency protocols, early warning systems, etc. This information must be properly prioritised in order to optimise the management process, select the most urgent and relevant issues to solve and once the first objec-tives have been fulfilled, address the next ones. Therefore, af-ter the definition of the risk management structure, the next task would be identifying the key factors affecting or con-trolling the system (i.e. leverage points) as they can be used to bring about major changes in the system with minimum effort (Martín García, 2006), the system dynamics being a potential tool to achieve this objective (Sterman, 2002, 2006; Meadows, 2008).
Figure 10a shows the system dynamics modelled for the analysis of tsunami impacts in Acajutla based on the partici-patory contribution of the various technicians from MARN and IH Cantabria. The impact of a tsunami event on the exposed and vulnerable elements (capital letters and blue font text, respectively) produce different cause-effect rela-tionships and feedback loops (arrows) within the system gen-erating the various negative consequences under study (text in boxes). These causal relationships show some kind of rel-evance roles and priorities between the elements in terms of management, which means that by working on some of them,
results can be obtained on the others. The feedback loops be-tween the final consequences highlight those that can worsen other impacts in the same or other dimensions and that, con-sequently, should be tackled first. For example, the genera-tion of risk-cascading effects and the loss of infrastructures’ operability generate human casualties and environmental im-pacts; analogously, the loss of ecological integrity reduces the capability of generating ecological services, which af-fects the socioeconomic dimension.
Table 4.Translation of human risk results into DRM options (Acajutla, Western Coastal Plain, El Salvador). Further information provided by González-Riancho et al. (2013).
Salvador). Further information provided by González-Riancho et al. (2013) 877
DRM phases and related risk assessment results
Risk management options
A. Hazard knowledge.
Flooded area, water depth (up to 4
that were originally planned. The orange arrows represent the flows set in motion due to the risk reduction measure, while the yellow boxes show the consequences that are affected or improved somehow by these flows.
This example aims to show that one single action may have many results in complex systems, which is an inter-esting idea to bring forward in risk management. Working with complex systems is complicated, as many aspects, di-mensions and variables should be considered and dealt with. However, once the system is understood, one can take advan-tage of this complexity to generate better results with less ef-fort. Therefore, the understanding of complex systems allows for optimising the effort and getting the best results from the management options applied.
Working with scenarios provides the opportunity to un-derstand the current system, predict the consequences of dif-ferent plausible management options and, consequently, pro-mote an adequate risk reduction plan for the studied area. It
can be therefore a dynamic assessment of policy options and their response to existing feedback loops.
4 Conclusions
Advances in the understanding and prediction of tsunami im-pacts allow for the development of risk reduction strategies for tsunami-prone areas. Based on existing vulnerability and risk frameworks and approaches, the main expected contri-bution is to provide a straightforward method to facilitate their implementation. The method deals with the complex-ity and variabilcomplex-ity of CHANS by means of an integral ap-proach to cover the entire process from the risk assessment to the risk management; an integrated approach to combine and aggregate the information stemming from the different dimensions; and a dynamic and scale-dependent approach to integrate the spatiotemporal variability considerations.
S e n s i t i v e A g e
G r o u p s D i s a b i l i t y I l l i t e r a c y I s o l a t i o n P e o p l e i n c r i t i c a l b u i l d i n g s
P o v e r t y
L o s s o f l o c a l l i v e l i h o o d s
L o s s o f j o b s
L e s s c o n t r i b u t i o n t o G D P
L e s s c o n t r i b u t i o n t o F o r e i g n T r a d e
S c a r c e e c o s y s t e m s
T h r e a t e n e d e c o s y s t e m s D e g r a d e d
e c o s y s t e m s B a s i c n e e d s w i l l n o t b e
f u l f i l l e d a f t e r t h e e v e n t
L o s s o f e v a c u a t i o n
r o a d s
C r i t i c a l
b u i l d i n g s N o n - r e s i s t a n t b u i l d i n g s
L o n g e v a c u a t i o n t i m e L o n g r e a c t i o n t i m e
L o w r e c o v e r y c a p a c i t y
R e d u c t i o n i n h o u s e h o l d s e c o n o m y
R e d u c t i o n i n n a t i o n a l e c o n o m y
L o s s o f e c o l o g i c a l
s e r v i c e s L o s s o f
e c o l o g i c a l i n t e g r i t y G e n e r a t i o n o f
r i s k - c a s c a d e s
L o s s o f i n f r a s t r u c t u r e s
o p e r a b i l i t y
L o s s o f b u i l d i n g s o p e r a b i l i t y V u l n e r a b l e e l e m e n t s
E X P O S E D S O C I O E C O N O M I C
A C T I V I T I E S A c t i v i t i e s w i t h h i g h s o c i a l c o n t r i b u t i o n
A c t i v i t i e s w i t h h i g h e c o n o m i c c o n t r i b u t i o n
E X P O S E D E C O S Y S T E M S E X P O S E D
I N F R A S T R U C T U R E S
E X P O S E D P E O P L E
L o w s p e e d N o t u n d e r s t a n d i n ga l e r t m e e s a g e
O r g a n i z a t i o n p r o b l e m s L o n g w a r n i n g t i m e a n d
b a d c o m m u n i c a t i o n s
B a s i c n e e d s i n f r a s t r u c t u r e s
R o a d s E m e r g e n c y i n f r a s t r u c t u r e s
H u m a n i t a r i a n c r i s i s E m e r g e n c y t e a m s a n d
i n f r s t r u c t u r e s w i l l n o t b e a v a i l a b l e d u r i n g t h e e v e n t
D a n g e r o u s - h a z a r d o u s i n f r a s t r u c t u r e s
B u i l d i n g w i t h l e s s t h a n 3 f l o o r s A g r e a t n u m b e r o f v u l n e r a b l e p e o p l e
a f f e c t e d E X P O S E D E L E M E N T S
H u m a n c a s u a l t i e s C a u s a l r e l a t i o n s h i p s
C a u s a l c o m p o n e n t s
L E G E N D
L E G E N DL E G E N D
L E G E N D
.
C o n s e q u e n c e s / i m p a c t s
L o n g - t e r m s o c i a l d i s r u p t i o n
A. SYSTEM DYNAMICS FOR THE ANALYSIS OF TSUNAMI IMPACTS
B. CAUSAL RELATIONSHIPS AFFECTED BY POTENTIAL RISK REDUCTION MESURES
S e n s i t i v e A g e
G r o u p s D i s a b i l i t y I l l i t e r a c y I s o l a t i o n P e o p l e i n c r i t i c a l b u i l d i n g s
P o v e r t y
L o s s o f l o c a l l i v e l i h o o d s
L o s s o f j o b s
L e s s c o n t r i b u t i o n t o G D P
L e s s c o n t r i b u t i o n t o F o r e i g n T r a d e
S c a r c e e c o s y s t e m s
T h r e a t e n e d e c o s y s t e m s D e g r a d e d
e c o s y s t e m s B a s i c n e e d s w i l l n o t b e
f u l f i l l e d a f t e r t h e e v e n t L o s s o f e v a c u a t i o n
r o a d s
C r i t i c a l
b u i l d i n g s N o n - r e s i s t a n t b u i l d i n g s
L o n g e v a c u a t i o n t i m e L o n g r e a c t i o n t i m e
L o w r e c o v e r y c a p a c i t y
R e d u c t i o n i n h o u s e h o l d s e c o n o m y
R e d u c t i o n i n n a t i o n a l e c o n o m y
L o s s o f e c o l o g i c a l
s e r v i c e s L o s s o f
e c o l o g i c a l i n t e g r i t y G e n e r a t i o n o f
r i s k - c a s c a d e s
L o s s o f i n f r a s t r u c t u r e s
o p e r a b i l i t y
L o s s o f b u i l d i n g s o p e r a b i l i t y V u l n e r a b l e e l e m e n t s
E X P O S E D S O C I O E C O N O M I C
A C T I V I T I E S A c t i v i t i e s w i t h h i g h s o c i a l c o n t r i b u t i o n
A c t i v i t i e s w i t h h i g h e c o n o m i c c o n t r i b u t i o n
E X P O S E D E C O S Y S T E M S E X P O S E D
I N F R A S T R U C T U R E S
E X P O S E D P E O P L E
L o w s p e e d N o t u n d e r s t a n d i n ga l e r t m e e s a g e
O r g a n i z a t i o n p r o b l e m s L o n g w a r n i n g t i m e a n d
b a d c o m m u n i c a t i o n s
B a s i c n e e d s i n f r a s t r u c t u r e s
R o a d s E m e r g e n c y i n f r a s t r u c t u r e s
H u m a n i t a r i a n c r i s i s E m e r g e n c y t e a m s a n d
i n f r s t r u c t u r e s w i l l n o t b e a v a i l a b l e d u r i n g t h e e v e n t
D a n g e r o u s - h a z a r d o u s i n f r a s t r u c t u r e s
B u i l d i n g w i t h l e s s t h a n 3 f l o o r s A g r e a t n u m b e r o f v u l n e r a b l e p e o p l e
a f f e c t e d
I n f o r m a t i o n a n d a w a r e n e s s
P r o t e c t i o n a n d r e f o r e s t a t i o n o f
m a n g r o v e s R e l o c a t i o n / r e i n f o r c e m e n t o f
c r i t i c a l b u i l d i n g s , e m e r g e n c y a n d d a n g e r o u s - h a z a r d o u s
i n f r a s t r u c t u r e s E X P O S E D E L E M E N T S
H u m a n c a s u a l t i e s C a u s a l r e l a t i o n s h i p s
C a u s a l c o m p o n e n t s
C a u s a l r e l a t i o n s h i p s a f f e c t e d b y R R M
L E G E N D L E G E N D L E G E N D L E G E N D
L o n g - t e r m s o c i a l d i s r u p t i o n C o n s e q u e n c e s / i m p a c t s C o n s e q u e n c e s p a r t i a l l y t a c k l e d b y R R M
R i s k r e d u c t i o n m e a s u r e s R R M
B. CAUSAL RELATIONSHIPS AFFECTED BY POTENTIAL RISK REDUCTION MESURES
efforts (see Fig. 5), while the assessment at the local level of the prioritised municipalities is aimed at calculating the specific expected impacts by dimension (see Figs. 6 and 7).
The deterministic hazard assessment based on propagation models for earthquake-generated tsunamis provided differ-ent hazard maps along the coast of El Salvador. This per-mitted the identification of the main tsunami flood-prone ar-eas, that is, the Western Coastal Plain and the coastal stretch between La Libertad and Jucuaran municipalities, with the Lempa river mouth and Jiquilisco and Jaltepeque wetlands being especially relevant in terms of flooded area. The pro-posed exposure and vulnerability mixed indicator approach has proved to be useful to identify and locate the elements in the hazard area, as well as to measure the human, envi-ronmental, socioeconomic and infrastructural characteristics that make the municipalities more susceptible to the selected impacts.
The qualitative resilience assessment identified (through a short questionnaire) the degree of organisation and response within a community in case of an emergency. The analysis of a single municipality may not require a resilience index (i.e. numerical); however, when a comparison between mu-nicipalities is required (which was the aim of the national assessment), the resilience index seems to be a possible ap-proach to have a general idea of the state of each municipal-ity in terms of their preparedness and emergency manage-ment in order to design further detailed analyses to propose weakness-oriented, site-specific corrective measures.
A clear connection to translate the vulnerability and risk assessments into risk reduction measures is offered, trying to bridge the gap between science and management for the tsunami hazard. The risk assessment process directly feeds the required information to develop the risk management process, by reorienting its usual linear structure in order to have the DRM as the main goal to achieve. The approach, to-gether with system dynamics modelling, facilitates the iden-tification and prioritisation of ways to reduce the sensitiv-ity of municipalities regarding various dimensions and to en-hance the resilience of communities. Regarding the practical application of the RRM to the case study of El Salvador, and based on the risk results presented above, several measures are already being developed by the MARN, such as public tsunami hazard bulletins and monthly reports, information and awareness campaigns for local communities, a network of local observers to warn the communities in collabora-tion with the Ministry and Civil Proteccollabora-tion, and community-based evacuation planning (further information is provided by González-Riancho et al., 2013).
A dynamic model to update the risk results is expected to be incorporated into the methodology as an effective tool for adaptive risk management. It is intended to gradually update the set of indicators, as the risk reduction measures are being implemented, allowing the systematic modification of the ex-posure, vulnerability and risk results and the understanding
and utilising of the interrelation and feedback loops control-ling the behaviour of the coupled human and natural system.
Acknowledgements. We would like to thank the Spanish Agency
for International Development Cooperation (AECID) for funding and supporting the project framing this research, calledEvaluación del Riesgo por tsunami en la costa de El Salvador (Fase I: Peligrosidad, Fase II: Vulnerabilidad y Riesgo) and developed during the period 2009–2012; and the Ministry of Environment and Natural Resources (MARN) of El Salvador for our fruitful collaboration. We also thank the European projectNEARToWARN (Near-field Tsunami Warning).
Edited by: I. Didenkulova
Reviewed by: A. Armigliato and two anonymous referees
References
Aboelata, M. and Bowles, D. S.: LIFESim: a model for estimat-ing dam failure life loss, Draft Report to Institute for Water Re-sources, US Army Corps of Engineers and Australian National Committee on Large Dams, Institute for Dam Safety Risk Man-agement, Utah State University, Logan, Utah, 2005.
Alliance Development Works in collaboration with United Nations University and The Nature Conservancy: World Risk Report 2012, Alliance Development Works, ISBN 978-3-9814495-0-3, Berlin, 2012.
Álvarez-Gómez, J. A., Aniel-Quiroga, Í., Gutiérrez-Gutiérrez, O. Q., Larreynaga, J., González, M., Castro, M., Gavidia, F., Aguirre-Ayerbe, I., González-Riancho, P., and Carreño, E.: Tsunami hazard assessment in El Salvador, Central America, from seismic sources through flooding numerical models., Nat. Hazards Earth Syst. Sci., 13, 2927–2939, doi:10.5194/nhess-13-2927-2013, 2013.
Alvear Brito, J. G. and Cruz D’Howitt, M. A.: Elaboración de un mapa de accesibilidad y modelo de evacuación ante una even-tual ocurrencia de tsunami en las ciudades de Salinas y Bahía de Caráquez, mediante herramientas geoinformáticas, Revista Geoespacial, 5, 1–15, 2009 (in Spanish).
Birkmann, J.: Measuring vulnerability to promote disaster-resilient societies: conceptual frameworks and definitions, in: Measuring Vulnerability to Natural Hazards vol. 1, United Nations Univer-sity Press, Tokyo, Japan, 9–54, 2006.
Birkmann, J., Cardona, O. D., Carreño, M. L., Barbat, A. H., Pelling, M., Schneiderbauer, S., Kienberger, S., Keiler, M., Alexander, D., Zeil, P., and Welle, T.: Framing vulnerability, risk and societal responses: the MOVE framework, Nat. Hazards, 67, 193–211, 2013.
Clerveaux, V., Katada, T., and Hosoi, K.: Tsunami scenario simula-tor: a tool for ensuring effective disaster management and coastal evacuation in a multilanguage society, Sci. Tsunami Haz., 27, 48–71, 2008.