www.nat-hazards-earth-syst-sci.net/12/2347/2012/ doi:10.5194/nhess-12-2347-2012
© Author(s) 2012. CC Attribution 3.0 License.
and Earth
System Sciences
Assessment of coastal vulnerability to climate change hazards at the
regional scale: the case study of the North Adriatic Sea
S. Torresan1, A. Critto1,2, J. Rizzi1,2, and A. Marcomini2
1Centro Euro-Mediterraneo per i Cambiamenti Climatici (CMCC), Impacts on Soil and Coast Division, Via Augusto Imperatore 16, 73100 Lecce, Italy
2Department of Environmental Sciences, Informatics and Statistics, University Ca’ Foscari Venice, Calle Larga S. Marta 2137, 30123 Venice, Italy
Correspondence to:A. Critto (critto@unive.it)
Received: 18 November 2011 – Revised: 10 February 2012 – Accepted: 9 April 2012 – Published: 24 July 2012
Abstract.Sea level rise, changes in storms and wave climate
as a consequence of global climate change are expected to in-crease the size and magnitude of flooded and eroding coastal areas, thus having profound impacts on coastal communi-ties and ecosystems. River deltas, beaches, estuaries and la-goons are considered particularly vulnerable to the adverse effects of climate change, which should be studied at the regional/local scale. This paper presents a regional vulner-ability assessment (RVA) methodology developed to anal-yse site-specific spatial information on coastal vulnerability to the envisaged effects of global climate change, and assist coastal communities in operational coastal management and conservation. The main aim of the RVA is to identify key vulnerable receptors (i.e. natural and human ecosystems) in the considered region and localize vulnerable hot spot areas, which could be considered as homogeneous geographic sites for the definition of adaptation strategies. The application of the RVA methodology is based on a heterogeneous subset of bio-geophysical and socio-economic vulnerability indicators (e.g. coastal topography, geomorphology, presence and dis-tribution of vegetation cover, location of artificial protection), which are a measure of the potential harm from a range of climate-related impacts (e.g. sea level rise inundation, storm surge flooding, coastal erosion). Based on a system of numer-ical weights and scores, the RVA provides relative vulnera-bility maps that allow to prioritize more vulnerable areas and targets of different climate-related impacts in the examined region and to support the identification of suitable areas for human settlements, infrastructures and economic activities, providing a basis for coastal zoning and land use planning. The implementation, performance and results of the method-ology for the coastal area of the North Adriatic Sea (Italy) are fully described in the paper.
1 Introduction
Coastal zones are considered key climate change hot spots worldwide (IPCC, 2007a; Voice et al., 2006; EEA, 2010). The major expected impacts are associated with permanent inundation of low-lying areas, increased flooding due to ex-treme weather events (e.g. storm surges), and greater erosion rates affecting beaches and cliffs (Nicholls and Cazenave, 2010; EC, 2005; EEA, 2006; Klein et al., 2003). Further-more, it is widely recognized that climate change can have far reaching consequences on coastal surfaces and ground-water (e.g. saltground-water intrusion), coastal ecosystems (e.g. wet-lands and biodiversity loss), marine biological communi-ties and commercial species (Abuhoda and Woodroffe, 2006; Wachenfeld et al, 2007; Nicholls, 2004; IPCC, 2008).
At international level two main research communities are involved in the analysis of climate change and climate vari-ability impacts on coastal zones: the natural hazard and the climate change communities.
According to the framework proposed by the natural haz-ard community (UN-ISDR, 2009), the analysis of the likely impacts or risks related to coastal hazards involves the eval-uation of two main components: hazard (i.e. an event or phe-nomenon with the potential to cause harm, such as loss of life, social and economic damage or environmental degra-dation) and the system vulnerability (i.e. the characteristics of a system that increase its susceptibility to the impact of climate-induced hazards). In this context, vulnerability is of-ten expressed in a number of quantitative indexes, and is a key step toward risk assessment and management (Romieu et al., 2010).
(i.e. the magnitude and rate of climate variations, to which a system is exposed), sensitivity (i.e. the degree to which a sys-tem could be affected by climate-related stimuli), and adap-tive capacity (i.e. the ability of a system to adjust or to cope with climate change consequences) (IPCC, 2007a). Accord-ing to this framework, the potential consequences of climate change on natural and human systems can be quantified in terms of potential or residual impacts and risks, depending on the consideration of the adaptive capacity component in the final assessment (F¨ussel and Klein, 2002).
Climate change vulnerability is also defined as a combina-tion of physical, environmental, social and economical fac-tors, whose assessment implies the integration of multiple quantitative and qualitative data (F¨ussel and Klein, 2006). Moreover, it is considered as a descriptor of the status of a system or community with respect to an imposed hazard (Kienberger et al., 2009) and is related to a given location, sector or group (Hinkel and Klein, 2007).
Considering that climate change impacts and risks on coastal zones are very dependent on regional geographi-cal features, climate and socio-economic conditions, impact studies should be performed at the local or, at most, at the regional level (Torresan et al., 2009).
A relevant challenge is therefore to develop suitable approaches for the assessment of coastal vulnerability to climate-induced hazards at the regional scale, taking into ac-count the best available geographical information for the case study area, in order to highlight most critical regions and sup-port the definition of operational adaptation strategies.
At European level, different tools are suggested to assess coastal vulnerability to climate change at different spatial and temporal scales (Ramieri et al., 2011). They can be catego-rized into: index-based methods that include several variants of the coastal vulnerability index (CVI; Gornitz, 1990; Gor-nitz, 1991; Gornitz et al., 1993); GIS-based decision support systems that support decision makers in a sustainable man-agement of natural resources and in the definition of mitiga-tion and adaptamitiga-tion measures (Mocenni et al., 2009; Schirmer et al., 2003); methods based on dynamic computer models that allow to integrate the time dimension in the analysis and mapping of vulnerability and risks of coastal systems to cli-mate change (Hinkel, 2005; Hinkel et al., 2010; Mcleod et al., 2010; Kenny et al., 2000; Warrick et al., 2005; Warrick, 2009; Hsu et al., 2006; Henrotte, 2008; Engelen et al., 1998; Mokrech et al., 2009).
Different tools could be indicated to address coastal vul-nerability at different spatial and temporal scales and for dif-ferent policy and decision-making purposes (Ramieri et al., 2011).
Several indices were developed at the international level for characterising the relative vulnerability of different coasts to sea level rise and coastal erosion impacts (Abuodha and Woodroffe, 2006). These methods would provide a relative measure of the system’s vulnerability to the effects of climate change and are designed to make a rapid assessment and
visualization of the relative vulnerability of different coastal parcels in the examined area. Index-based tools are partic-ularly useful to make a first assessment of vulnerability of different coastal parcels to climate change, and support adap-tation planning and regional integrated coastal zone manage-ment (ICZM) strategies.
Generally, index-based methods can be used in differ-ent areas and at differdiffer-ent spatial scales (e.g. local, regional, supra-regional scale) based on available datasets. Moreover, they are of easy implementation and are based on the analysis of past data (e.g. geomorphic cartography, tide gauge data, land use and socio-economic data), without requiring the use of numerical model projections or of adaptation scenarios.
However, available index-based studies are mostly based on the identification of mono-dimensional shoreline seg-ments (Gornitz, 1990, 1991; Gornitz et al., 1993; Gutierrez et al., 2009). In this way the information about the spatial discontinuity of hazard processes and vulnerable conditions could be obscured, thus misleading policy-related decisions and highlighting unwanted impacts (Kienberger et al., 2009). Moreover, most of them adopt a single-impact approach that could be useful for the analysis of the consequences as-sociated with individual impacts such as sea level rise (Park et al., 2003; Gutierrez et al., 2009), storm surges (OECD, 2003), and coastal erosion (Colin et al., 2007; Australian Government, 2009; Sharples et al., 2009; McLaughlin and Cooper, 2010), but do not consider the multiple climate change impacts that may affect the same coastal region.
Finally, even if it is widely recommended to adopt an ecosystem perspective in order to represent the complexity of systems, sectors and processes that characterize coastal envi-ronments across the land/sea interface (UNEP MAP, 2008), the majority of index-based studies analyse multiple indica-tors that vary in number and typology, but often refer to indi-vidual coastal parcels without considering the geographical distribution of multiple sectors and targets that coexist in the real coastal environment and their specific vulnerability to potential climate change impacts (Gornitz, 1990, 1991; Gor-nitz et al., 1993; Abuhoda and Woodroffe, 2006; Gutierrez et al., 2009).
for each target of interest, and allow to establish hot spot vul-nerable areas and define priorities for intervention. The North Adriatic coastal area was selected to test the regional vulner-ability assessment methodology and the main results of the analysis are presented and discussed in this paper.
2 Case study area
The Mediterranean Basin is particularly vulnerable to cli-mate changes, which depend on the regional oceanographic responses to global climate change and the local/regional ge-ographical features (Simeoni and Corbau, 2009; EEA, 2006). Particularly, in areas of coastal subsidence, climate-related sea level rise could cause an inland migration of beaches, low-lying and soft sedimentary coasts and significantly in-crease potential damage from storm surges (Travers et al., 2010). The North Adriatic coast (Fig. 1a) is a representative example of a coastal zone subject to a multitude of signifi-cant and rapidly evolving pressures from natural and anthro-pogenic drivers that are recurrent in the Mediterranean coast-line (Simeoni and Corbau, 2009). It holds high ecological, cultural and economic value and includes major centers of population and agriculture.
Specifically, the area considered in this case study com-prises Friuli Venezia Giulia and Veneto regions (Fig. 1b) and runs along the Adriatic Sea from the national border between Italy and Slovenia to the mouth of the southern tributary of the Po Delta system (i.e. Po di Goro) with an overall length of about 286 km.
Friuli Venezia Giulia includes three provinces and eight coastal municipalities from the Slovenian border to Taglia-mento River mouth. From north-east to south-west, between the Slovenian border and the Timavo River mouth, the coast is high and rocky with few narrow beaches. The overall con-tinuity of the coast is interrupted by several river outlets (e.g. Tagliamento, Isonzo, Timavo) and lagoons (i.e. Marano, Grado). Veneto region includes two provinces and ten coastal municipalities, from Tagliamento to Po River mouth. From north to south, the Veneto coast is characterized by low-lying beaches and by two important lagoons (i.e. Venetian and Po River Delta lagoons). Moreover, it includes the rivers Livenza, Piave, Brenta, Adige and Po that flow into the North Adriatic Sea with an estuary, except for the Po River that flows with a delta, which is the largest wetland area of Eu-rope.
The main coastal activities of the case study area are petrochemical industry, tourism, fishing, seaport/port activ-ities and ship traffic. On the whole, the Northern Adriatic Sea coast comprises a very precarious coastal environment subject to continuous morphological changes that can be ap-preciable even over short geological time scales (Gambolati and Teatini, 2002). Moreover, erosion is still active in many areas, both on the coastal sea floor and on the beach, since
Fig. 1.The case study area: the Northern Adriatic Sea(a)and the coast of the Veneto and Friuli Venezia Giulia regions (Italy)(b). (Adapted from google maps: maps.google.it).
the beginning of the 20th century and especially after 1960 (Bondesan et al., 1995).
Many areas, particularly the Venetian Lagoon and around the Po River Delta, are also located below the mean sea level and affected by natural or man-induced subsidence (Pi-razzoli, 2005; Carbognin et al., 2009). Particularly, sites in northeastern Italy are subsiding at rates of 0.5–1 mm yr−1 with a projection for 2100 at about 135 mm (Lambeck et al., 2011). Furthermore, the municipality of Venice has been ex-periencing an increase of high tide events with consequent flooding of the city (Tomasin and Pirazzoli, 2008). Moreover, the historical observations and future projections of isostatic and tectonic movements show that the North Adriatic coast (particularly Venetian, Grado and Marano lagoons) is par-ticularly vulnerable to future sea level rise (Lambeck et al., 2011). Observed sea level rise trends from tide gauge data be-tween 1993 and 2005 showed also a general rise in the Adri-atic Sea level, which ranges from 2.9 to 5.7 cm (Umgiesser et al., 2010). When compared to satellite measurements of the Mediterranean mean (2.17 cm), the global mean (3.3 cm) and IPCC data (3.1 cm), these data indicate that the Adriatic Sea showed a higher rate of sea level rise in the period 1993 to 2005 (Umgiesser et al., 2010).
Therefore, climate change and the related consequences of sea level rise, storminess and coastal erosion are a prominent issue for the case study area, both considering the vulnera-bility of fragile ecosystems, such as coastal lagoons, and the concentration of cultural and socio-economic values.
to analyze the evolution of the Po River Delta in relation with sea level rise and land subsidence (Simeoni and Cor-bau, 2009); the relative sea level rise has consequences in the Venetian Lagoon (Carbognin et al., 2009) and the assess-ment of the potential reduction of aquaculture production in Venetian fisheries due to climate change impacts (Ministry of Environment, 2009). Moreover, wetland deterioration in the Venetian Lagoon was studied in relation to relative sea level rise, erosion by strong waves or low sediment deposition in saltmarshes (Day et al., 1996).
Existing studies were also often targeted to the analysis of specific physical processes (e.g. morphological evolution of deltas and transitional environments in response to sea level rise) without considering other important factors contributing to coastal vulnerability to climate change, such as distribu-tion of coastal assets, inhabitants and ecosystems (Fontolan, 2001; Seminara et al., 2005; Ferla et al., 2007; Simeoni et al., 2007). The complexity of the problems linked to climate change and the importance of considering multiple systems and sectors that interact in the study area ask instead for a broader integrated approach.
The main aim of this paper is therefore to adopt a multi-disciplinary approach that takes into account a wide range biogeophysical and socio-economic factors (e.g. altimetry, geomorphology, land use and vegetation cover) in order to analyze the vulnerability of multiple natural and human coastal receptors to several climate change impacts (i.e. sea level rise, storm surge flooding and coastal erosion). Differ-ent from a previous approach applied only to the coastal area of the Veneto region and based on the mono-dimensional analysis of shoreline vulnerability to climate change (Torre-san et al., 2008), the present work analyses the spatial distri-bution of coastal vulnerability to climate change in the whole region of the North Adriatic coast, considering the territory included from the shoreline to 2 m elevation contour line, for a total surface of 3.531 km2.
3 Methods
The vulnerability assessment methodology proposed for the estimation of coastal sensitivity to climate change impacts at the regional scale deals with qualitative and quantita-tive spatial attributes, representing environmental and socio-economic vulnerability indicators of multiple coastal recep-tors to climate change. The method is based on a multi-criteria decision analysis (MCDA) that includes a wide va-riety of techniques for the evaluation and ranking of differ-ent alternatives, considering all relevant aspects of a decision problem and involving many actors (decision makers as well as experts) (Giove et al., 2009). It integrates expert judgments and stakeholder preferences in order to aggregate quantita-tive and qualitaquantita-tive environmental and socio-economic indi-cators, representing the vulnerability of each coastal target to different climate-induced hazards. The application of the
methodology allows the identification and prioritization of key vulnerable receptors in the considered region and of mogeneous vulnerable areas, which can be considered as ho-mogeneous geographic sites for the definition of adaptation and management strategies.
The methodology is composed of the following main steps:
1. definition of the regional vulnerability matrix; 2. definition and scoring of vulnerability classes; 3. assignation of weights to vulnerability factors; 4. aggregation of vulnerability factors;
5. normalization and classification of vulnerability values; 6. construction of vulnerability maps.
The following paragraphs describe the application of each step of the methodology for the case study area of the North Adriatic Sea. The results of the application (including vul-nerability maps and statistics) are described and discussed in Sect. 4.
3.1 Definition of the regional vulnerability matrix
The first step for the implementation of the proposed re-gional vulnerability assessment methodology is the defini-tion of a regional vulnerability matrix, which identifies mul-tiple coastal receptors that could be affected by mulmul-tiple climate change impacts. Receptors represent natural or an-thropogenic systems of interest within the considered re-gion, due to ecological, economical or social reasons, and are not equally affected by climate change hazards (UKCIP, 2003). For each analyzed receptor, a subset of vulnerability factors representing physical, ecological and socio-economic parameters relevant for the assessment of its vulnerability to different climate change impacts was defined. According to Fig. 2, factors included in the vulnerability matrix are di-vided into susceptibility factors (SF), pathway factors (PF) and value factors (VF). SF determine the degree to which a receptor could be affected, either adversely or beneficially, by climate-related stimuli. They denote the dose-response relationship between the exposure of a receptor to climate stimuli and the resulting effects. VF identify relevant envi-ronmental and socio-economic values of the receptors that need to be preserved for the interest of the community. PF are physical characteristics of the receptors, determining the possibility of contact with climate change hazards and there-fore potential exposure areas.
Fig. 2.Conceptualization of vulnerability for the regional vulnera-bility assessment applied in this paper.
sea level rise inundation, storm surge flooding and coastal erosion). The vulnerability factors included in the matrix are described in Table 2 and the analyzed receptors are defined in Table 3. While the impacts sea level rise inundation and storm surge flooding were considered to be relevant for all the receptors included in the vulnerability matrix (i.e. inland and shoreline receptors), the coastal erosion impact was an-alyzed only for the receptors that highly interact with shore-line and ocean dynamics (i.e. beaches, river mouths, wetland and protected areas). The selection of vulnerability factors was performed by taking into account the availability of ho-mogeneous GIS data for the whole case study area (Table 4).
3.2 Definition and scoring of vulnerability classes
The second step of the methodology consists of the definition of classes and scores for the vulnerability factors (included in the regional vulnerability matrix and reported in Table 2).
The definition of classes and the assignation of scores is a necessary step for the normalization and aggregation of indi-cators (defined in Sects. 3.3 and 3.4). Susceptibility classes represent thresholds, reflecting variations in the degree to which each receptor may be affected by a climate-related im-pact; value classes reflect variations in the environmental or socio-economic value associated with each receptor; finally, pathway classes represent variations in the likelihood of con-tact/exposure of each receptor with each climate change haz-ard.
Vulnerability classes and scores assigned to the vulnera-bility factors used in the North Adriatic case are shown in Table 5. Classes are both categorical (e.g. presence or ab-sence of a particular indicator or indicator type) or quantita-tive (e.g. elevation and slope data). In the first case, classes and scores were assigned by the authors of this paper, rep-resenting a team of environmental experts, taking into ac-count literature information when possible or alternatively
using expert judgment (Preston et al., 2008). In the second case, classes were mostly derived by dividing the distribu-tion of data into equal-sized sub-ranges (Zald et al., 2006). A non-linear hyperbolic scaling method was used for the factor distance from coastline, assuming that the vulnerability to storm surge increases rapidly with the proximity to the coast. All these classification methods identify relative vulnerabil-ity thresholds that are site-specific, and allow the evaluation of the relative coastal vulnerability of different sub-areas in the same region.
According to various methodologies applied at the in-ternational level (Gornitz, 1990; Abuodha and Woodroffe, 2006), the assignation of scores to vulnerability classes was performed using a 1–5 scale. For each analyzed impact, this scoring method allowed the definition of relative rank-ings within the subset of vulnerability classes associated with each vulnerability factor. This means that the maxi-mum score 5 was always assigned to the most important (i.e. higher) vulnerability class and does not represent the maxi-mum vulnerability class in absolute terms (i.e. at the global scale). In the same way the minimum score 1 was assigned to the vulnerability class that was considered the least im-portant (i.e. the lowest vulnerability class) in the subset of classes defined for each indicator. Table 6 provides linguis-tic evaluations supporting expert(s)/decision maker(s) in the assignation of scores to vulnerability factors. According to Giove et al. (2009), the expert judgments should have a sound scientific and technical basis, while the decision-maker judg-ments are usually based on more subjective political and managerial considerations. Consequently, the integration of expert judgement is particularly important for the assignation of scores to physical, natural and ecological parameters (i.e. pathway and susceptibility factors) and the role of a decision maker is fundamental in the evaluation of socio-economic parameters (i.e. value factors). Finally, it is important to con-sider that the integration of expert/decision maker perspec-tive is significantly important in situations of uncertainty and data scarcity, such as environmental risk and vulnerability assessments (Giove et al., 2009).
Table 1.Vulnerability matrix applied for the assessment of coastal vulnerability to sea level rise inundation (a), storm surge flooding (b) and coastal erosion (c) in the coastal area of the North Adriatic Sea. Dark grey cells represent pathway factors, grey cells susceptibility factors and light grey cells value factors.
❵ ❵
❵ ❵❵
❵ ❵
❵ ❵❵
❵
Receptors
Impacts
Beaches River Wetlands Terrestrial Protected Urban Agricultural Mouths Biological Systems Areas Areas Areas Hydrodynamic
IMPACTS
Sea level rise – Elevation – Elevation – Elevation – Elevation – Elevation – Elevation – Elevation inundation (a) – Artificial protections – Artificial protections – Artificial protections – Artificial protections – Artificial protections – Artificial protections – Artificial protections
– Protection level – Protection level – Protection level – Protection level – Protection level – Protection level – Protection level – Urban typology – Wetland extension – Vegetation cover – Urban typology – Urban typology – Agricultural typology – Agricultural typology – Agricultural typology
Storm surge flooding (b) – Elevation – Elevation – Elevation – Elevation – Elevation – Elevation – Elevation – Distance from coastline – Distance from coastline – Distance from coastline – Distance from coastline – Distance from coastline – Distance from coastline – Distance from coastline – Artificial protections – Artificial protections – Artificial protections – Vegetation cover – Artificial protections – Artificial protections – Artificial protections – Vegetation cover – Vegetation cover – Vegetation cover – Coastal slope – Vegetation cover – Coastal slope – Coastal slope – Coastal slope – Coastal slope – Wetland extension – Protection level – Coastal slope – Urban typology – Agricultural typology – Geomorphology – Geomorphology – Protection level – Vegetation cover – Protection level – Protection level – Protection level – Dunes – Protection level – Urban typology – Urban typology – Agricultural typology – Protection level – Urban typology – Agricultural typology
– Agricultural typology
Coastal erosion (c) – Artificial protections – Artificial protections – Artificial protections – Artificial protections – Vegetation cover – Vegetation cover – Vegetation cover – Vegetation cover – Coastal slope – Geomorphology – Sediment budget – Sediment budget – Geomorphology – Sediment budget – Wetland extension – Protection level – Dunes – Mouth typology – Protection level
– Sediment budget – Protection level – Protection level
Table 2.Vulnerability factors used for the assessment of coastal vulnerability to climate change at the regional scale in the coastal area of the North Adriatic Sea. Vulnerability factors are categorized into pathway factors (P), susceptibility factors (S), and value factors (V).
Vulnerability factor Vulnerability type
Definition
Elevation P It represents the surface (km2)within a class of elevation Xi(e.g. 0.15 m≤Xi≤0.3 m)
in the case study area.
Distance from coastline P The distance of a location (e.g. a pixel of the map) from the coastline (km).
Artificial protection S Artificial protections (e.g. dikes) for the defence of the coastline from storm surge and coastal erosion impacts.
Vegetation cover S The typology of vegetation that cover an area (i.e. natural grassland and meadow, shrub, forest).
Coastal slope S Average topographic slope (in degrees) along the coastline.
Geomorphology S Geomorphologic structure of the coastal zone. It refers to muddy, sandy or rocky coast typology.
Dunes S It refers to the presence or absence of natural dunes.
Sediment budget S The balance between the supply of sediment (e.g. sand) to a shore and the erosion or removal of sediment from that shore.
Mouth typology S It refers to the type of river mouths (i.e. estuary, delta). Wetland extension S/V The surface area of wetlands in square kilometres (km2).
Urban typology S/V The typology of urban areas (i.e. urban fabric, commercial fabric, infrastructure). Agricultural typology S/V The typology of farming in an area (i.e. permanent crops, pastures and arable land). Protection level V It refers to the type of protected areas within the considered receptor (i.e. national area,
Table 3.Description of the receptors included in the vulnerability matrix and identified as targets of the regional vulnerability assessment methodology applied to the North Adriatic coast.
Receptor definition
Beaches This receptor analyzes beaches and the vegetation associated with them. Furthermore, it analyzes natural and ar-tificial protections to climatic impacts. Sandy coastal areas are important for tourism, recreation and residential development (Voice et al., 2006). Sand-grade sediments are generally defined to be those predominantly composed of grains ranging between 0.06 to 2.0 mm diameter (Pettijohn, 1973). In the coastal environment, unconsolidated sediments within this grain size range are highly mobile and small enough to be easily eroded and transported by waves, currents and winds that frequently act on most shorelines, in contrast to larger (pebble/cobble/boulder) particles that are moved by very energetic waves and hardly at all by wind (Sharples, 2006).
River mouth This receptor includes estuaries and deltas. Estuaries are important receptors because they contain significant habi-tats including seagrasses, mudflats/sandflats, saltmarshes, reed, sedge and rush communities, and provide sheltered habitat, nursery and spawning areas for fish, crabs, prawns and shellfish (Voice et al., 2006). Delta is a landform where the mouth of a river flows into the sea. It builds up sediment outwards into the flat area, which the river flow encounters (as a deltaic deposit), transported by the water and set down as the currents slow. Deltas present high biodiversity and significant habitats (wetlands).
Wetlands The wetland receptor includes coastal wetlands along with vegetation, animal life and artificial and natural protec-tions located in wetlands areas. A wetland is an environment at the interface between truly terrestrial ecosystems and aquatic systems, making them inherently different from each other yet highly dependent on both (Mitsch, 2007). Terrestrial
biological systems
This receptor includes animal and plant terrestrial life, their habitats and the ecological functions they provide. Specifically, terrestrial biodiversity encompasses the total variety of life forms including plants, animals and micro-organisms and the processes and ecosystems they form (EPA, 2002).
Protected areas A protected area is defined as an area of land and/or sea especially dedicated to the protection and maintenance of biological diversity and of natural and associated cultural resources, managed through legal or other effective means (UNEP-WCMC, http://www.unep-wcmc.org/protected areas/index.htm).
This receptor include areas with biological, morphological or historical sensitive aspects. An example of protected areas include wetlands, marine areas, national parks, and national heritage. They provide tourism income, fisheries breeding and spawning grounds, ecosystem protection and protection of historical locations (Voice et al., 2006). Urban areas This receptor includes areas cover by countries, residential areas, commercial zones and industries. It includes
areas in which a majority of the people are not directly dependent on natural resource-based occupations (http: //www.mhhe.com/biosci/pae/glossaryu.html). Specifically, it includes areas mainly occupied by dwellings and buildings used by administrative/public utilities or collectivities, including their connected areas: areas mainly oc-cupied by industrial activities of transformation and manufacturing, trade, financial activities and services, transport infrastructures for road traffic and rail networks, airport installations, river and sea port installations, including their associated lands and access infrastructures, and areas voluntarily created for recreational use (Bossard et al., 2000). Agricultural
areas
This receptor includes areas comprised of arable land, gardens and other perennial plants, meadows and natural pastures (http://regionai.stat.gov.lt/en/savokos.html#Agricultural%20land). It includes arable land (lands under a rotation system used for annually harvested plants and fallow lands, which are permanently or not irrigated), per-manent crops (all surfaces occupied by perper-manent crops, not under a rotation system), pastures (lands that are permanently used for fodder production) (Bossard et al., 2000).
water level reached by the storm surge event happened in Venice on 4 November 1966). Finally, the distance limit de-fined for the storm surge flooding impact (i.e. 52.62 km) was determined according to the maximum distance inland reached by the 2 m contour line. The upper limits defined for pathway factors allowed to delimitate the study area only to areas associated with a plausible exposure to coastal hazards (Preston, 2008). Accordingly, all others vulnerability factors and their qualitative and quantitative scoring were focused on this area.
According to Kienberger et al. (2009), the selection and scoring of categorical classes were performed with the help of expert knowledge, considering data availability and cov-erage. Moreover, the assignation of scores to the same cat-egorical vulnerability factors can vary from one impact to another.
Table 4.Datasets used for the application of the regional vulnerability assessment methodology to the case study area (i.e. the North Adriatic coasts). FVG = Friuli Venezia Giulia region, Italy. VE = Veneto region, Italy. ISPRA = High Institute for Environmental Protection and Research, Italy. ESRI = Environmental Systems Research Institute.
Dataset Spatial domain Source Contour lines 1:5000 FVG FVG, 2006 25 m digital elevation model
(DEM)
VE, FVG VE, 2006
Hydrologic basins: rivers and channels 1:25 000
FVG FVG 2000
Corine Land Cover, 1:100 000 FVG FVG, ISPRA, 2000 VE VE, 2000
Land use, 1:25 000 FVG FVG, 2000 Protected areas and ARIA
zones, 1:150 000
FVG FVGa2000
Geographic aoastal information system (SIGC)
Italy ISPRA, www.mais.sinanet.apat.it/cartanetms/ coste/
Geologic and geomorphologi-cal map of the Po River Delta, 1:50 000
Po River Delta Veneto Po Delta Regional Park Authority, 2002
Map of roads North Adriatic ESRI, www.esri.com/data/download/basemap/ index.html
Main cities FVG FVG, 2006 Buildings (houses, industries,
etc.)
FVG FVG, 2006
Administrative unit boundaries VE VE, 2005 FVG FVG, 2006
Location of primary rivers VE ISPRA, www.mais.sinanet.apat.it/cartanetms/ FVG FVG, 2000
Satellite imagery North Adriatic http://image2000.jrc.it/
score was assigned to hard rocky coasts, an intermediate score was assigned to soft sandy shores and the higher score to finer muddy shores (e.g. mainly estuarine and deltaic) (Sharples, 2006). Concerning historic shoreline erosion rates, the higher vulnerability score was attributed to retreating coasts, compared to stable and prograding ones (Torresan, 2008; Abuodha and Woodroffe, 2006). Finally, fluvial deltaic areas were considered less vulnerable than estuarine ones to eroding processes (Sharples, 2006).
The presence of artificial protection was considered a relevant factor decreasing susceptibility of the coastline to coastal erosion and storm surge flooding ( ¨Ozyurt, 2008). Ac-cordingly, the maximum vulnerability score (i.e. 5) was as-signed to coastal parcels without artificial protections and the minimum score (i.e. 1) to coastal units with engineered frontage. In the same way the presence of natural dunes was considered as a factor reducing the susceptibility of soft
sandy shores to storm surge and coastal erosion, compared to the absence (McLaughlin and Cooper, 2010).
Table 5.Classes and scores applied to vulnerability factors used in the North Adriatic in order to estimate the vulnerability of coastal receptors to the following climate change impacts: sea level rise inundation (SLR); storm surge flooding (SSF); coastal erosion (CE). Scores refer to pathway factors (dark grey cells), susceptibility factors (grey cells) and value factors (light grey cells).
Class Score Vulnerability Factor SLR SSF SLR SSF CE Elevation (m) Min – 0 Min – 0 5 5
0–0.15 0–0.5 4 4 0.15–0.3 0.5–1 3 3 0.3–0.45 1–1.5 2 2 0.45–0.6 1.5–2 1 1 Distance from coastline (km) 0–3.29 5 3.29–6.58 4 6.58–13.16 3 13.16–26.31 2 26.31–52.62 1
SSF CE
Coastal slope (degree) 0–2.06 06 0–1.02 5 1 2.06–4.12 1.02–2.04 4 2 4.12–6.18 2.04–3.07 3 3 6.18–8.24 3.07–4.09 2 4 8.24–10.31 4.09–5.12 1 5 Geomorphology Muddy coast 5
Sandy coast 3
Rocky coast 1
Artificial protections absence 5 5
presence 1 1
Sediment budget Prograding coast 1 Stable coast 3 Retreating coast 5 Wetland extension (km2) 0–19.9 1 5 5 19.9–39.8 2 4 4 39.8–59.8 3 3 3 59.8–79.7 4 2 2 79.7–99.6 5 1 1 Vegetation cover Natural grassland and meadow 1 5 5
Shrub 3 3 3
Forest 5 1 1
Protection level National area 5 5 5 Regional area 3 3 3 Nature 2000 area 1 1 1
Mouth typology Estuary 5
Delta 1
Dunes Presence 1 1
Absence 5 5
Table 6. Linguistic evaluations supporting the expert/decision maker in the assignation of scores to vulnerability factors.
Linguistic Evaluation Score Most important class 5 Weakly less important class 4 Rather less important class 3 Strongly less important class 2 Least important class 1
As far as value factors are concerned, the protection level was considered a relevant parameter for all the impacts. In particular, according to McLaughlin and Cooper(2010), higher scores were assigned to national conservation desig-nation and lower scores to interdesig-national ones.
Urban and agricultural typology, vegetation cover and wet-land extension were also considered as key value factors for the sea level rise impact. Concerning urban/agricultural ty-pology and vegetation cover, higher value scores were as-signed to classes showing higher environmental and socio-economic value, such as urban fabric, permanent crops and forests, respectively (Preston, 2008; McLaughlin and Cooper, 2010; Torresan, 2008). Finally, for the wetland ex-tension indicator, the higher value scores were assigned to wider wetlands considered as priority values to be protected compared to smaller ones.
3.3 Assignation of weights to vulnerability factors
The proposed methodology for the assessment of coastal vul-nerability to climate change impacts combines information from several indicators in order to create a vulnerability in-dex associated with single receptors. Accordingly, the pro-cess used to generate the final vulnerability index requires (1) the aggregation of single vulnerability factors within each of the three vulnerability domains (i.e. susceptibility, pathway and value)and (2) the aggregation of vulnerability domains in the final vulnerability index.
Individual vulnerability factors can be weighted to repre-sent the relative importance of each indicator in each vulner-ability domain. A total weight can also be assigned to each vulnerability domain in order to represent its relative impor-tance in the final estimate of receptor vulnerability.
The allocation of weights is a critical issue since datasets on verification of impacts are not yet available for multi-disciplinary approaches (Kienberger et al., 2009). However, MCDA methodologies are commonly used to integrate ex-pert and decision-maker knowledge in scoring and weighting exercises (Cutter et al., 2008; Malczewski, 2006).
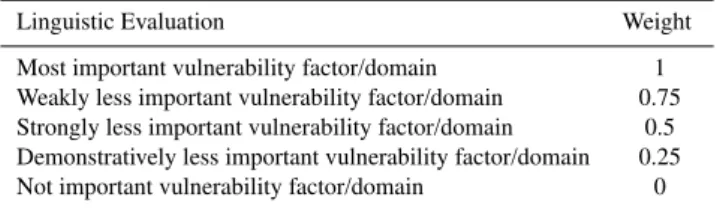
A guideline with linguistic evaluations supporting ex-pert(s) and decision maker(s) in the assignation of weights to vulnerability factors and vulnerability domains is proposed in Table 7.
Table 7. Linguistic evaluations supporting the expert/decision maker in the assignation of weights to vulnerability factors and vul-nerability domains.
Linguistic Evaluation Weight
Most important vulnerability factor/domain 1 Weakly less important vulnerability factor/domain 0.75 Strongly less important vulnerability factor/domain 0.5 Demonstratively less important vulnerability factor/domain 0.25 Not important vulnerability factor/domain 0
Vulnerability factors(domains) judged to have higher in-fluence on vulnerability domain(index) were assigned a weight of 1; on the other side, vulnerability factors(domains) judged to have no influence on the final vulnerability do-main(index) were assigned a weight of 0.
While weights related to susceptibility and pathway com-ponents are generally assigned by an interdisciplinary team of experts, weights assigned to value components often re-quire the judgment of decision-makers, which can be more oriented in safeguarding the environment (e.g. giving higher weights to the susceptibility domain or to ecological criteria, such as protection level and vegetation value) or in preserv-ing the human exploitation of land use (i.e. assignpreserv-ing higher weights to the value domain or to urban and agricultural eco-nomic values). Group decision theory techniques (Kiker et al., 2005) could be applied in order to facilitate involvement, preference elicitation and consensus evaluation of experts and decision-makers working as a decision group.
For this case study it was assumed that susceptibility, path-way, and value domains should have the same importance in determining the receptor vulnerability to each climate change impact. Moreover, it was assumed that all the vulnerability factors attain the same weight within each vulnerability do-main. Accordingly, the same weight equal to 1 was assigned by default, both to vulnerability domains and to vulnerability factors.
3.4 Aggregation of vulnerability factors
According to the conceptual vulnerability framework adopted in this paper, vulnerability is a multi-dimensional concept, encompassing physical, social, economic, and envi-ronmental factors (Fig. 2) that may contribute in determining the sensitivity of a natural or human coastal receptor to dif-ferent climate change impacts (i.e. sea level rise, storm surge flooding, coastal erosion).
In more detail, the assessment of receptor vulnerability to climate change is based on the analysis of multiple geograph-ical indicators that are first aggregated in three vulnerability domains (i.e. susceptibility, value and pathway) and then in the final vulnerability index.
es-timate the final vulnerability index for each receptorj in re-lation to each considered impactk, a weighted linear combi-nation was used according to the following equation:
Vj,k=WA n P a=1
wa,k,jSFa,k,j n
P a=1
wa,k,j
+WB m P b=1
wb,k,jPFb,k,j m
P b=1
wb,k,j
+ (1)
+WC p P c=1
wc,k,jVFc,k,j p
P c=1
wc,k,j
whereVj,k= vulnerability index related to the receptorj and the impactk. SFa,k,j,= score related to the susceptibility fac-tora,the receptorj and the impact k. PFb,k,j = score re-lated to the pathway factorb,the receptorj and the impact
k.VFc,k,j = score related to the value factorc,the receptorj
and the impactk. wa,k,j = weight associated with thea sus-ceptibility factor for the receptorj and the impactk. wb,k,j = weight associated with thebpathway factor for the recep-torj and the impactk.wc,k,j = weight associated with thec value factor for the receptorj and the impactk.WA= weight associated with the susceptibility domain.WB = weight as-sociated with the pathway domain.WC = weight associated with the value domain.n= total number of susceptibility fac-tors.m= total number of pathway factors.p= total number of value factors.
Equation (1) is a typical multi-attribute value theory (MAVT) aggregation function. MAVT is a particular fam-ily of multi-criteria decision analysis methods that combines information from several criteria along with expert judgment in order to estimate single indexes (Malczewski, 2006; Giove et al., 2009).
While the scores used in the assessment of the vulnerabil-ity index are derived from Table 5, the weights were calcu-lated according to Sect. 3.3.
The function proposed to calculate the vulnerability in-dex (Eq. 1) is applied within each receptor in all the spa-tial units of the analysis (i.e. each pixel of the used raster maps). The dimension of the grid cells should be selected at the beginning of the assessment, based on the purposes of the analysis and on the spatial resolution of available data. For this case study the analysis was done based on 25 m cells that correspond to the spatial resolution of the topographic dataset, available in a single unified format for the coasts of Veneto and Friuli Venezia Giulia regions (Table 4). Accord-ing to Shuang-Ye et al. (2009) and Torresan et al. (2008), this can be a suitable resolution to make estimates at the national and sub-national scales and quantify the impacts of climate change on natural and human receptors.
3.5 Normalization and classification of vulnerability
values
In order to convert all the vulnerability indexes in the same standard scale ranging from 1 to 10 and facilitate the com-parative analysis of vulnerability values in the case study area, a normalization procedure should be performed. For the application of the regional vulnerability assessment on the North Adriatic coast, all the vulnerability values obtained from Eq. (1) were converted in the range between 1 and 10 according to the following linear equation:
Vj,k′ =(10−1)× Vj,k−Vj,k(min)
Vj,k(max)−Vj,k(min)
+1 (2)
whereV′
j,k= normalized vulnerability index related to the re-ceptorj and the impactk;Vj,k= initial vulnerability index;
Vj,k(max)= maximum vulnerability value obtained for the re-ceptorjand the impactk;Vj,k(min)= minimum vulnerability value obtained for the receptorj and the impactk.
The normalization procedure allows a more clear relative comparison of vulnerability values related to different vul-nerable receptors for the same climate change impact.
Normalized vulnerability values vary from 1 to 10 and al-low to establish homogeneous vulnerable areas for each re-ceptor considered in the region.V′
j,kequal to 1 means that a grid cell has the lower vulnerability value that could be as-sumed in relation to a given receptorj and impactk. In the same way,V′
j,kequal to 10 means that a cell has higher vul-nerability value that could be assumed for the receptorj and the impactk.
In order to allow a clear visualization of the vulnerability index into vulnerability maps (Sect. 3.6), the vulnerability values ranging from 1 to 10 were categorized into 5 qualita-tive subclasses (i.e. very high, high, medium, low and very low). The five classes were accomplished by dividing the vulnerability rangeVj,k(max)−Vj,k(min)into five equal-sized sub-ranges (Zald et al., 2006). Equal interval classification is useful when the objective of the spatial analysis is to empha-size the amount of an attribute value relative to another value. For this aim, the equal interval was selected as an appropri-ate GIS method in order to compare vulnerability between different sub-areas included in wider coastal system.
For each analyzed receptor, the very high classes identify sub-areas characterized by higher vulnerability values in the considered region and therefore are more likely to be affected by a single climate change impact.
3.6 Construction of vulnerability maps
The main output of the methodology developed to study climate change coastal vulnerability at the regional scale includes GIS-based vulnerability maps that represent the spatial variability of the vulnerability index (described in Sects. 3.4 and 3.5).
For each considered impact, vulnerability maps allow the visualization and prioritization of coastal receptor units ac-cording to values assumed by the vulnerability index (Eq. 2). In this way it is possible to identify more sensitive areas and receptors in the coastal territory (i.e. hot spot vulnerable ar-eas), and transfer information to stakeholders and decision makers in order to support them in the planning of appropri-ate adaptation measures.
The diversity of reference systems, formats, and spatial resolutions required several pre-processing elaborations in order to homogenise the used dataset. A spatially homoge-nous data scale of a 25 m grid was used for the elabora-tion on the North Adriatic coast. The base map to which all maps were homogenised is the digital elevation model (DEM). This represented the most adequate scale to elabo-rate all data, optimizing the time required for data process-ing.
In order to apply the regional vulnerability assessment methodology, all the data used to represent vulnerability fac-tors and recepfac-tors in the case study area (Table 4) were first georeferenced with the same coordinate system, and then converted into raster (e.g. TIFF format). According to Pre-ston et al. (2008) data were pre-processed based on their dif-ferent initial format, as described below:
– data were conversed to a common spatial reference sys-tem (all data);
– raster data were resampled to 25 m resolution and the spatial extent was matched to that of the baseline grid (i.e. the DEM).
– Polygon data were converted to a 25 m resolution raster and the spatial extent was matched to the spatial extent of the base grid.
– Point data were used to interpolate a 25 m gridded sur-face using a spatial interpolation technique (e.g. nearest neighbour), using the spatial extent of the base grid. As remarked also in Preston et al. (2008), heterogeneity of data, pre-processing and conversion processes introduced un-certainty into the indicators. Consequently, an adequate res-olution of the resulting map should be selected in order to keep the error small.
With the aim to produce a qualitative ranking of vulnera-bility in the considered region visualized by means of relative vulnerability maps, all indicator data layers were assigned a vulnerability score and a weight, according to the procedure described in Sects. 3.2 and 3.3.
Vulnerability maps associated with each single vulnerabil-ity indicator were then aggregated according to the vulnera-bility functions described in Eqs. (1) and (2). The resulting vulnerability maps represent the bi-dimensional visualization and prioritization of vulnerable coastal units in relation to each single receptorj and the specific impactk. The use of GIS gives the opportunity to interrogate the intermediate and final maps through simple or elaborated queries, to calculate several statistics and to perform hot spot analysis.
Vulnerability statistics are useful to synthesize information coming from vulnerability maps and communicate the results of the analysis to stakeholders and decision makers. Relevant statistics include the analysis of receptor surface and percent-age that is associated with each vulnerability class in relation to each impact. Specific statistics can also be calculated in relation to other geographical/administrative units of interest (e.g. coastal municipalities or provinces and river basins).
The hot spot analysis allows the calculation of the GiZ score (Mitchell, 2005) in order to identify statistically signif-icant hot spots (i.e. clusters of cells with high vulnerability values) and cold spots (i.e. clusters of cells with low vulner-ability values). The GiZ score is therefore used to identify where cells with either high or low vulnerability values clus-ter spatially. The GIS tool implementing the GiZ score works by looking at each cell within the context of neighbouring cells. A cell with a high vulnerability value is interesting, but may not be a statistically significant hot spot. To be a sta-tistically significant hot spot, a cell should have a high vul-nerability value and be surrounded by other cells with high vulnerability values as well. The local sum for a cell and its neighbours is compared proportionally to the sum of all cells; when the local sum is much different than the expected local sum, and that difference is too large to be the result of random chance, a statistically significant GiZ score results (Mitchell, 2005).
Statistically significant positive GiZ scores (i.e. GiZ>+1.96) identify clusters of high vulnerability values (i.e. hot spot). The larger the GiZ score is, the more intense is the clustering of cells with high vulnerable values. GiZ scores ranging from−1.96 to +1.96 identify a general absence of clusters. Statistically significant negative GiZ scores (i.e. GiZ<−1.96) identify clusters with low vulnerability values (i.e. cold spot). The smaller the GiZ score is, the more intense is the clustering of cold spots.
The maps, the statistics and the results of the hot spot anal-ysis obtained for the assessment of coastal vulnerability to sea level rise, storm surge flooding and coastal erosion in the North Adriatic region are described and discussed in Sect. 4.
4 Results and discussion
Fig. 3.Vulnerability map for the wetland receptor to the sea level rise inundation impact on the North Adriatic coast(a)and in the north-ern Venetian Lagoon(b). Maps representing the hot spots analyzed in the northern Venetian Lagoon(c)and a detailed hot spot with its contributing vulnerability scores(d).
statistics for multiple coastal receptors (i.e. beaches, river mouths, wetlands, terrestrial biological systems, protected areas, urban and agricultural areas) in relation to each climate-related impact (i.e. sea level rise inundation, storm surge flooding and coastal erosion).
The relative vulnerability maps allow the bi-dimensional visualization of receptor vulnerability to each analyzed im-pact and permit the identification of the dominant factors (i.e. pathway, susceptibility or value factors), determining the fi-nal vulnerability value. The hot spot afi-nalysis permits the ver-ification of the statistically significant hot spots in the consid-ered region. Vulnerability statistics support the prioritization of receptors and the quantification of sub-areas that are more vulnerable to potential climate change impacts in the same region.
The application of the proposed regional vulnerability as-sessment methodology to the North Adriatic case allowed to produce 25 maps, representing the vulnerability (Vj,k) asso-ciated with each single receptorj in relation to the impact
k. In the following paragraphs, vulnerability maps, hot spots and statistics obtained for each analyzed impact and for rep-resentative coastal receptors will be described and discussed in more detail.
4.1 Sea level rise inundation impact
The application of the regional vulnerability assessment methodology and in particular of the Eq. (1) and (2) pro-posed in Sect. 3 allowed to calculate the vulnerability of all the receptors selected in the case study area (Table 3) to the sea level rise inundation impact.
A total amount of seven maps representing the vulnerabil-ity of each receptor to sea level rise inundation was produced. For each map the hot spot analysis was performed by cal-culating the GiZ score (Sect. 3.6). Furthermore, vulnerability statistics were calculated in order to evaluate the distribution of vulnerability classes to the sea level rise inundation impact for each analyzed receptor.
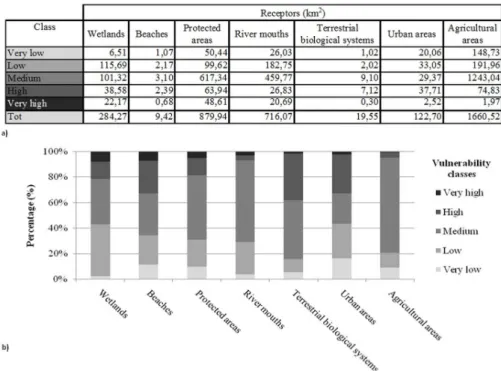
Fig. 4.Distribution of the territorial surface (km2)(a)and of the percentage of surface(b)associated with each vulnerability class for the receptors located on the North Adriatic coast for the sea level rise inundation impact.
Fig. 5.Vulnerability of wetlands to the sea level rise inundation impact: number of wetlands affected by higher vulnerability values in the case study area(a), according to the percentage of the territory of each wetland characterized by higher vulnerability values(b).
in order to ascertain what are the main vulnerability factors that contributed in determining the final vulnerability value.
According to the overall results of the hot spot analysis, the majority of the wetland cells experience GiZ score values between−1.96 and 1.96. This means that there is a limited presence of clusters characterized by relatively high or low vulnerability values. Some hot spot areas with positive GiZ score values higher than 1.96 (i.e. statistically significant vul-nerability hot spots) are concentrated in the northern part of the Venetian Lagoon and in the Grado and Marano Lagoons.
Moreover, some hot spots are spread in the southern part of the Po River Delta.
As shown in Fig. 3d, hot spot vulnerable areas are mostly located at the boarder of each wetland (i.e. in the spatial units adjoining to the water). By investigating underlying vulner-ability scores, it is possible to affirm that vulnervulner-ability hot spots mainly correspond to sub-areas of smaller wetlands (i.e. wetlands with lower extension), characterized by the ab-sence of artificial protections against sea level rise (Fig. 3d). Starting from vulnerability maps, several statistics were also calculated in order to communicate and synthesize in-formation coming from spatial vulnerability assessment. Fig-ure 4 shows the territorial surface of each receptor (km2)and the percentage of its total surface (%) associated with each vulnerability class related to the sea level rise inundation im-pact on the North Adriatic coast.
According to Fig. 4b, wetlands, beaches and protected ar-eas are affected by the highest percentages of the territory associated with very high vulnerability classes (i.e. from 5 to 8 %); these three receptors gained also a relevant percentage of the territory in the high and medium vulnerability classes (i.e. from 49 to 64 %).
Fig. 6.Vulnerability map for the beach receptor to the storm surge flooding impact on the North Adriatic coast(a)and in a specific area of the Po River Delta(b). Maps representing the hot spots analyzed in the zoomed area of the Po River Delta(c)and a detailed hot spot with its contributing vulnerability scores(d).
compared to river mouths and agricultural areas that, on the contrary, gained very high percentage values in the medium vulnerability class (i.e. from 64 to 75 %).
Among the vulnerability factors contributing to determin-ing higher vulnerability values to sea level rise inundation (Table 1a), the pathway factor “elevation” results to be the factor, which mainly contributed to determine the final vul-nerability score. Accordingly, most vulnerable sub-areas are often characterized by low topography. Another important factor that mostly contributed in determining the final vul-nerability score, particularly for shoreline receptors (i.e. wet-lands and beaches), is the absence or presence of artificial protections, which was categorized in the susceptibility do-main. In particular, the analysis of the distribution of artificial protections in the case study area allowed to identify vulner-able areas that lack measures of protection from sea level rise and may therefore require more extensive and urgent adapta-tion intervenadapta-tions. For what concerns the receptors with el-evated percentage of territory associated with medium vul-nerability class, in general, this is due to the fact that they gained medium vulnerability scores for the susceptibility and value vulnerability factors. Finally, a relevant percentage of
wetlands (i.e. 40 %) is affected by a low vulnerability class because they generally have a large extension (i.e. value fac-tor) that contributes in providing a low vulnerability score to the value vulnerability domain.
A specific statistic was also calculated for wetlands that were ranked as one of the receptors more vulnerable to sea level rise inundation in the case study area. The statistic was calculated starting from the vulnerability map presented in Fig. 3 and by means of specific spatial analysis GIS functions (e.g. layer intersection, zonal statistics).
Fig. 7.Distribution of the territorial surface (km2)(a)and of the percentage of surface(b)associated with each vulnerability class for the receptors located on the North Adriatic coast for the storm surge flooding impact.
Fig. 8.Vulnerability of beaches to the storm surge flooding impact: number of beaches affected by higher vulnerability values in the case study area(a), according to the percentage of the territory of each beach characterized by higher vulnerability values(b).
higher vulnerability values in the case study area. This can be a useful statistic to give an idea about the relevance of the potential consequences of sea level rise inundation impact on this receptor.
4.2 Storm surge flooding impact
Considering that the northern part of the Adriatic Sea showed the higher maxima extreme sea levels (i.e. up to 200 cm) compared to the rest of the eastern Mediterranean Basin (Tsimplis and Shaw, 2010), the regional vulnerability assess-ment methodology described in Sect. 3 was also applied for
the assessment of coastal vulnerability to the impact storm surge flooding. In this case, a total amount of seven vulner-ability maps of storm surge flooding was produced, one for each analyzed receptor (Table 1b).
The maps shown in Fig. 6 represent some pictures related to the vulnerability assessment (Fig. 6b) and to the hot spots analysis (Fig. 6c and d) of beaches of storm surge flooding. Beaches in the case study area are spread from the Timavo River mouth (municipality of Trieste, Friuli) to the Po River Delta in Veneto. Accordingly, there is the need to zoom the map in order to see the spatial distribution of vulnerability classes in the study area (Fig. 6b).
The results of the hot spot analysis showed a general pre-dominance of GiZ score values in the medium class (i.e. from −1.96 to 1.96), representing a general absence of clusters. However, a concentration of relatively high vulnerable areas (i.e. clusters with GiZscore>1.96) was observed in the Po River Delta area (Fig. 6c) and in the straight littoral zone between the Venetian and the Grado-Marano Lagoons. As shown in Fig. 6d, hot spots are generally characterized by proximity to the coastline, absence of artificial protections, scarcity of vegetation or presence of grassland and meadow, very low coastal slope and elevation, and medium or high environmental value.
Fig. 9.Vulnerability map for the river mouth receptor related to the coastal erosion impact on the North Adriatic coast(a)and in a specific area of the Po River Delta(b). Maps representing the hot spots analyzed in the zoomed area of the Po River Delta(c)and a detailed hot spot with its contributing vulnerability scores(d).
As shown in Fig. 7b, wetlands, beaches and terrestrial bio-logical systems are the receptors most affected by very high and high vulnerability classes, with percentage values rang-ing from 53 to 70 %. Protected, urban, agricultural areas and river mouths follow in the ranking with lower high and very high vulnerable percentages ranging between 4 and 27 %. These receptors are instead characterized by relevant per-centages of the territory in the medium vulnerability class (i.e. from 19.3 to 78 %).
Among the vulnerability factors selected to analyze coastal vulnerability to storm surge flooding (Table 1b), the pathway factors, elevation and distance from coastline, were very relevant in determining the final vulnerability values. Consequently, receptor units near the shoreline characterized by low elevation are often characterized by high vulnerability values. Other susceptibility factors that mainly contributed in determining the final vulnerability ranking are the presence or absence of artificial and natural protections (e.g. dams and dunes) and the coastal slope parameter. In particular, the lo-calization of receptor units with low coastal slope or without
natural or artificial protection could be relevant in order to identify areas where adaptation actions (e.g. beach nourish-ment, dune reconstruction or dike construction) should be more urgent.
A specific statistic was also calculated applying specific spatial analysis GIS functions (e.g. layer intersection, zonal statistics) to the 90 beaches that were identified in the case study area. As shown in Fig. 8, a total amount of 64 beaches (i.e. the 70 %) are affected by very high vulnerability values. In more detail, as shown in the histogram, 13/64 beaches (i.e. the 20 %) are characterized by high percentages of their ter-ritory (i.e. from 80 to 100 %), associated with very high vul-nerability class and may need priority of intervention.
4.3 Coastal erosion impact
Fig. 10.Distribution of the territorial surface (km2)(a)and of the percentage of surface(b)associated with each vulnerability class for the receptors located on the North Adriatic coast for the coastal erosion impact.
coastal erosion was applied to the coastal receptors located within 500 m from the North Adriatic shoreline (Fig. 9).
For this impact four maps were produced, one for each receptor that was considered as potentially vulnerable to coastal erosion (Table 1c).
The maps shown in Fig. 9 illustrate the main results ob-tained for the vulnerability assessment of river mouths to coastal erosion (Fig. 9b) and for the related hot spot analysis (Fig. 9c and d).
In the case study area, the receptor river mouth is basically represented by the Po River Delta, which is analyzed in more detail in Fig. 9b.
The overall results attained for the area of the Po River Delta highlighted a predominant presence of cells with GiZ score values ranging from−1.65 to +1.65 or with low GiZ score values (i.e.<−1.65). This situation is representative of a general absence of clusters and of a presence of some cold spots. Medium to high GiZ score values (i.e.>+1.96) were uniformly spread in the Po Delta area in some locations along the coastline, and generally represent eroding sub areas characterized by the absence of artificial protections, scarcity of vegetation cover or presence of grasslands and meadows, and geomorphological attributes more vulnerable to coastal erosion (e.g. presence of sandy or muddy coast).
Moreover, Fig. 10 represents the territorial surface (km2)
and the percentage of territory of each vulnerable receptor
that is associated with each vulnerability class in relation to the coastal erosion impact.
According to the ranking shown in Fig. 10b, beaches and wetlands are the receptors most affected by very high and high vulnerability classes, with percentage values ranging from 34 % to 27 %, respectively. Protected areas and river mouths are characterized by a percentage of territory ranging from 23 to 19 % within the very high and high vulnerability classes. Considering the medium vulnerability class, the per-centage of the four receptors varies from 18 % to 34 %.
For the coastal erosion impact, the final vulnerability scores are mainly due to the susceptibility factor of artificial and natural protections. These factors allow to distinguish areas that are more vulnerable to potential coastal erosion (i.e. areas without dams and dunes) from areas where the im-pacts associated with coastal erosion can be attenuated by the presence of natural or artificial protections. Another relevant factor for the assessment of receptor vulnerability to this im-pact is the sediment budget, which contributes in determining higher vulnerability scores to shoreline segments character-ized by eroding processes. Finally, higher vulnerable areas are often valuable environmental areas characterized by high scores for the value factor protection level.
A specific statistic was also calculated for the assessment of the vulnerability of coastal municipalities to the coastal erosion impact. As shown in Fig. 11, the vulnerability statis-tic represents the percentage of surface of each receptor (i.e. beaches, wetlands, protected areas and river mouths) that is affected by higher vulnerability values (i.e. very high and high vulnerability classes) in the RICE area of each munici-pality.
This statistic allows to make a ranking of coastal munici-palities based on the presence of highly vulnerable receptors and to identify what are the more vulnerable receptors for each municipality (e.g. wetlands and protected areas for Ari-ano nel Polesine and Porto Tolle).
Fig. 11.Percentage of the surface of each receptor (i.e. beaches, wetlands, protected areas and river mouths) affected by higher vulnerability value (i.e. very high and high vulnerability classes) for the coastal erosion impact in each coastal municipality.
The histogram shown in Fig. 11 can therefore be useful to investigate what are the coastal municipalities that could re-quire more attention in relation to the coastal erosion impact and to evaluate what are the receptors that may need more urgent adaptation measures to be protected from the adverse consequences of erosion (e.g. nourishment of beaches, con-struction of dikes).
5 Conclusions
The application of the regional vulnerability assessment methodology to the coastal area of the North Adriatic Sea led to a ranking of the relative vulnerability of each analysed receptor (i.e. beaches, river mouths, wetlands, terrestrial bi-ological systems, protected areas, urban and agricultural ar-eas) in relation to potential climate change impacts (i.e. sea level rise inundation, storm surge flooding and coastal ero-sion). The procedure proposed for the regional vulnerabil-ity assessment can effectively support decision makers in the spatial identification of the areas and targets characterized by different vulnerability levels and in the definition of manage-ment options useful to preserve the coastal receptors, which are potentially impacted by climate-related hazards at the re-gional scale.
The final vulnerability rankings are unitless numbers that judge the relative degree of receptor vulnerability to each analysed impact, in relation to qualitative vulnerability classes (i.e. very high, high, medium, low, very low). Con-sequently, higher vulnerability values do not imply high vul-nerability in absolute terms, but only compared to other case study receptors and sub-areas for a given impact.
Moreover, it is important to highlight that the final vul-nerability index is a summary number that aggregate scores coming from multiple heterogeneous parameters. The final decision-making process should therefore consider not only the final values of the index, but also the factors that con-tributed in determining that final vulnerability value (i.e. sus-ceptibility, pathway or value factors). A correct interpretation of these factors is particularly relevant for the analysis of the potential adaptation measures that could be suitable for re-ducing the vulnerability of current hot spot areas.
For what concerns the accuracy of the results coming from the vulnerability assessment process, it should be considered that the proposed methodology adequately takes into account the best available geographical information at the regional scale, thus requiring a great effort to deal with a huge amount of data at a detailed spatial resolution. An important issue is therefore related to the collection and organization of data coming from different sources into homogeneous formats for the whole case study area. Finally, it was necessary to per-form a huge pre-processing phase in order to manage data with different geographic coordinate systems, and to allow the GIS overlay and calculations. All these steps represent potential sources of uncertainty and of geometrical errors in the final vulnerability estimate.