www.nat-hazards-earth-syst-sci.net/14/3105/2014/ doi:10.5194/nhess-14-3105-2014
© Author(s) 2014. CC Attribution 3.0 License.
A probabilistic tsunami hazard assessment for Indonesia
N. Horspool1,2,*, I. Pranantyo3, J. Griffin1,2, H. Latief2, D. H. Natawidjaja4, W. Kongko5, A. Cipta6, B. Bustaman7, S. D. Anugrah8, and H. K. Thio9
1Geoscience Australia, Canberra, Australia
2Australia-Indonesia Facility for Disaster Reduction, Jakarta, Indonesia 3Institute of Technology Bandung, Bandung, Indonesia
4Indonesian Institute of Sciences, Bandung, Indonesia
5Indonesian Agency for the Assessment and Application of Technology, Yogyakarta, Indonesia 6Indonesian Geological Agency, Bandung, Indonesia
7Tsunami and Disaster Mitigation Research Centre, University Syiah Kuala, Banda Aceh, Indonesia 8Indonesian Agency for Meteorology, Climatology and Geophysics, Jakarta, Indonesia
9URS Corporation, Pasadena, California, USA *Now at GNS Science, Lower Hutt, New Zealand
Correspondence to: N. Horspool ([email protected])
Received: 17 March 2014 – Published in Nat. Hazards Earth Syst. Sci. Discuss.: 14 May 2014 Revised: 8 October 2014 – Accepted: 25 October 2014 – Published: 28 November 2014
Abstract. Probabilistic hazard assessments are a fundamen-tal tool for assessing the threats posed by hazards to com-munities and are important for underpinning evidence-based decision-making regarding risk mitigation activities. Indone-sia has been the focus of intense tsunami risk mitigation ef-forts following the 2004 Indian Ocean tsunami, but this has been largely concentrated on the Sunda Arc with little at-tention to other tsunami prone areas of the country such as eastern Indonesia. We present the first nationally consistent probabilistic tsunami hazard assessment (PTHA) for Indone-sia. This assessment produces time-independent forecasts of tsunami hazards at the coast using data from tsunami gener-ated by local, regional and distant earthquake sources. The methodology is based on the established monte carlo ap-proach to probabilistic seismic hazard assessment (PSHA) and has been adapted to tsunami. We account for sources of epistemic and aleatory uncertainty in the analysis through the use of logic trees and sampling probability density functions. For short return periods (100 years) the highest tsunami haz-ard is the west coast of Sumatra, south coast of Java and the north coast of Papua. For longer return periods (500–2500 years), the tsunami hazard is highest along the Sunda Arc, reflecting the larger maximum magnitudes. The annual prob-ability of experiencing a tsunami with a height of >0.5 m at the coast is greater than 10 % for Sumatra, Java, the Sunda islands (Bali, Lombok, Flores, Sumba) and north Papua. The
annual probability of experiencing a tsunami with a height of >3.0 m, which would cause significant inundation and fatalities, is 1–10 % in Sumatra, Java, Bali, Lombok and north Papua, and 0.1–1 % for north Sulawesi, Seram and Flo-res. The results of this national-scale hazard assessment pro-vide epro-vidence for disaster managers to prioritise regions for risk mitigation activities and/or more detailed hazard or risk assessment.
1 Introduction
Indonesia has the third highest population exposure to tsunami in the World, with an estimated 5.5 million people at risk of once-in-500-years tsunami (UNISDR, 2013; Lovholt et al., 2014). In the past 100 years alone, there have been 24 tsunami events that have caused fatalities totalling over 231 900 (with 226 900 in the Indian Ocean tsunami alone) (NGDC, 2013). Tsunami events have caused significant run-up, with many events exceeding 10 m in most parts of In-donesia (apart from Kalimantan), as can be seen by the his-torical run-up data in Fig. 1 (Latief et al., 2000).
Figure 1. Map showing the local sources (red lines, thin black text) used in the PTHA and historical tsunami run-up observations (coloured circles) from Latief et al. (2000) and the NOAA NGDC database. Geographic locations referred to in the text are in bold black font.
high-risk locations such as Padang, Denpasar and Cilacap (Kongko and Schlurmann, 2011; Strunz et al., 2011; Tauben-bock et al., 2013), which have included a large focus on preparing communities for tsunami evacuation. In addition, the creation of the Indonesian tsunami early warning system (InaTEWS) has provided a platform to disseminate warnings less than five minutes after an earthquake (Lauterjung et al., 2010; Steinmetz et al., 2010; Strunz et al., 2011), albeit with a scenario database that exists only for the Sunda Arc and not other parts of Indonesia. Despite this large amount of work, there is still no nationally consistent assessment of tsunami hazard or risk, as most of the previously mentioned work has focused on the Sunda Arc. On one hand this seems justified, as the Sunda Arc has the potential to host the largest earth-quakes that may cause tsunami that impact Indonesia; how-ever on the other hand, there has been more tsunami events in the past 100 years in eastern Indonesia than in western In-donesia (Latief et al., 2000; Lovholt et al., 2012a; NGDC, 2013), as shown in Fig. 1.
To effectively address and mitigate the hazard posed by tsunami, accurate and uniform information on tsunami haz-ard is required for the basis of risk studies to prioritise the implementation of mitigation measures. The probabilistic tsunami hazard assessment (PTHA) framework is one such method that allows broad scale assessments of tsunami haz-ard (Lin and Tun, 1982; Rikitake and Aida, 1988; Geist and Parsons, 2006; Thio et al., 2007; Burbidge et al., 2009; Power et al., 2012; Sorensen et al., 2012). Taking a probabilistic ap-proach for national and regional tsunami hazard assessments is favourable because it provides a geographically consis-tent, long-term assessment of the tsunami hazard, includes tsunami generated from multiple earthquake sources and in-corporates uncertainty in the model parameters (Thio et al., 2007). Furthermore, it provides the first step towards esti-mating probabilistic tsunami risk, which is critical for
under-pinning evidence-based decision-making about tsunami risk mitigation measures.
This paper presents the first national probabilistic tsunami hazard assessment for Indonesia. The outputs are long-term forecasts of tsunami hazard at the coast and are presented as tsunami hazard curves which describe the annual probability of exceeding a range of tsunami heights for sites around the coast of Indonesia. These hazard curves are then converted to hazard maps describing the tsunami height at the coast (1 m water depth) for a range of return periods and probability maps illustrating the annual probability of exceeding a set of given tsunami heights related to the warning thresholds of the Indonesian tsunami early warning system (InaTEWS). The tsunami hazard is also disaggregated to identify unit sources that contribute most to the tsunami hazard for a given coastal location, which can subsequently be used to select scenar-ios for detailed inundation modelling. Together, these results provide a nationally consistent assessment of tsunami haz-ard for Indonesia that can be used to underpin tsunami risk mitigation activities.
2 PTHA framework
The aim of a PTHA is to calculate the probability of exceed-ing a set of tsunami heights at the coast or near shore. This is accomplished by superposition of results from simulations of unit source tsunami to increase computation efficiency.
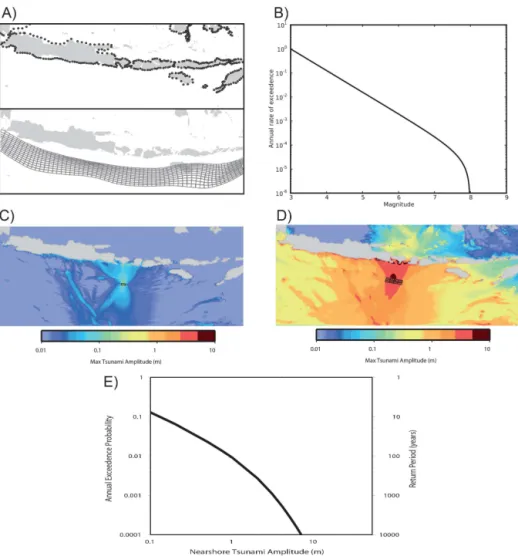
The PTHA framework can be summarised as follows: 1. Define tsunami sources (fault geometries) to be
in-cluded in the analysis (Figs. 1 and 2);
2. For each source discretize the fault into smaller sub-faults (Fig. 3a);
magnitude-frequency model (e.g. the exponential model of Guten-berg and Richter, 1994; the characteristic model of Schwartz and Coppersmith, 1984) (Fig. 3b);
4. For each subfault, calculate the seafloor deformation from 1 m of “unit slip” and propagate the tsunami from source to site (i.e. to the hazard points along the coast Fig. 3a) (Fig. 3c);
5. For each event in the synthetic catalogue, estimate the tsunami amplitude at the sites by summing the tsunami waveforms of all individual subfaults that make up that event, then scale the summed tsunami by the amount of slip for that event, assuming uniform slip (Fig. 3d); 6. Sum the probabilities of individual events exceeding a
range of pre-defined tsunami amplitudes (Fig. 3e); 7. Plot probability of exceedance vs. tsunami amplitudes
to generate a tsunami hazard curve for each hazard site (Fig. 3e).
In this assessment the hazard is defined as the tsunami wave amplitude, where the term amplitude is identical to wave height, keeping with common convention in the tsunami hazard literature.
2.1 Seismic sources
For this assessment only tsunami generated by submarine earthquakes are considered. While tsunami can be gener-ated from other mechanisms, such as submarine mass fail-ures, submarine and sub-aerial volcanic eruptions and me-teorite impacts, it is difficult to associate probabilities of such events, which prohibits including them in a probabilistic framework (Harbitz et al., 2014; ten Brink et al., 2014). Fur-thermore, the return period for significant tsunami generated by these alternative mechanisms is large (e.g.>5000 years, Brune et al., 2010), so they are unlikely to influence the hazard estimates for short return periods (100–2500 years), which are the main interest for this study. In addition, 92 % of tsunami observed in Indonesia in the past 100 years have been caused by submarine earthquakes. Consequently, in-cluding only earthquake sources captures most of the tsunami hazard (Latief et al., 2000).
Seismic sources of tsunami that could impact Indonesia are divided into local, regional and distant sources. While it is assumed the hazard for Indonesia will be dominated by local sources, regional and distant sources are included to provide an all-encompassing assessment of the tsunami haz-ard. Regional sources are those likely to provide short warn-ing times (less than a few hours), while distant sources are those that will have long warning times (many hours). Fur-thermore, this also enables a database of earthquake sources and tsunami events to be generated, which can be used for future tsunami inundation modelling or integration into the existing InaTEWS (Steinmetz et al., 2010).
Figure 2. Map showing regional and distant sources (red lines) used in the PTHA. The black box is the Indonesia region where the 1 arcmin bathymetry was used.
2.1.1 Local sources
20 local sources (Fig. 1 and Table 1) that represent subduc-tion megathrusts (e.g. Sunda Arc, North Papua and North Su-lawesi) and crustal faults are included in the local seismic source model. Crustal faults include submarine thrust faults (e.g. Flores back arc fault) and large submarine strike-slip faults that have an oblique rake component that may gener-ate tsunami (e.g. Sorong fault). The recurrence parameters for the local fault sources (excluding the maximum magni-tude,Mmax) are taken from the recent national probabilistic seismic hazard map for Indonesia (Irsyam et al., 2008, 2010) which represents the current state of knowledge about earth-quake recurrence in Indonesia. Furthermore, this maintains consistency in earthquake recurrence rates between the cur-rent national seismic and tsunami hazard maps. The reason for not using theMmax of Irsyam et al. (2010) is that the seismic hazard assessment for Indonesia has a less conser-vative estimation ofMmaxbased on instrumental catalogues. These may underestimate the maximum magnitude event due to their short records (e.g. 50 years) relative to actual re-currence intervals ofMmax, which may be 500–1000 years. Tsunami hazard assessments are much more sensitive to
Mmaxthan probabilistic seismic hazard assessment (PSHA) because tsunami heights do not saturate with increasing mag-nitude as seismic ground motions do (Thio et al., 2007). For the PTHA, a conservative approach was taken to assigning
de-Figure 3. Illustration showing the five main steps of PTHA. (a) Define hazard points near the coast where the tsunami hazard will be defined, and discretise each source zone into smaller subfaults. In this example the Sunda Arc is divided into 40 km×25 km subfaults. (b) Characterise the magnitude frequency distribution for earthquakes in each source and create a synthetic earthquake catalogue. (c) For each subfault (shown in black) simulate a tsunami with 1 m of slip, in this case, equivalent to aMw7.0 earthquake. (d) For all earthquakes in the synthetic catalogue, sum together the individual tsunami from the subfaults (shown in black) that make up that event, then scale by the slip value (in this case 8 m). (e) For each site in (a), combine the tsunami heights from all sources to calculate the probability of exceeding a given tsunami height.
rived from the scaling laws by Simons et al. (2011). The ap-proach used here of assigningMmaxbased on fault length is less subjective than using expert judgement. However, it is sensitive to the scaling law adopted.
The dip of seismic sources is a critical parameter in any tsunami modelling, since the resulting tsunami heights are sensitive to the fault dip (Geist, 1999, 2002; Lovholt et al., 2012b). The dip of local crustal faults was sourced from pub-lished estimates obtained from seismic reflection data (Rigg and Hall, 2012; Watkinson et al., 2011, 2012) and from the global CMT catalogue (Ekstrom et al., 2012). For the Sunda Arc, the fault geometry used by the InaTEWS was adopted to allow compatibility between the two tsunami databases (Babeyko et al., 2010; Strunz et al., 2011). The InaTEWS fault model for the Sunda Arc is based on the regionalised
Table 1. Earthquake sources used in the PTHA. Local sources are taken from Irsyam et al. (2008, 2010) and regional and distant sources are from Burbidge et al. (2008).
Number Source Source type Sense Dip Top Bottom Slip rate Mmax
(km) (km) (mm yr−1)
1 Alaska Subduction Thrust 8–13.2 3 50 55 9.1, 9.3, 9.5
2 Aleutians Subduction Thrust 15–16 3 50 50 9.1, 9.3, 9.5
3 East Mollucca Crustal Thrust 30 3 30 28 8.3, 8.5, 8.7
4 Flores Crustal Thrust 25–27 3 30 28 8.1, 8.3, 8.5
5 Honshu Subduction Thrust 14.7–22.2 3 50 85 8.9, 9.1, 9.3
6 Izu Subduction Thrust 22–32 3 50 55 8.9, 9.1, 9.3
7 Kuril islands Subduction Thrust 26–30 3 50 28 8.8, 9.0, 9.2
8 Makassar Crustal Thrust 25 3 20 11 7.3, 7.5, 7.8
9 Makran Subduction Thrust 8 3 50 21.5 8.9, 9.1, 9.3
10 Manila Subduction Thrust 21.8–30 3 50 30 8.7, 8.9, 9.1
11 Manokwari Crustal Thrust 20 3 20 10 7.8, 8.0, 8.2
12 Mariana Subduction Thrust 22–34.5 3 50 20 9.1, 9.3, 9.5
13 Nankai Subduction Thrust 10–15.4 3 50 60 9.1, 9.3, 9.5
14 North Papua Subduction Thrust 15 3 50 40, 60 8.6, 8.8, 9.0
15 North Sulawesi Subduction Thrust 22 3 50 20, 54 8.2, 8.4, 8.6
16 Palu-Koro Crustal Strike-slip 80 3 30 30, 35, 44 7.9, 8.1, 8.3
17 Philippines Subduction Thrust 33–45 3 50 50 8.8, 9.0, 9.2
18 Ryukyu Subduction Thrust 17.8–21.1 3 50 36 9.1, 9.3, 9.5
19 Semangko Crustal Strike-slip 85 3 30 5 7.6, 7.8, 8.0
20 Seram Subduction Thrust 20 3 50 40 7.9, 8.1, 8.3
21 South Seram Crustal Normal 30 3 20 11 7.8, 8.0, 8.2
22 Sula Crustal Strike-slip 85 3 30 8.5 7.9, 8.1, 8.3
23 Sulu Crustal Thrust 30 3 18 10 7.0, 7.2, 7.4
24 Sunda Arc Subduction Thrust 12–20 3 50 30 - 50 9.5 (8.3-9.5)
25 Sunda Strait Crustal Strike-slip 85 3 20 5 7.0, 7.2, 7.4
26 Timor Crustal Thrust 30 3 50 8, 15, 22 7.6, 7.8, 8.0
27 Tolo Crustal Thrust 30 3 20 9, 19 7.7, 7.9, 8.1
28 West Mollucca Crustal Thrust 30 3 30 13 8.3, 8.5, 8.7
29 West Sorong Crustal strike-slip 85 3 30 8.5 7.9, 8.1, 8.3
30 Wetar Crustal Thrust 30 3 30 15 8.0, 8.2, 8.4
31 Yap Subduction Thrust 41.5 3 50 10 8.4, 8.6, 8.8
32 Yapen Crustal Strike-slip 85 3 18 46 7.7, 7.9, 8.1
2.1.2 Regional and distant sources
The regional and distant source model is represented by twelve subduction megathrusts around the western and north-ern Pacific Ocean and the Makran subduction megathrust in the northwestern Indian Ocean. The subduction zone geome-try and recurrence rates were taken from the PTHA for Aus-tralia (Burbidge et al., 2008, 2009), which uses seismicity data to assign annual seismic moment rates to the plate inter-face. Sources in the eastern Pacific Ocean are assumed not to influence tsunami hazard for Indonesia, based on historical data and preliminary modelling.
2.2 Unit sources
Each source is discretised into rectangular subfaults prior to the tsunami summation calculation. The dimensions of the subfault represent the smallest magnitude considered in the
2.3 Unit source method
The use of unit sources have become increasingly popular for PTHA (Geist and Parsons, 2006; Thio et al., 2007; Burbidge et al., 2009; Power et al., 2012) and tsunami early warning systems (Titov et al., 2005; Greenslade et al., 2011) due to their computational efficiency at calculating the tsunami haz-ard for a large number of sites over a large area. The funda-mental assumption in using a unit source approach is that tsunami waves behave linearly in deep to moderate water depths (Thio et al., 2007). This assumption means that any tsunami can be constructed by the summation and scaling of smaller individual tsunami generated by each of the sub-faults that define the larger earthquake rupture (Fig. 3). This means that the computationally intensive tsunami propaga-tion models need only be computed once for each subfault. From these unit sources any number of earthquakes and re-sulting tsunami can be calculated efficiently by summing and scaling the tsunami time series from individual unit source tsunami.
Tsunami propagation simulations
Tsunami propagation modelling was carried out using the fi-nite difference code of Satake (1995), which solves the linear shallow water wave equation over a regular grid in spher-ical coordinates (WGS84 projection). This code has been used extensively for modelling tsunami scenarios (Ichinose et al., 2007; Fujii and Satake, 2006; Baba et al., 2008) and for PTHA (Thio et al., 2007; Burbidge et al., 2008, 2009). Tsunami propagation simulations were performed for 1 m of slip on each of the 4220 subfaults and run for a model time of 6 h for local sources and 24 h for regional and distant sources. The model allows a variable computational grid with a coarse master grid, and finer nested grids around areas of interest. The coarse grid (Fig. 2) has a spatial resolution of 3 arcmin and was derived from the 30 arcsecond general bathymetric chart of the oceans (GEBCO) model. For a region surround-ing Indonesia (Fig. 1), a 1 arcmin grid was used that was de-rived from a commercial 90 m resolution bathymetric data set from TCarta Marine. This is a commercial bathymetry data set combining Navy Charts, multibeam surveys and GEBCO data. A reflective boundary at the coast was used for the prop-agation modelling.
For each propagation simulation, tsunami time series were recorded at 3050 hazard points located at the 100 m water depth contour at approximately 5–10 km intervals around the Indonesia coastline. In water depths shallower than 100 m, non-linear terms in the shallow water wave equation can become important and the unit source approach can not be applied.
Since the goal of the study is to estimate the probabilis-tic tsunami hazard at the coast, we extrapolate the tsunami height from the 100 m water depth contour to the coast (1 m water depth) using Green’s Law. This approach has been used in Japan (Kamigaichi, 2009) and the Mediterranean (Sorensen et al., 2012) for similar studies. Kamigaichi (2009) demonstrated that extrapolation using Green’s Law was con-sistent with the mean offshore amplitude obtained when us-ing detailed non-linear modellus-ing on high-resolution grids for a case study in Japan.
2.4 Treatment of uncertainty
Incorporating uncertainties is a critical component of any probabilistic assessment. For this study there are two types of uncertainty that are dealt with: aleatory uncertainty and epistemic uncertainty. Aleatory uncertainty is the variability from randomness in a natural process and cannot be reduced with increasing knowledge. In PTHA, an example would be the variability of slip of a future tsunamigenic earthquake. Aleatory uncertainty can be accounted for by sampling from a probability density function (Bommer and Abrahamson, 2006). Epistemic uncertainty is the uncertainty stemming from our lack of knowledge about a natural process. Epis-temic uncertainty is often referred to as scientific uncertainty. With increased data and knowledge the epistemic uncertainty can theoretically be reduced to zero. An example of epis-temic uncertainty in PTHA is whether a subduction zone interface will only rupture in single segments or is able to rupture as a multi-segment rupture. Logic trees are a tool used to capture and quantify the epistemic uncertainty and are used widely in PSHA (Scherbaum et al., 2005; Bommer et al., 2005; Bommer and Abrahamson, 2006).
2.4.1 Epistemic uncertainties
Seismic Source Model
Recurrence
Model Slip Rate Mmax
Segmented
Not Segmented
Exponential
Characteristic
Fully locked
Published -1σ Published
Mmax + 0.2
Mmax - 0.2 Mmax
0.7
0.3
0.66
0.34
0.2
0.6
0.2
0.2
0.6
0.2
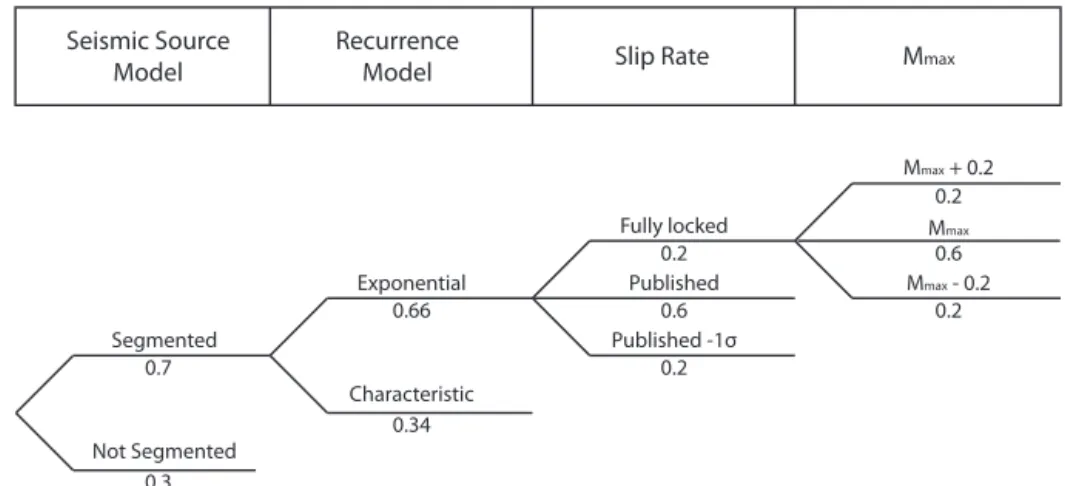
Figure 4. Schematic logic tree for seismic sources in the PTHA. The structure of the logic tree and weightings are for the Sunda Arc.
The Sunda Arc has a complex logic tree (Fig. 4 and Ta-ble 1) which reflects the different interpretations of the earth-quake mechanics of the megathrust. Two main branches rep-resent whether the Sunda Arc could (a) rupture in a single large rupture anywhere along the length of the megathrust (non-segmented model) assuming we do not have enough data to suggest this could not occur, or (b) rupture in seg-ments (segmented model), as observed by the recent Suma-tran megathrust earthquake sequence from 2004 to present (Natawidjaja et al., 2007; Chlieh et al., 2008; Sieh et al., 2008), where we assume ruptures are stopped by structural barriers in the subducting plate. For subsequent branches the maximum magnitudes are constrained by scaling laws (Blaser et al., 2010). For all logic trees, the maximum magni-tude from scaling laws is given a weighting of 0.6; two alter-native maximum magnitudes that are±0.2 magnitude units from the mean of the scaling law are given a weighting of 0.2. This allows uncertainty in the scaling law prediction error to be incorporated into the PTHA. Table 1 shows the source pa-rameters used in the logic trees with their associated weight-ing. To incorporate different expert opinion on the magnitude frequency distribution (MFD) shape for each source, two dif-ferent MFDs were used. For each source, a truncated Guten-berg–Richter MFD (Gutenberg and Richter, 1994) was given a weighting of 0.66 and a characteristic earthquake MFD (Schwartz and Coppersmith, 1984) was given a weighting of 0.34. Abvalue of 1.0 was used for both MFDs.
2.4.2 Aleatory uncertainties
There are three main sources of aleatory uncertainty in the PTHA: computational modelling uncertainty (σM),
uncer-tainty in the geometry of the sources (σD) and uncertainty
due to random slip distributions (σS) (Thio et al., 2007).
Un-certainty due to the aforementioned sources is described as the standard deviation of a log-normal distribution with a zero mean.
Modelling uncertainty can be described as errors in nu-merical models that are used to model seafloor displacement and tsunami propagation. By comparing tsunami waveforms from historical events to modelled waveforms of the event, an estimate of this uncertainty can be quantified. Thio (2012) estimated this uncertainty from validation of several well-constrained tsunami on the California coast and estimated a standard deviation (σM) of 0.345.
Uncertainty in the dip of the fault would normally be treated as an epistemic uncertainty, since increased knowl-edge of the fault geometry, for example from seismic reflec-tion data, could reduce the uncertainty of the dip. However, this would require recomputing the tsunami unit sources for each variation in dip which would make this approach more computationally intensive and may eliminate the benefit of using tsunami unit sources. Instead, the dip uncertainty is in-cluded as an aleatory uncertainty. Thio (2012) modelled a range of scenarios for a range of dip angles with a mean of 10◦and a standard deviation of 5◦, which resulted in a
stan-dard deviation of the tsunami height (σD) of 0.292.
The three sources of aleatory uncertainty are combined to compute a total sigma term (σtotal):
σt ot al = q
σM2 +σD2+σS2
=p0.3452+0.2922+0.2562, (1)
which results in aσtotalof 0.52.
2.5 Synthetic earthquake catalogue
Combining all the information from the source models and logic trees, a synthetic catalogue is generated which rep-resents the range of possible earthquake magnitudes, loca-tions and sources for every logic tree branch. The cata-logue was generated by iterating through each magnitude in the MFD, from the minimum magnitude of Mw7.0 to
Mmax, and calculating the rupture dimensions using the scal-ing laws for subduction zone earthquakes from Blaser et al. (2010) and crustal fault earthquakes from Wells and Copper-smith (1994). The rupture is then iteratively moved across the fault one subfault at a time until that magnitude has oc-curred on every possible location within the fault dimen-sions. For the megathrust sources, the subfault dimensions are 40 km×25 km for all depth ranges, which is approxi-mately a Mw7.0 earthquake; therefore the number of rup-tures would be equivalent to the number of subfaults. The maximum magnitude earthquake would occur once and rup-ture the whole fault if scaling laws have been used to con-strain the maximum magnitude. This iterative process en-sures that all magnitudes could occur at any possible location on the fault plane. For each event, the probability of that mag-nitude was then weighted by 1/n, wherenis the number of earthquakes represented by that magnitude. This ensures that the sum of the probabilities of all events of the same tude equals the annual probability of one event of that magni-tude in the MFD. For each event the average slip is calculated using the fault scaling laws of Blaser et al. (2010) for sub-duction zone earthquakes and from Wells and Coppersmith (1994) for crustal fault earthquakes. A total of 104 000 syn-thetic earthquakes were generated for the catalogue across the 32 fault sources. This implementation of a PTHA as-sumes that earthquakes follow a Poisson process; that is, they are time-independent. In a Poisson process, events vary by a mean recurrence time. This does not consider the pro-cess of time–space clustering of earthquakes such as after-shocks. In PSHA, Poisson models have been shown to be valid for intermediate to long-term hazard forecasts (Helm-stetter et al., 2006; Petersen et al., 2007), and can generally apply to PTHA because the source is also from earthquakes.
2.6 Probabilistic calculations
For each event in the synthetic catalogue, the tsunami hazard is calculated at each hazard point along the coast by sum-ming the tsunami unit source contributions from the subfaults
that make up that event and by scaling the tsunami height by the average event slip. For each site, this results in a list of tsunami heights (Hi) and associated annual probabilities
(Pi) for each event (i). For a range of given tsunami heights
(e.g.x= 0.1,0.2,0.3,0.5,1.0. . .30.0) we then compute the probability of exceeding that height by incorporating the modelled tsunami heights and the aleatory uncertainty term,
σtotal. The probability of exceeding a given tsunami height is as follows:
P (H > x|Hi)=
3σ Z
x
ftotal(u)du·Pi, (2)
whereftotal(u) is the PDF of the total aleatory uncertainty andPi is the earthquake probability for eventi. Next we can
calculate the rate at whichH > xfor all events (i) across all sources (n):
λ(H > x)=
n X
i
P (H > x). (3)
By plotting the probability of exceeding a range of tsunami heights (λ(H > x)), a tsunami hazard curve can be con-structed (Fig. 4) from which tsunami hazard maps and prob-ability maps can be generated by iterating over each hazard curve. This model assumes a memory-less Poisson process where earthquakes are time–independent and occur at a fixed probability over time.
3 Results
The results from the PTHA are developed into hazard curves, hazard maps, probability maps and disaggregation maps. The maps are all derivative products of the hazard curves and can be used to provide information on different aspects of the tsunami hazard. For instance, the hazard maps illustrate the tsunami height expected at the coast over a given return period and are useful for understanding the size of tsunami expected for a community over a fixed time. Probability maps define the probability of exceeding a given tsunami height at the coast, which is linked to threat thresholds in the InaTEWS system. This is useful for assessing the annual probability of experiencing a tsunami warning, particularly for prioritising areas most likely to experience tsunami that are a threat to life safety. Disaggregation maps define the rel-ative contribution of each source to the hazard at a particular site for a given return period or tsunami height. This infor-mation is extremely useful for identifying sources and select-ing scenario tsunami events for detailed tsunami inundation modelling.
3.1 Tsunami hazard curves
fundamen-Suma
tra
Java
Banda Kalimantan
Papua Sulawesi
tal output from the PTHA. The hazard curves are grouped to-gether according to the tsunami zones in Indonesia as defined by Latief et al. (2000) and are shown in Fig. 4.
The hazard curves in Western Indonesia show that the mean hazard for Sumatra and Java is of a similar magni-tude, however the spread of the hazard curves is larger for Sumatra. This reflects the site location of the hazard curves in the Sumatra zone, as some are located on the eastern coast of the Mentawai and Nias islands that are protected from tsunami originating to the west of these islands. Furthermore, the hazard curves on the west coast of the offshore islands have higher hazard than the west coast of Sumatra and the south coast of Java, as they are located adjacent to the Sunda Arc source. The Java hazard curves have a distinct bulge above the 0.001 annual probability (∼1000-year return
pe-riod). This is thought to be due to the influence of the maxi-mum magnitude events in the characteristic MFD which has a high probability for large characteristic earthquakes.
Figure 4. Tsunami hazard curves for the six tsunami zones as defined by Latief et al. (2000). Upper panel shows the location of the zones (black lines) and faults used in the PTHA (red lines). The grey curves show all the hazard curves (one for each site) in each zone, while the shading is a function of the density of the hazard curves. The red line represents the mean hazard curve for the zone weighted by the sample spacing between each coastal hazard curve location.
95˚ 100˚ 105˚ 110˚ 115˚ 120˚ 125˚ 130˚ 135˚ 140˚
−10˚ −5˚ 0˚ 5˚
0 2 4 6 8 10
Max Tsunami Amplitude (m)
Figure 5. Tsunami hazard map showing maximum tsunami amplitudes at the coast with a 1 in a 100 chance of being exceeded annually (∼100-year return period).
The Kalimantan zone (including the north coast of Java and the east coast of Sumatra) has the lowest tsunami hazard of any zone due to being remote from any major tsunami sources besides the north Sulawesi megathrust and the Makassar thrust in Sulawesi. These areas are also adja-cent to shallow (<200 m) epicontinental seas that will atten-uate tsunami more rapidly compared with deeper areas.
The hazard curves can be used to prioritise which areas in Indonesia have the highest tsunami hazard. The results show that eastern Indonesia has a similar tsunami hazard to western Indonesia at higher annual exceedance probabilities, whereas western Indonesia has a higher tsunami hazard at lower probabilities of exceedances.
3.2 Tsunami hazard maps
Hazard maps are generated for return periods of 100, 500 and 2500 years. Figure 5 shows the hazard map for the 100-year return period, indicating that the highest tsunami hazard is on the west coast of the Mentawai islands, offshore from the west coast of Sumatra. The maximum expected tsunami height at the coast of the Mentawai islands is 9 m. On the west coast of Sumatra the tsunami hazard ranges from 2 to 7 m, which is similar to the south coast of Java and the islands of Bali and Lombok. In eastern Indonesia, the north coast of Papua has the highest hazard at around 4 m for this return period; parts of the northern Molluccas and north Sulawesi have hazards of∼2 m.
95˚ 100˚ 105˚ 110˚ 115˚ 120˚ 125˚ 130˚ 135˚ 140˚ −10˚
−5˚ 0˚ 5˚
0 2 4 6 8 10 12 14 16 18 20
Max Tsunami Amplitude (m)
Figure 6. Tsunami hazard map showing maximum tsunami amplitudes at the coast with a 1 in 500 chance of being exceeded annually (∼500-year return period). Note the scale is different to Fig. 5.
95˚ 100˚ 105˚ 110˚ 115˚ 120˚ 125˚ 130˚ 135˚ 140˚ −10˚
−5˚ 0˚ 5˚
0 2 4 6 8 10 12 14 16 18 20 22 24 26 28 30 Max Tsunami Amplitude (m)
Figure 7. Tsunami hazard map showing maximum tsunami amplitudes at the coast with a 1 in 2500 chance of being exceeded annually (∼2500-year return period). Note the scale is different to Figs. 5 and 6.
Nias islands. The hazard along the north Papua coast, north-ern Sulawesi and northnorth-ern Molluccas is 10–12 m for this re-turn period, similar to that of the south coast of Java and the northwest coast of Sumatra, near Lampung and Aceh. Areas in the Banda Arc have a tsunami hazard ranging from 2 to 6 m, with sites adjacent to tsunami sources having a higher hazard.
The hazard for the 2500-year return period (Fig. 7) is clearly the highest along the Sunda Arc and is due to the strong contribution to the hazard from low probability events approachingMmax, such as the 2004 Indian Ocean tsunami. In eastern Indonesia, particularly north Papua and Sulawesi, the hazard has saturated because the maximum magnitude is onlyMw8.5, compared toMw9.5 along the Sunda Arc. The variation in hazards for different return periods is a reflection
of different activity rates and maximum magnitudes of the seismic sources.
−10˚ −5˚ 0˚ 5˚
Tsunami > 0.5 m
A
95˚ 100˚ 105˚ 110˚ 115˚ 120˚ 125˚ 130˚ 135˚ 140˚
−10˚ −5˚ 0˚ 5˚
Annual Probability
Tsunami > 3 m
B
1/1000 1/100 1/10
Figure 8. Annual probability of experiencing a tsunami with a height at the coast of (a) 0.5 m (a tsunami warning) and (b) 3 m (a major tsunami warning).
Mentawai and Nias islands and the very high tsunami haz-ard, this area clearly is of concern for tsunami mitigation ef-forts. In comparison, the south coast of Java has less variation along the coast due to the absence of offshore islands.
3.3 Tsunami probability maps
Tsunami probability maps, which illustrate the probability of exceeding a given tsunami height, are less common in PTHA but are useful for prioritising tsunami mitigation activities based on the likelihood of having a significant tsunami. The InaTEWS sets its warning thresholds at 0.5 m for a tsunami warning and 3.0 m for a major tsunami warning (Strunz et al., 2011). A major tsunami warning corresponds to an event that may cause land inundation and pose a serious threat to life and property safety. Therefore, tsunami probability maps are generated for these thresholds and are shown in Fig. 8.
Figure 8a shows that the probability of experiencing a tsunami with a height at the coast of 0.5 m or greater in any given year is over 10 % for many parts of Indonesia which have a seismic source nearby. The probability is the high-est along the Sunda Arc and slightly less in northern Su-lawesi and north Papua. The area around the Banda Sea has a
2 % probability of experiencing a 0.5 m tsunami in any given year.
The probability of experiencing a tsunami with a height at the coast greater than 3.0 m, which would trigger a major tsunami warning, varies along the Sunda Arc depending on whether offshore islands are present or not. The probability that the Mentawai and Nias islands would experience a 3.0 m or greater tsunami in any given year is 5 %, compared to less than 1 % for the west coast of Sumatra, including the city of Padang. However, it is noted that the tsunami hazard in Padang is considered to be much higher in the short-term if time dependence is captured (Taubenbock et al., 2013). Most parts of eastern Indonesia have a probability of around 1 % of experiencing a major tsunami warning in a given year, with the highest probability of 2–5 % occurring along the north coast of Papua and the northern Molluccas.
110˚
110˚
120˚
120˚
130˚
130˚ −10˚
−10˚ 0˚
0˚
6
12
18
24
30
Hazard Contribution
0 3 6 9 12 15 18 21 24 27 30 Hazard Contribution (%)
A
B
120˚
120˚
130˚
130˚
140˚
140˚
150˚
150˚
−10˚
−10˚ 0˚
0˚ 10˚
10˚ 20˚
20˚ 30˚
30˚ 40˚
40˚
6
12
18
24
30
Hazard Contribution
Figure 9. Hazard disaggregation for the 500-year return period at hazard sites in Mataram, Lombok island (a) and Jayapura, West Papua (b). The hazard contribution for each subfault is shown as bars and the hazard site is represented by a blue circle.
an extension of the InaTEWS to develop a scenario database for eastern Indonesia.
3.4 Hazard disaggregation
The PTHA methodology aggregates all possible tsunami events to generate tsunami hazard curves. The tsunami haz-ard can also be disaggregated by source and magnitude. Tsunami hazard disaggregation maps are developed to quan-tify how much each source contributes to the hazard for a single site and a single return period. They are useful for sce-nario event selection when detailed inundation modelling is undertaken. Figure 9 shows the tsunami hazard disaggrega-tion for two populous coastal cities, Jayapura in north Papua and Mataram in Lombok, for a return period of 500 years. The tsunami hazard is disaggregated for each subfault to show which contribute the most to hazard. This is useful to define where scenario events should be located for detailed
has a high slip rate, meaning that over the long time frames considered in PTHA, it will contribute as much to the hazard for Jayapura as the local New Guinea Trench.
For sites along the Sunda Arc the contribution is solely from the Sunda Arc megathrust. This contrasts with sites in eastern Indonesia where there are more local and regional sources, and the tsunami hazard comes from more than one source. Any detailed inundation modelling should use disag-gregation information for event selection to ensure that all significant source zones are covered in the analysis.
4 Discussion
This study represents the first attempt at developing a na-tionally consistent probabilistic tsunami hazard assessment for Indonesia, one of the most tsunami-prone countries in the World (UNISDR, 2013). This study represents the first iter-ation of a niter-ational tsunami hazard map, but there are many aspects that need to be considered and improved upon for fu-ture versions. Nonetheless, this study can be used to facilitate evidence-based decision-making on tsunami risk mitigation activities and priorities in Indonesia.
4.1 Underpinning tsunami risk mitigation
Until now, the majority of tsunami risk mitigation activities have been located along the Sunda Arc, due to a wealth of data on the earthquake history of the Sumatra megathrust (Natawidjaja et al., 2007; Brune et al., 2010; Kongko and Schlurmann, 2011; Strunz et al., 2011; Taubenbock et al., 2013). However, the tsunami event database from the Na-tional Geophysical Data Centre (NGDC), shows that in the past 100 years, removing the 2004 Indian Ocean tsunami event, there have been 3651 fatalities from tsunami in eastern Indonesia (from 15 events at a rate of 1 fatal tsunami every 6.5 years) compared to 1759 fatalities along the Sunda Arc (from 10 events at a rate of 1 fatal tsunami every 10 years). These data, and the results from the PTHA, provide evi-dence that the tsunami hazard in eastern Indonesia is as high as that along the Sunda Arc for return periods less than 1000 years. At return periods greater than 1000 years, the
Mmaxevents along the Sunda Arc dramatically increase the hazard for Java, Sumatra, Bali and Lombok. This highlights a clear need to include tsunami scenarios for eastern Indone-sia within the decision support system of InaTEWS, which would strengthen the early warning system in eastern Indone-sia, similar to that already established along the Sunda Arc (Steinmetz et al., 2010; Strunz et al., 2011), so that commu-nities can receive warnings for local and regional tsunami events that may impact them. Furthermore, the results from the PTHA can be used as a prioritisation tool to allow disaster managers to prioritise focus areas for tsunami risk mitigation activities.
4.2 Poisson model
The PTHA assumes earthquakes that generate tsunami fol-low a Poisson process; that is, they are time-independent. This assumption is fundamental in PSHA and PTHA and over the long-term is usually a valid approach. However, earthquake faults have been shown to interact on short time scales, and earthquake sequences are now being recognised (Sieh et al., 2008). For example, in Indonesia there is ev-idence of this through the recent Sumatra megathrust se-quence (Sieh et al., 2008), which started with the 26 Decem-ber 2004Mw9.15 Andaman earthquake and was followed by the 28 March 2005Mw8.6 Nias earthquake, the 12 Septem-ber 2007Mw8.5 Bengkulu earthquake, the 25 October 2010
Mw7.7 Mentawai earthquake and the 11 April 2012Mw 8.6 earthquakes off the coast of Sumatra. This clustering in space and time highlights that there may be a time de-pendence to this earthquake sequence. Over the short term (i.e. the next 10–50 years), time-dependent models may predict the tsunami hazard better; however, time-dependent tsunami models have yet to be developed. In PSHA, time-dependent models have been applied widely over the past 10 years (Wiemer, 2000; Gerstenberger et al., 2005). Re-sults suggest they perform better in short-term forecasting than time-independent models in California, where rigorous statistical testing has occurred (Helmstetter et al., 2006; Pe-tersen et al., 2007). However, the purpose of this PTHA is to provide a picture of the long-term tsunami hazard across Indonesia for the purpose of prioritising long-term risk mit-igation activities. In this case, assuming a time-independent (Poisson) model is a valid assumption. The recent sequence of Sumatran earthquakes could provide an opportunity to test the application of time-dependent models for tsunami hazard assessments.
4.3 Limitations
probabil-ities to such events which precludes incorporating them in a probabilistic analysis (Harbitz et al., 2014; ten Brink et al., 2014). However, in other areas around the world, landslides are now being assigned probabilities, for example in Califor-nia (Geist and Parsons, 2010). This work is promising and may allow landslides to be included in PTHA in the near fu-ture; however, this will require dealing with large uncertain-ties and the use of dispersive propagation models.
Since the 2004 Indian Ocean tsunami, the majority of tsunami hazard studies have focussed on Sumatra and to a lesser extent Java. A result of this focus is that the recur-rence rate of previous earthquakes has been well-studied, using coral uplift data above the trench (Natawidjaja et al., 2007; Sieh et al., 2008), current seismic slip deficit, and locking constrained from extensive GPS networks (Chlieh et al., 2008). Meanwhile, in Java and eastern Indonesia, sim-ilar studies are rare, and the recurrence rate and geometry of submarine faults is poorly constrained. As a result, the un-certainties are large for key parameters that tsunami hazard is sensitive to, such as slip rate and dip. More work is needed in this tectonically complex area and, as new data are available, it will improve the accuracy of tsunami and seismic hazard forecasts.
Uncertainty arising from random slip distributions is in-corporated into the PTHA by means of sampling a probabil-ity densprobabil-ity function. A better approach may be to include het-erogeneous slip by assigning different slip values to subfaults that are used for each event. While this approach would be more computationally intensive than the current implemen-tation, it would produce a more direct means of incorporating slip uncertainty.
Finally, an area of further research is the inclusion of “tsunami earthquakes” in PTHA. Tsunami earthquakes are earthquakes with large tsunami relative to the magnitude of the event. At present tsunami earthquakes are not treated any differently in the PTHA. However, there are ways of includ-ing these in future PTHA studies, for example by allowinclud-ing increase slip for earthquakes located on the shallow portion of the plate interface in areas where tsunami earthquakes are known to occur (e.g. Java Trench and Mentawai islands).
4.4 Testing of the PTHA
Since a PTHA is a statistical forecast of the future tsunami hazard, testing should be applied to rate the performance of these models (Geist and Parsons, 2006). In PSHA, statisti-cal testing has become common, with specific model testing facilities set up around the world to test different seismic haz-ard forecasts. In particular, the Collaboratory for the Study of Earthquake Predictability (CSEP) (Schorlemmer et al., 2007) is leading the way in setting up routine testing of seismic hazard models. The most important testing methods com-pare seismic hazard forecasts to empirical ground motion data, which ultimately tests the final PSHA model outputs rather than single components of the PSHA (Albarello and
D’Amico, 2008; Stirling and Gerstenberger, 2010). Future work should focus on rigorously testing PTHA models with observational data. However, given the limited amount of ob-servational data in most regions, it may be necessary to inte-grate over large areas to develop a large enough sample of observations for testing purposes.
5 Conclusions
This study developed the first national probabilistic tsunami hazard assessment for Indonesia and provides forecasts of long-term tsunami hazard at the coastline from earthquake sources. Results show that the annual probability of expe-riencing a tsunami with a height of>0.5 m at the coast is greater than 10 % for Sumatra, Java, Sunda islands (Bali, Lombok, Flores, Sumba) and north Papua. The annual prob-ability of experiencing a tsunami with a height of>3.0 m is 1–10 % in Sumatra, Java and north Papua, and 0.1–1 % for north Sulawesi, Seram and Flores. For long return pe-riod forecasts (2500-year return pepe-riod) the tsunami hazard is the highest along the coast exposed to the Sunda Arc (i.e. Mentawai and Nias islands, Sumatra and Java), where tsunami heights of 25–30 m are expected. Comparatively, eastern Indonesia has lower maximum tsunami hazard at the 2500-year return period, on the order of 12–20 m in Su-lawesi, Papua and Seram island. These results highlight that although the maximum tsunami hazard is higher in the Sunda Arc, the probability of experiencing a tsunami that could cause inundation and fatalities (coastal height of>3.0 m) is similar along the Sunda Arc and parts of eastern Indonesia such as north Papua and north Sulawesi. This warrants the extension of the InaTEWS decision support system scenario database to include eastern Indonesia. Furthermore, the re-sults from this study can be used to underpin tsunami risk as-sessments by highlighting high hazard areas where tsunami inundation modelling should be conducted.
Acknowledgements. This work was supported by the Indonesian National Disaster Management Agency (BNPB) and the Australian government through the Australia-Indonesia Facility for Disaster Reduction (AIFDR). Early versions of the manuscript benefited from comments by David Burbidge, Gareth Davies, David Robin-son and John Schneider. Some figures were generated using the generic mapping tools (GMT) package of Wessel and Smith (1998). This paper is published with the permission of the CEO of Geoscience Australia. The authors thank two anonymous reviewers whose comments helped improve the manuscript.
Edited by: B. D. Malamud
References
Albarello, D. and D’Amico, V.: Testing probabilistic seismic haz-ard estimates by comparison with observations: an example in Italy, Geophys. J. Int., 175, 1088–1094, doi:10.1111/j.1365-246X.2008.03928.x, 2008.
Baba, T., Mleczko, R., Burbidge, D., Cummins, P., and Thio, H.: The Effect of the Great Barrier Reef on the Propa-gation of the 2007 Solomon Islands Tsunami Recorded in Northeastern Australia, Pure Appl. Geophys., 165, 2003–2018, doi:10.1007/s00024-008-0418-5, 2008.
Babeyko, A. Y., Hoechner, A., and Sobolev, S. V.: Source model-ing and inversion with near real-time GPS: a GITEWS perspec-tive for Indonesia, Nat. Hazards Earth Syst. Sci., 10, 1617–1627, doi:10.5194/nhess-10-1617-2010, 2010.
Bassin, C., Laske, G., and Masters, G.: The Current Limits of Res-olution for Surface Wave Tomography in North America, EOS Trans. AGU, 81, F897, 2000.
Blaser, L., Kruger, F., Ohrnberger, M., and Scherbaum, F.: Scaling Relations of Earthquake Source Parameter Estimates with Spe-cial Focus on Subduction Environment, B. Seismol. Soc. Am., 100, 2914–2926, 2010.
Bommer, J. J. and Abrahamson, N. A.: Why Do Modern Prob-abilistic Seismic-Hazard Analyses Often Lead to Increased Hazard Estimates?, B. Seismol. Soc. Am., 96, 1967–1977, doi:10.1785/0120060043, 2006.
Bommer, J. J., Scherbaum, F., Bungum, H., Cotton, F., Sabetta, F., and Abrahamson, N. A.: On the Use of Logic Trees for Ground-Motion Prediction Equations in Seismic-Hazard Analysis, B. Seismol. Soc. Am., 95, 377–389, doi:10.1785/0120040073, 2005.
Brune, S., Babeyko, A. Y., Ladage, S., and Sobolev, S. V.: Landslide tsunami hazard in the Indonesian Sunda Arc, Nat. Hazards Earth Syst. Sci., 10, 589–604, doi:10.5194/nhess-10-589-2010, 2010. Burbidge, D., Mleczko, R., Thomas, C., Cummins, P., Nielsen, O.,
and Dhu, T.: A Probabilistic Tsunami Hazard Assessment for Australia, Geoscience Australia Professional Opinion 2008/04, Geoscience Australia, http://www.ga.gov.au (last access: 9 De-cember 2013), 2008.
Burbidge, D., Cummins, P., Mleczko, R., and Thio, H. K.: A Probabilistic Tsunami Hazard Assessment for Western Aus-tralia, in: Tsunami Science Four Years after the 2004 Indian Ocean Tsunami, edited by: Cummins, P., Satake, K., and Kong, L., Pageoph Topical Volumes, Birkhäuser Basel, 2059–2088, doi:10.1007/978-3-0346-0057-6_6, 2009.
Chlieh, M., Avouac, J. P., Sieh, K., Natawidjaja, D. H., and Galet-zka, J.: Heterogeneous coupling of the Sumatran megathrust constrained by geodetic and paleogeodetic measurements, J. Geophys. Res.-Solid, 113, B05305, doi:10.1029/2007JB004981, 2008.
Ekstrom, G., Nettles, M., and Dziewoaski, A.: The global CMT project 2004–2010: Centroid-moment tensors for 13,017 earthquakes, Phys. Earth Planet. Inter., 200–201, 1–9, doi:10.1016/j.pepi.2012.04.002, 2012.
Fujii, Y. and Satake, K.: Source of the July 2006 West Java tsunami estimated from tide gauge records, Geophys. Res. Lett., 33, L24317, doi:10.1029/2006GL028049, 2006.
Geist, E.: Complex earthquake rupture and local tsunamis, J. Geophys. Res., 107, ESE 2-1–ESE 2-15, doi:10.1029/2000JB000139, 2002.
Geist, E. and Parsons, T.: Probabilistic Analysis of Tsunami Haz-ards, Nat. HazHaz-ards, 37, 277–314, doi:10.1007/s11069-005-4646-z, 2006.
Geist, E. and Parsons, T.: Estimating the Empirical Probability of Submarine Landslide Occurrence, in: Submarine Mass Move-ments and Their Consequences, edited by: Mosher, D., Shipp, R., Moscardelli, L., Chaytor, J., Baxter, C., Lee, H., and Urgeles, R., vol. 28 of Advances in Natural and Technological Hazards Research, Springer Netherlands, 377–386, doi:10.1007/978-90-481-3071-9_31, 2010.
Geist, E. L.: Local tsunamis and earthquake source parameters, Adv. Geophys., 39, 117–209, 1999.
Gerstenberger, M., Wiemer, S., Jones, L., and Reasenberg, P.: Real-time forecasts of tomorrow’s earthquakes in California, Nature, 435, 328–331, doi:10.1038/nature03622, 2005.
Greenslade, D., Allen, S., and Simanjuntak, M.: An Evalua-tion of Tsunami Forecasts from the T2 Scenario Database, Pure Appl. Geophys., 168, 1137–1151, doi:10.1007/s00024-010-0229-3, 2011.
Gudmundsson, I. and Sambridge, M.: A regionalized upper mantle (RUM) seismic model, J. Geophys. Res.-Solid, 103, 7121–7136, doi:10.1029/97JB02488, 1998.
Gutenberg, B. and Richter, C.: Frequency of earthquakes in Califor-nia, B. Seismol. Soc.f Am., 34, 185–188, 1994.
Harbitz, C., Lovholt, F., and Bungum, H.: Submarine landslide tsunamis: how extreme and how likely?, Nat. Hazards, 72, 1341–1374, doi:10.1007/s11069-013-0681-3, 2014.
Helmstetter, A., Kagan, Y. Y., and Jackson, D. D.: Comparison of Short-Term and Time-Independent Earthquake Forecast Mod-els for Southern California, B. Seismol. Soc. Am. 96, 90–106, doi:10.1785/0120050067, 2006.
Henry, C. and Das, S.: The Mw 8.2, 17 February 1996 Biak, In-donesia, earthquake: Rupture history, aftershocks, and fault plane properties, J. Geophys. Res.-Solid, 107, ESE 11-1–ESE 11-16, doi:10.1029/2001JB000796, 2002.
Ichinose, G., Somerville, P., Thio, H. K., Graves, R., and O’Connell, D.: Rupture process of the 1964 Prince William Sound, Alaska, earthquake from the combined inversion of seismic, tsunami, and geodetic data, J. Geophys. Res.-Solid, 112, B07306, doi:10.1029/2006JB004728, 2007.
Irsyam, M., Asrurifak, M., Hendriyawan, Budiono, B., Triyoso, W., and Firmanti, A.: Development of spectral hazard maps for a pro-posed revision of the Indonesian Seismic Building Code, Ge-omech. Geoeng., 5, 35–47, doi:10.1080/17486020903452725, 2010.
Irsyam, M., Dangkua, D., Hendriyawan, Hoedajanto, D., Hutapea, B., Kertapati, E., Boen, T., and Petersen, M.: Proposed seis-mic hazard maps of Sumatra and Java islands and seis-microzonation study of Jakarta city, Indonesia, J. Earth Syst. Sci., 117, 865–878, doi:10.1007/s12040-008-0073-3, 2008.
Kamigaichi, O.: Tsunami Forecasting and Warning, in: En-cyclopedia of Complexity and Systems Science, edited by: Meyers, R. A., Springer-Verlag, Berlin, Heidelberg, 3–30, doi:10.1007/SpringerReference_60740, 2009.
Latief, H., Puspito, N., and Imamura, F.: Tsunami catalog and zones in Indonesia, J. Nat. Disast. Sci., 22, 25–43, 2000.
Lauterjung, J., Münch, U., and Rudloff, A.: The challenge of installing a tsunami early warning system in the vicinity of the Sunda Arc, Indonesia, Nat. Hazards Earth Syst. Sci., 10, 641–646, doi:10.5194/nhess-10-641-2010, 2010.
Lin, I. and Tun, C.: A preliminary investigation of tsunami hazard, B. Seismol. Soc. Am., 72, 2323–2337, 1982.
Lovholt, F., Glimsdal, S., Habitz, C., Horspool, N., Smebye, H., de Bono, D., and Nadim, F.: Global tsunami hazard and expo-sure due to large co-seismic slip, Int. J. Disast. Risk Reduc., doi:10.1016/j.ijdrr.2014.04.003, in press, 2014.
Lovholt, F., Kuhn, D., Bungum, H., Harbitz, C. B., and Glimsdal, S.: Historical tsunamis and present tsunami hazard in eastern Indonesia and the southern Philippines, J. Geophys. Res.-Solid, 117, B09310, doi:10.1029/2012JB009425, 2012a.
Lovholt, F., Pedersen, G., Bazin, S., Kuhn, D., Bredesen, R. E., and Harbitz, C.: Stochastic analysis of tsunami runup due to hetero-geneous coseismic slip and dispersion, J. Geophys. Res., 117, C03047, doi:10.1029/2011JC007616, 2012b.
Mader, C. L. and Gittings, M. L.: Numerical model for the Krakatoa hydrovolcanic explosion and tsunami, Sci. Tsunami Hazards, 24, 174–178, 2006.
Natawidjaja, D. H., Sieh, K., Galetzka, J., Suwargadi, B. W., Cheng, H., Edwards, R. L., and Chlieh, M.: Interseismic deformation above the Sunda Megathrust recorded in coral microatolls of the Mentawai islands, West Sumatra, J. Geophys. Res.-Solid, 112, B02404, doi:10.1029/2006JB004450, 2007.
NGDC: National Geophysical Data Center (NGDC WDS) Global Historical Tsunami Database, Boulder, CO, USA, available at: http://www.ngdc.noaa.gov/hazard/tsu_db.shtml, last access: 29 November 2013.
Petersen, M. D., Cao, T., Campbell, K. W., and Frankel, A. D.: Time-independent and Time-dependent Seismic Hazard Assess-ment for the State of California: Uniform California Earthquake Rupture Forecast Model 1.0, Seismol. Res. Lett., 78, 99–109, doi:10.1785/gssrl.78.1.99, 2007.
Power, W., Wang, X., Lane, E., and Gillibrand, P.: A Prob-abilistic Tsunami Hazard Study of the Auckland Region, Part I: Propagation Modelling and Tsunami Hazard Assess-ment at the Shoreline, Pure Appl. Geophys., 170, 1621–1634, doi:10.1007/s00024-012-0543-z, 2012.
Rigg, J. W. and Hall, R.: Neogene development of the Savu Forearc Basin, Indonesia, Mar. Petrol. Geol., 32, 76–94, doi:10.1016/j.marpetgeo.2011.11.002, 2012.
Rikitake, T. and Aida, I.: Tsunami hazard probability in Japan, B. Seismol. Soc. Am., 78, 1268–1278, 1988.
Satake, K.: Linear and nonlinear computations of the 1992 Nicaragua earthquake tsunami, Pageoph, 144, 455–470, 1995. Scherbaum, F., Bommer, J. J., Bungum, H., Cotton, F., and
Abra-hamson, N. A.: Composite Ground-Motion Models and Logic Trees: Methodology, Sensitivities, and Uncertainties, B. Seismol. Soc. Am., 95, 1575–1593, doi:10.1785/0120040229, 2005. Schorlemmer, D., Gerstenberger, M. C., Wiemer, S., Jackson, D. D.,
and Rhoades, D. A.: Earthquake Likelihood Model Testing, Seis-mol. Res. Lett., 78, 17–29, doi:10.1785/gssrl.78.1.17, 2007. Schwartz, D. and Coppersmith, K.: Fault behavior and
char-acteristic earthquakes: Examples from the Wasatch and San
Andreas Fault Zones, J. Geophys. Res., 89, 5681–5698, doi:10.1029/JB089iB07p05681, 1984.
Self, S., Rampino, M. R., Newton, M. S., and Wolff, J. A.: Volcanological study of the great Tambora erup-tion of 1815, Geology, 12, 659–663, doi:10.1130/0091-7613(1984)12<659:VSOTGT>2.0.CO;2, 1984.
Sieh, K., Natawidjaja, D. H., Meltzner, A. J., Shen, C.-C., Cheng, H., Li, K.-S., Suwargadi, B. W., Galetzka, J., Philibosian, B., and Edwards, R. L.: Earthquake Supercycles Inferred from Sea-Level Changes Recorded in the Corals of West Sumatra, Science, 322, 1674–1678, doi:10.1126/science.1163589, 2008.
Simons, M., Minson, S. E., Sladen, A., Ortega, F., Jiang, J., Owen, S. E., Meng, L., Ampuero, J.-P., Wei, S., Chu, R., Helmberger, D. V., Kanamori, H., Hetland, E., Moore, A. W., and Webb, F. H.: The 2011 Magnitude 9.0 Tohoku-Oki Earthquake: Mo-saicking the Megathrust from Seconds to Centuries, Science, 332, 1421–1425, doi:10.1126/science.1206731, 2011.
Sorensen, M. B., Spada, M., Babeyko, A., Wiemer, S., and Grunthal, G.: Probabilistic tsunami hazard in the Mediterranean Sea, J. Geophys. Res.-Solid, 117, B01305, doi:10.1029/2010JB008169, 2012.
Steinmetz, T., Raape, U., Teßmann, S., Strobl, C., Friedemann, M., Kukofka, T., Riedlinger, T., Mikusch, E., and Dech, S.: Tsunami early warning and decision support, Nat. Hazards Earth Syst. Sci., 10, 1839–1850, doi:10.5194/nhess-10-1839-2010, 2010. Stirling, M. and Gerstenberger, M.: Ground Motion-Based Testing
of Seismic Hazard Models in New Zealand, B. Seismol. Soc. Am., 100, 1407–1414, doi:10.1785/0120090336, 2010. Strunz, G., Post, J., Zosseder, K., Wegscheider, S., Mück, M.,
Riedlinger, T., Mehl, H., Dech, S., Birkmann, J., Gebert, N., Har-jono, H., Anwar, H. Z., Sumaryono, Khomarudin, R. M., and Muhari, A.: Tsunami risk assessment in Indonesia, Nat. Haz-ards Earth Syst. Sci., 11, 67–82, doi:10.5194/nhess-11-67-2011, 2011.
Taubenbock, H., Goseberg, N., Lymmel, G., Setiadi, N., Schlur-mann, T., Nagel, K., Siegert, F., BirkSchlur-mann, J., Traub, K.-P., Dech, S., Keuck, V., Lehmann, F., Strunz, G., and Klopfel, H.: Risk re-duction at the Last-Mile: an attempt to turn science into action by the example of Padang, Indonesia, Nat. Hazards, 65, 915–945, doi:10.1007/s11069-012-0377-0, 2013.
ten Brink, U., Chaytor, J., Geist, E., Brothers, D., and Andrews, B.: Assessment of tsunami hazard to the U.S. Atlantic margin, Mar. Geol., 353, 31–54, doi:10.1016/j.margeo.2014.02.011, 2014. Thio, H.: URS-PTHA: A Probabilistic Tsunami Hazard
As-sessment System, Misc. technical report, URS Corpo-ration, https://www.dropbox.com/s/u7m72dibhn1w7fo/ Thio2012-PTHA-Manual-v1.00.pdf?dl=0 (last access: 8 October 2014), 2012.
Thio, H., Somerville, P., and Ichinose, G.: Probabilistic analysis of strong ground motion and tsunami hazards in Southeast Asia, J. Earthq. Tsunami, 01, 119–137, doi:10.1142/S1793431107000080, 2007.
Tregoning, P. and Gorbatov, A.: Evidence for active subduction at the New Guinea Trench, Geophys. Res. Lett., 31, L12608, doi:10.1029/2004GL020190, 2004.
UNISDR: From Shared Risk to Shared Value – The Business Case for Disaster Risk Reduction, Global Assessment Report on Dis-aster Risk Reduction, United Nations Office for DisDis-aster Risk Reduction (UNISDR), Geneva, Switzerland, 2013.
Wang, R., Martin, F. L., and Roth, F.: Computation of deforma-tion induced by earthquakes in a multi-layered elastic crust: FORTRAN programs EDGRN/EDCMP, Comput. Geosci., 29, 195–207, doi:10.1016/S0098-3004(02)00111-5, 2003.
Watkinson, I., Hall, R., and Ferdian, F.: Tectonic re-interpretation of the Banggai-Sula-Molucca Sea margin, Indonesia, Geol. Soc. London, Spec. Publ., 355, 203–224, doi:10.1144/SP355.10, 2011.
Watkinson, I., Hall, R., Cottam, M., Sevastjanova, I., Suggate, S., Gunawan, I., Pownall, J., Hennig, J., Ferdian, F., Gold, D., Zim-mermann, S., Rudyawan, A., and Advokaat, E.: New insights into the geological evolution of Eastern Indonesia from recent research projects by the SE Asia Research Group, Berita Sedi-mentologi, 23, 21–27, 2012.
Wells, D. and Coppersmith, K.: New empirical relationships among magnitude, rupture length, rupture width, rupture area, and sur-face displacement, B. Seismol. Soc. Am, 84, 974–1002, 1994. Wessel, P. and Smith, W.: New, improved version of Generic
Map-ping Tools released, EOS Transactions of the American Geo-physical Union, 79, 579, 1998.