PERFORMANCE ANALYSIS OF A POLE AND TREE TRUNK DETECTION METHOD
FOR MOBILE LASER SCANNING DATA
M. Lehtomäki*, A. Jaakkola, J. Hyyppä, A. Kukko, H. Kaartinen
Finnish Geodetic Institute, Department of Remote Sensing and Photogrammetry, P.O. Box 15, 02431 Masala, Finland -
(matti.lehtomaki, anttoni.jaakkola, juha.hyyppa, antero.kukko, harri.kaartinen)@fgi.fi
Commission V, WG V/3
KEY WORDS: mobile laser scanning, feature extraction, pole, tree
ABSTRACT:
Dense point clouds can be collected efficiently from large areas using mobile laser scanning (MLS) technology. Accurate MLS data can be used for detailed 3D modelling of the road surface and objects around it. The 3D models can be utilised, for example, in street planning and maintenance and noise modelling. Utility poles, traffic signs, and lamp posts can be considered an important part of road infrastructure. Poles and trees stand out from the environment and should be included in realistic 3D models. Detection of narrow vertical objects, such as poles and tree trunks, from MLS data was studied. MLS produces huge amounts of data and, therefore, processing methods should be as automatic as possible and for the methods to be practical, the algorithms should run in an acceptable time. The automatic pole detection method tested in this study is based on first finding point clusters that are good candidates for poles and then separating poles and tree trunks from other clusters using features calculated from the clusters and by applying a mask that acts as a model of a pole. The method achieved detection rates of 77.7% and 69.7% in the field tests while 81.0% and 86.5% of the detected targets were correct. Pole-like targets that were surrounded by other objects, such as tree trunks that were inside branches, were the most difficult to detect. Most of the false detections came from wall structures, which could be corrected in further processing.
* Corresponding author
1. INTRODUCTION
1.1 Overview
Mobile laser scanning (MLS) has received growing interest in the remote sensing research community during the last decade. Typical systems consist of a moving platform, e.g., a car, and one or more laser scanners mounted on it together with a navigation system that utilises GNSS and inertial measurement technology. The dense point clouds collected with MLS can be used, e.g., in 3D city model generation, street planning and maintenance, noise modelling, and future driver assistance systems (Hofmann and Brenner, 2009). In the last years, a growing number of commercial MLS systems have been introduced (Petrie, 2010) including, among others, 3D Laser Mapping’s StreetMapper 360, Optech’s LYNX Mobile Mapper, and Riegl VMX-250.
MLS or vehicle-based laser scanning supplements the more traditional airborne (ALS) and static terrestrial (TLS) laser scanning technologies. MLS collects denser point clouds than ALS (0.5–50 points/m2 in ALS compared to, e.g., 100–5000 points/m2 in MLS) but can cover much larger areas than TLS efficiently. In addition to higher point density, the scanning geometry of MLS enables an accurate mapping of targets that are difficult to detect by ALS, such as poles and building façades. MLS has been applied to modelling of walls, ground, trees, and road surface (Zhao and Shibasaki, 2003; Früh et al., 2005; Goulette et al., 2006; Jaakkola et al., 2008). In addition, filtering of artifacts and segmentation of pavement (Hernández and Marcotegui, 2009), extraction of vertical walls (Rutzinger et al., 2009) and trees (Rutzinger et al., 2010), and detection of
poles and tree trunks (Hofmann and Brenner, 2009; Lehtomäki et al., 2010; Jaakkola et al., 2010) have been studied.
1.2 The Aims of the Study
Lamp posts, traffic signs, and tree trunks are common in road environment. Mapping of these vertical pole-like objects is important for several reasons and can be utilised in many applications. First, the objects stand out from the environment and therefore should be included in 3D city models. Secondly, an automatic pole detection method could be utilised in street maintenance when an inventory of poles, such as traffic signs and lamp posts, is needed. Thirdly, poles can be used as reference targets in applications such as georeferencing of MLS data and future driver assistance systems (Hofmann and Brenner, 2009).
The aim of the research was to study pole and tree trunk extraction methods in MLS data. Because of the huge amount of data that MLS can collect, the most important requirement for the methods was that they should be as automatic as possible. In addition, the algorithms should run in an acceptable time so that they could be applied in practice. The methods studied were described in (Lehtomäki et al., 2010) for the first time, in which first field tests were also conducted. In this paper, new results from a larger test area and a comparison to previous studies are reported.
1.3 Related Work
Most of the poles and tree trunks have a circular cross-section and could be detected by cylinder or cone extraction methods International Archives of the Photogrammetry, Remote Sensing and Spatial Information Sciences, Volume XXXVIII-5/W12, 2011
developed for TLS data (Marshall et al., 2001; Rabbani and van den Heuvel, 2005; Schnabel et al., 2007). In forestry applications, circular cross section (Aschoff and Spiecker, 2004; Bienert et al., 2007; Király and Brolly, 2007) or cylindrical shape (Haala et al., 2004) are often utilised in the detection of tree trunks from TLS data. However, in (Liang et al., 2008) and (Liang et al., 2009) no circularity assumptions are needed.
In MLS data, the lower point density compared to TLS and sometimes the noise in the measurements cause that only a part of the cylindrical targets has a cylindrical shape in the data. In addition, some poles have a rectangular horizontal cross-section. Therefore, a different approach was chosen in our study. A pole has a structure in the range data in which the close neighbourhood of the main axis of the pole contains several echoes. This dense elongated centre is surrounded by an almost empty space. A mask was constructed that detects this kind of pole-like structures. The mask is not applied blindly to the point cloud but first a segmentation of the data is performed. Both the scan line structure and shape of a pole are utilised in the segmentation to find point clusters that are good candidates for poles. Clusters are then tested with the mask, together with features calculated from the candidates, to separate poles from other point segments. In (Forsman, 2001) overlapping point groups are detected from horizontal scan lines to find vertical elongated objects. Cylinders are extracted by fitting circles to the point groups. Our segmentation method is similar to (Forsman, 2001), except that no circles are fitted. Lalonde et al. (2006) classify points based on the local point distribution. In our method, the classification of poles and trunks from the clusters with the mask uses similar ideas but instead of classifying individual points, whole clusters are treated at a time. Hofmann and Brenner (2009) use similar mask to ours to detect poles from MLS data. Previously, pole detection has been considered in MLS also in (Chen et al., 2007) and (Manandhar and Shibasaki, 2001).
2. MATERIALS AND METHODS
2.1 Equipment
Data used in this study was collected with the Roamer system (Road Environment Mapper) (Kukko et al., 2007). In Roamer, a phase-based Faro laser scanner is mounted, together with a navigation system, to a rigid platform that can be mounted on a car (figure 1). NovAtel SPANTM, that integrates GPS and inertial data, is used for navigation. The laser scanner has a maximum pulse repetition frequency (PRF) of 976 kHz. However, a PRF of 120 kHz was used in the tests reported in this paper. 2D scan lines or profiles are measured sequentially with a 320 degrees field of view (FOV) in the scanning plane while the movement of the vehicle gives the third dimension. The scanning plane can be vertical and perpendicular to the trajectory or it can be tilted backwards with various angles so that in addition to the surrounding road environment the surface of the road can be measured. The frequency of the mirror can be set between 3 and 61 Hz. For example, with 48 Hz frequency and 30 km/h driving speed the profile spacing in the driving direction is approximately 17 cm. In this study, the practical maximum measurement distance of the laser scanner was approximately 50 m. The absolute 3D accuracy of the collected data points is better than 5 cm in good GPS conditions. Accuracy has been evaluated in field tests using reference
targets. The relative accuracy between neighbouring points on scan lines is better than 1 cm.
Figure 1. The Roamer system consists of a rigid platform on which a laser scanner and a navigation system are mounted.
2.2 Test Areas and Data
The developed pole detection method was tested on two test sites (test areas A and B), both situated in Espoonlahti district at a suburban area in Espoo, Finland. In both test areas the mobile laser data was collected with the Roamer system by driving the road in one direction. The scanning plane was tilted 135° backwards. Only poles and tree trunks that were longer than 1 m and closer than 30 m to the trajectory were of interest. In addition, analysis for targets closer than 12.5 m to the trajectory was performed. 12.5 m was selected, because most of the reference targets (approximately 75%) in the test area A were in this range. In the test area B, 58% of the targets were in this range and for the sake of consistency the same range was used in both areas. In test area B, separate training and test sets were used to lessen the effect of possible overfitting of the parameters to the data. No separate training and test sets were used in the test area A but a validation of the method was performed to investigate a possible overfitting.
Test Area A. The first test site was a straight stretch of road whose length was approximately 450 m. Data was collected using a Faro LS 880HE80 laser scanner with 15 Hz mirror frequency in December 2007. Average driving speed and profile spacing were 20 km/h and 37 cm, respectively.
Reference was collected in the field by plotting targets manually on a city map. 173 targets were found in total and main classes were tree trunks (79), lamp posts (43), and traffic signs (37). Another reference, called data reference, was formed by selecting those field reference entries that could be identified as poles or trunks by a human operator in the mobile laser data. Data reference contained 148 targets and was used for the evaluation of the algorithm.
Test Area B: EuroSDR Project Test Site. In the second test area, the method was evaluated on a larger test set that was part of the test site of the EuroSDR project on “Road Environment Mapping Using Vehicle-Based Laser Scanning”. Data from the test site is available for companies and research organisations for testing their feature extraction methods on MLS data. The test area for the pole detection consisted of approximately 800 m of road with two crossroads (figure 2). The Faro Photon™ 80 scanner was used in the data collection. Data was collected with mirror frequencies of 30 and 48 Hz and in this study the 30 Hz International Archives of the Photogrammetry, Remote Sensing and Spatial Information Sciences, Volume XXXVIII-5/W12, 2011
data was used. Average driving speed was 30 km/h resulting in an average profile spacing of 28 cm.
The field reference was collected from static TLS measurements which covered the test area with a high point density. The reference contained more than 500 poles and tree trunks. The data reference was defined in the same way as in the test area A. It consisted of 429 targets and was divided into training and test sets (figure 2). Training set, which contained 99 targets, was used for the tuning of the parameters of the algorithm. The results reported below were achieved with the independent test set that contained 330 targets.
Figure 2. Trajectory of the scanner of the EuroSDR test site (red), and poles and tree trunks of the independent test set (blue
dots) and training set (green dots) of the test area B.
2.3 Methods
Pole detection is started by segmenting the data. The aim is to find point clusters that are good candidates for poles, that is, clusters that have a narrow and elongated shape. Then, clusters are further classified as correct targets (poles and tree trunks) and false targets. In the classification, a mask is used as a model of a pole. In addition, features are extracted from the clusters to improve the classification. (Lehtomäki et al., 2010).
Segmentation. When tilted scanning plane is used, typically several neighbouring profiles sweep narrow elongated objects (figure 3). The segmentation method makes use of the profile or row-column information of the laser data. The laser data can be arranged in a matrix whose columns, also called profiles or scan lines, consists of an ordered set of 3D points that are measured sequentially with one full period of the mirror. Therefore, each 3D point has two unique indices: the index of the profile it belongs to (column index) and its placement on the profile with respect to other points on the profile (row index).
First, individual scan lines are segmented independently applying connected component labelling. Neighbouring points are compared to each other and labelled with a same label if the distance between them is shorter than a threshold. The aim is to find possible sweeps of poles and therefore too long point groups are removed. It is also advantageous to remove groups that have too few points. Next, the remaining point groups are clustered by searching overlapping groups in the horizontal plane from neighbouring profiles. New groups are added to a cluster from next or previous profiles until no overlapping groups are found. The resulting clusters should be narrow and elongated and thus valid candidates for poles. Due to
shadowing effect some sweeps of a target may be missing and clustering may find two or more clusters that belong to a same target. Clusters are compared to each other and merged if they are approximately coaxial and close enough to each other.
Figure 3. Scanning geometry of Roamer when backwards tilted scanning plane is used. Even narrow pole-like objects receive several hits from neighbouring profiles. The scan line structure of the data is utilised in the segmentation process by searching short point groups that are on top of each other in neighbouring
profiles. (modified from (Kukko, 2009))
Extraction of Poles. A large number of candidates are found in the segmentation and only a part of them are correct targets. For example, building walls contain a lot of short point groups that form candidate clusters. Extraction of correct targets is done by calculating a set of features for each cluster and by selecting only clusters whose feature values satisfy predefined thresholds. In addition, a model of a pole is used in the extraction process. Features measure the length, shape and orientation of and number of sweeps in the cluster. The goal is to find poles that are 1 m long or longer. Principal component analysis, that gives the directions of the largest variances and corresponding variances (eigenvalues) for the point cluster, is utilised in the feature extraction. The length of the cluster is measured along the main axis of the cluster, i.e., the line that goes through the centre point of the cluster and is parallel to the direction of the largest variance. Shape of the cluster is measured by the ratio of the two largest eigenvalues; if the ratio is large the cluster’s shape is elongated and thus resembles the shape of a pole. The aim is to find approximately vertical objects and therefore clusters whose main axis is too tilted compared to vertical direction are removed. To lessen the number of false positives it is advantageous to demand that the cluster contains at least some minimum amount of sweeps on top of each other.
Poles with no vegetation or other disturbing objects around them should be elongated point clusters that are surrounded by empty space in the data. The candidates found from the walls do not generally fulfil this condition and can be removed using a mask that is placed around the cluster (figure 4). The mask that is a “model” of a pole consists of two coaxial cylinders whose axes coincide with the main axis of the cluster. The inner one of the cylinders is the smallest possible cylinder with the given main axis that contains all cluster points between the lower and upper end of the mask. Larger cylinder has, for example, 20–80 cm larger radius. If the number of points inside the outer cylinder is almost equal to the number of points inside the inner cylinder, there is an almost empty space around the cluster and the data fits the pole model.
Figure 4. A mask consisting of two coaxial cylinders is used as a model of a pole in the algorithm. The green volume surrounding the pole that is inside the purple cylinder should be
almost empty of points.
For example, the boards of the traffic signs and branches of a tree can be problematic if the mask is applied to the whole cluster. Therefore, clusters are checked by moving the mask in small steps from the bottom to the top of the cluster. The length of the mask is less than or equal to the minimum length of the target. At each step, the orientation and shape of the part of the cluster that is inside the inner cylinder is checked. If these features satisfy the thresholds and pole model fits the data the points inside the inner cylinder are classified as pole-like. Finally, all pole-like points of the cluster are merged and if the resulting merged cluster is long enough and contains enough sweeps it is classified as pole.
3. RESULTS
3.1 Test Area A
85.5% of the field reference targets could be identified as poles or tree trunks by the operator in the MLS data. The developed algorithm found (table 1; Lehtomäki et al., 2010) 77.7% of the data reference targets and 81.0% of the detected targets were correct. 76.1% of the tree trunks (67 in total), 93.0% of lamp posts (43), and 73.3% of the traffic signs (28) were detected. When the maximum distance to the trajectory was decreased to 12.5 m the detection rate and correctness raised to 83.5% and 86.5%, respectively.
No separate training and test sets were used and the parameters of the method were tuned and the method was tested by using the same data set. Therefore, the parameters may have been overfitted to the data and the detection accuracies may be too optimistic. However, based on a validation of the method (Lehtomäki et al., 2010) no severe overfitting seemed to exist.
3.2 Test Area B
74.3% of the targets of the field reference were also identified in the mobile data by a human operator. The algorithm detected (table 1) 69.7% of the test set targets while the correctness of the detection was 86.5%. 59.1% of the trees (127 in total), 82.3% of the traffic signs (79), and 95.7% of the lamp posts
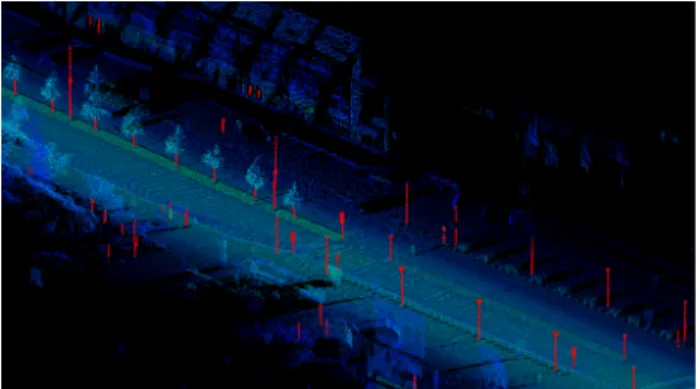
(46) were detected. From the targets closer than 12.5 m to the trajectory (190 in total), the method detected 71.6% and the corresponding correctness was 95.1%. A view to the data including extracted poles can be found in figure 5.
Statistical Number Area A Area B
Detection Rate (%) 77.7 69.7
Correct Detections (%) 81.0 86.5 Table 1. Results of the pole detection in the test areas A and B.
Targets that were visible in the MLS data, closer than 30 m to the trajectory and longer than 1 m were included. Results are for the whole data set in area A and for the independent test set
in area B.
Figure 5. A view to the MLS data of the EuroSDR project (small bluish-green dots) including extracted poles and tree
trunks (larger red dots).
3.3 Analysis of the Results and Comparison to Previous Studies
In both test areas, approximately half of the missed reference targets had points around the pole-like part that caused that the target did not fit the model of the pole. These were caused, e.g., by vegetation around the pole or branches around the trunk. Many targets were also missed because there were too few points in single sweeps. The corresponding point groups were discarded after scan line segmentation because the number of points did not exceed the threshold. There is a trade-off with this threshold parameter; if smaller groups are accepted, more correct targets are detected but at the same time more false positives are found. In addition, cars that are parked on the side of the road may sometimes cause the lower part of a pole or trunk to be missing in the data and this makes it more difficult for the algorithm to detect the target.
Most of the false positives were found in different building structures. Walls in which a narrow elongated part was facing the trajectory (e.g. separating walls between balconies), narrow corners in the walls (Lehtomäki et al., 2010) or narrow wall parts between windows and doors produced point clusters to the data that resembled poles. For the same reason also some billboards caused false detections.
The running times of the algorithm were approximately 13 and 24 minutes in the areas A and B, respectively. The methods were implemented with Matlab software. Using some more efficient language, such as C or C++, would probably speed up the algorithm considerably. The large difference in the computation times between the data sets was mostly due to the International Archives of the Photogrammetry, Remote Sensing and Spatial Information Sciences, Volume XXXVIII-5/W12, 2011
fact that more candidate clusters, whose processing takes most of the time, were found in the larger area B.
We found that the parameter values of the algorithm, tuned by evaluating the accuracy of the method with various value combinations, were very similar in both data sets, even though the mirror frequency was doubled in the test area B. The only parameter whose “best” values differed more clearly in the two data sets was the minimum group size after scan line segmentation. The best minimum group size was between 3 and 10 in the 15 Hz data and between 1 and 3 in the 30 Hz data. The difference is as could be expected because with higher mirror frequency the angular resolution is lower and therefore fewer points exist in single sweeps.
Hofmann and Brenner (2009) reported 94% correctness in their method while 81.0% and 86.5% of the targets our method extracted were correct. However, comparison is not straightforward. Firstly, they did not study the detection rate of the method. By adjusting the parameters of the method, there can be a trade-off between the number of extracted references and how many percent of the detected targets are correct. Secondly, the width of the test area in the direction perpendicular to the trajectory was not reported in their study. Due to the lower point density, targets farther away from the scanner are more difficult to detect. Lastly, the properties of the test site, data density and amount of noise can have a strong effect on the detection rate and correctness. For example, single buildings with suitable wall structures (see above) can cause a large number of false detections.
4. CONCLUSIONS
Mobile laser scanning supplements conventional laser-based mapping techniques; it produces more accurate and denser data than ALS and is much more efficient than TLS when large areas are mapped. Poles, such as traffic signs and lamp posts, and tree trunks can be considered as an important part of road infrastructure and environment. They stand out from the environment and can be used as reference targets in different applications. The aim of the research was to study the extraction of trees and poles in MLS data. MLS produces huge amounts of data and, therefore, the methods need to be as automatic as possible. In addition, the running times of the algorithms should be acceptable in the sense that the methods can be applied in practice.
An automatic pole and trunk detection method was tested in two suburban areas which were scanned with driving speeds of 20 and 30 km/h and with scanning frequencies of 15 and 30 Hz. The areas contained several hundred poles and tree trunks. For the range measurements, the phase-based Faro laser scanner was used with 120 kHz PRF and 320° FOV.
The detection rates were between 69 and 78% with targets closer than 30 m to the trajectory. A large part of missed targets, such as poles inside vegetation and tree trunks inside branches, had points around the pole or trunk that prevented the algorithm to detect it, even if the pole or trunk was well visible in the data. In this case, a cylinder or cone detection method with outlier removal might be applied.
False detection rates were between 13 and 19% with targets closer than 30 m to the trajectory. Most of the false detections came from different building structures. In addition, they were
above ground level, whereas all poles’ and tree trunks’ lower ends were on the ground. We plan to extract the buildings and ground in the future, also in order to gain improvement in the correctness of the pole detection method. The cause for several false detections was the fact that walls perpendicular to the trajectory were not always visible in the data. The visibility could be improved if two or more scanners were used with a proper configuration. This could also improve the visibility of poles and tree trunks in the data.
Our method can be adapted to handle multiple scanners, which is a common configuration in commercial MLS systems. For example, segmentation could be done separately for each scanner’s data. After that the clusters could be merged and the mask (figure 4) could be applied using the combined data set from all scanners. The scanning planes should not be close to vertical or parallel to driving direction in order to guarantee several overlapping sweeps from poles and to avoid mixing sweeps from poles with the sweeps from walls.
In the point of view of realistic 3D city modelling, it would be important to separate tree trunks from traffic signs, lamp posts and other poles. This is one of our future research topics.
ACKNOWLEDGEMENTS
This study was part of the “Development of Automatic, Detailed 3D Model Algorithms for Forests and Built Environment—Built” and 3D-NAVI-EXPO projects, both supported by the Finnish Funding Agency for Technology and Innovation (Tekes). The authors wish to thank X. Liang for the discussion about the development and testing of the method and L. Matikainen for the help with the terminology and evaluation of the method. The authors are also grateful for the reviewers for their suggestions to improve the manuscript.
REFERENCES
Aschoff, T.; Spiecker, H., 2004. Algorithms for the Automatic Detection of Trees in Laser Scanner Data. In: The International Archives of the Photogrammetry, Remote Sensing and Spatial Information Sciences, Freiburg, Germany, Vol. XXXVI, Part 8/W2, pp. 71–75.
Bienert, A.; Scheller, S.; Keane, E.; Mohan, F.; Nugent, C., 2007. Tree Detection and Diameter Estimations by Analysis of Forest Terrestrial Laserscanner Point Clouds. In: The International Archives of the Photogrammetry, Remote Sensing and Spatial Information Sciences, Espoo, Finland, Vol. XXXVI, Part 3/W52, pp. 50–55.
Chen, Y.-Z.; Zhao, H.-J.; Shibasaki, R., 2007. A Mobile System Combining Laser Scanners and Cameras for Urban Spatial Objects Extraction. In: Proceedings of the Sixth International Conference on Machine Learning and Cybernetics, Hong Kong, China.
Forsman, P., 2001. Three-Dimensional Localization and Mapping of Static Environments by Means of Mobile Perception. PhD Thesis, Helsinki University of Technology, Espoo, Finland.
Früh, C.; Jain, S.; Zakhor, A., 2005. Data Processing Algorithms for Generating Textured 3D Building Façade International Archives of the Photogrammetry, Remote Sensing and Spatial Information Sciences, Volume XXXVIII-5/W12, 2011
Meshes from Laser Scans and Camera Images. Int. J. Comput. Vis., 61, pp. 159–184.
Goulette, F.; Nashashibi, F.; Abuhadrous, I.; Ammoun, S.; Laurgeau, C., 2006. An Integrated On-Board Laser Range Sensing System for On-the-Way City and Road Modelling. In:
The International Archives of the Photogrammetry, Remote Sensing and Spatial Information Sciences, Paris, France, Vol. XXXVI, Part 1.
Haala, N.; Reulke, R.; Thies, M.; Aschoff, T., 2004. Combination of Terrestrial Laser Scanning with High Resolution Panoramic Images for Investigations in Forest Applications and Tree Species Recognition. In: The International Archives of the Photogrammetry, Remote Sensing and Spatial Information Sciences, Dresden, Germany, Vol. XXXIV, Part 5/W16.
Hernández, J.; Marcotegui, B., 2009. Filtering of Artifacts and Pavement Segmentation from Mobile LiDAR Data. In: The International Archives of the Photogrammetry, Remote Sensing and Spatial Information Sciences, Paris, France, Vol. XXXVIII, Part 3/W8, pp. 329–333.
Hofmann, S.; Brenner, C., 2009. Quality Assessment of Automatically Generated Feature Maps for Future Driver Assistance Systems. In: Proceedings of the 17th ACM SIGSPATIAL International Conference on Advances in Geographic Information Systems, Seattle, Washington, USA, pp. 500–503.
Jaakkola, A.; Hyyppä, J.; Hyyppä, H.; Kukko, A., 2008. Retrieval Algorithms for Road Surface Modelling Using Laser-Based Mobile Mapping. Sensors, 8, pp. 5238–5249.
Jaakkola, A.; Hyyppä, J.; Kukko, A.; Yu, X.; Kaartinen, H.; Lehtomäki, M.; Lin, Y., 2010. A Low-Cost Multi-Sensoral Mobile Mapping System and Its Feasibility for Tree Measurements. ISPRS Journal of Photogrammetry and Remote Sensing, 65, pp. 514–522.
Király, G.; Brolly, G., 2007. Tree Height Estimation Methods for Terrestrial Laser Scanning in a Forest Reserve. In: The International Archives of the Photogrammetry, Remote Sensing and Spatial Information Sciences, Espoo, Finland, Vol. XXXVI, Part 3/W52, pp. 211–215.
Kukko, A.; Andrei, C.-O.; Salminen, V.-M.; Kaartinen, H.; Chen, Y.; Rönnholm, P.; Hyyppä, H.; Hyyppä, J.; Chen, R.; Haggrén, H.; Kosonen, I.; Čapek, K., 2007. Road Environment Mapping System of the Finnish Geodetic Institute—FGI Roamer. In: The International Archives of the Photogrammetry, Remote Sensing and Spatial Information Sciences, Espoo, Finland, Vol. XXXVI, Part 3/W52, pp. 241– 247.
Kukko, A., 2009. Road Environment Mapper—3D Data Capturing with Mobile Mapping. Licentiate’s Thesis, Helsinki University of Technology, Espoo, Finland.
Lalonde, J.-F.; Vandapel, N.; Huber, D.F.; Hebert, M., 2006. Natural Terrain Classification Using Three-Dimensional Ladar Data for Ground Robot Mobility. J. Field Robot., 23, pp. 839– 861.
Lehtomäki, M.; Jaakkola, A.; Hyyppä, J.; Kukko, A.; Kaartinen, H., 2010. Detection of Vertical Pole-Like Objects in
a Road Environment Using Vehicle-Based Laser Scanning Data. Remote Sensing, 2, pp. 641–664.
Liang, X.; Litkey, P.; Hyyppä, J.; Kaartinen, H.; Vastaranta, M.; Holopainen, M., 2009. Automatic Stem Location Mapping Using TLS for Plot-Wise Forest Inventory. In: Proceedings of the SilviLaser 2009, College Station, TX, USA.
Liang, X.; Litkey, P.; Hyyppä, J.; Kukko, A.; Kaartinen, H.; Holopainen, M., 2008. Plot-Level Trunk Detection and Reconstruction Using One-Scan-Mode Terrestrial Laser Scanning Data. In: Proceedings of the International Workshop on Earth Observation and Remote Sensing Applications, Beijing, China, pp. 1–5.
Manandhar, D.; Shibasaki, R., 2001. Feature Extraction from Range Data. In: Proceedings of the 22nd Asian Conference on Remote Sensing, Singapore.
Marshall, D.; Lukacs, G.; Martin, R., 2001. Robust Segmentation of Primitives from Range Data in the Presence of Geometric Degeneracy. IEEE Trans. Pattern. Anal. Mach. Intell., 23, pp. 304–314.
Petrie, G., 2010. Mobile Mapping Systems—An Introduction to the Technology. Geoinformatics, 13(1), pp. 32–43.
Rabbani, T.; van den Heuvel, F., 2005. Efficient Hough Transform for Automatic Detection of Cylinders in Point Clouds. In: The International Archives of the Photogrammetry, Remote Sensing and Spatial Information Sciences, Enschede, the Netherlands, Vol. XXXVI, Part 3/W19, pp. 60–65.
Rutzinger, M.; Oude Elberink, S.; Pu, S.; Vosselman, G., 2009. Automatic Extraction of Vertical Walls from Mobile and Airborne Laser Scanning Data. In: The International Archives of the Photogrammetry, Remote Sensing and Spatial Information Sciences, Paris, France, Vol. XXXVIII, Part 3/W8, pp. 7–11.
Rutzinger, M.; Pratihast, A. K.; Oude Elberink, S.; Vosselman, G., 2010. Detection and Modelling of 3D Trees from Mobile Laser Scanning Data. In: The International Archives of the Photogrammetry, Remote Sensing and Spatial Information Sciences, Newcastle upon Tyne, UK, Vol. XXXVIII, Part 5, pp. 520–525.
Schnabel, R.; Wahl, R.; Klein, R., 2007. Efficient Ransac for Point-Cloud Shape Detection. Comput. Graph. Forum, 26, pp. 214–226.
Zhao, H.; Shibasaki, R., 2003. Reconstructing a Textured CAD Model of an Urban Environment Using Vehicle-Borne Laser Range Scanners and Line Cameras. Mach. Vis. Appl., 14, pp. 35–41.