RESEARCH ARTICLE
Genome-Wide Specific Selection in Three
Domestic Sheep Breeds
Huihua Wang☯, Li Zhang☯, Jiaxve Cao, Mingming Wu, Xiaomeng Ma, Zhen Liu,
Ruizao Liu, Fuping Zhao, Caihong Wei*, Lixin Du*
Institute of Animal Sciences, Chinese Academy of Agricultural Sciences, Beijing, People’s Republic of China, Beijing, China
☯These authors contributed equally to this work. *[email protected](CW);[email protected](LD)
Abstract
Background
Commercial sheep raised for mutton grow faster than traditional Chinese sheep breeds. Here, we aimed to evaluate genetic selection among three different types of sheep breed: two well-known commercial mutton breeds and one indigenous Chinese breed.
Results
We first combined locus-specific branch lengths anddistatistical methods to detect candi-date regions targeted by selection in the three different populations. The results showed that the genetic distances reached at least medium divergence for each pairwise combina-tion. We found these two methods were highly correlated, and identified many growth-related candidate genes undergoing artificial selection. For production traits,APOBRand FTOare associated with body mass index. For meat traits,ALDOA,STK32BandFAM190A
are related to marbling. For reproduction traits,CCNB2andSLC8A3affect oocyte develop-ment. We also found two well-known genes,GHR(which affects meat production and qual-ity) andEDAR(associated with hair thickness) were associated with German mutton merino sheep. Furthermore, four genes (POL,RPL7,MSL1andSHISA9) were associated with pre-weaning gain in our previous genome-wide association study.
Conclusions
Our results indicated that combine locus-specific branch lengths anddistatistical
approaches can reduce the searching ranges for specific selection. And we got many credi-ble candidate genes which not only confirm the results of previous reports, but also provide a suite of novel candidate genes in defined breeds to guide hybridization breeding.
a11111
OPEN ACCESS
Citation:Wang H, Zhang L, Cao J, Wu M, Ma X, Liu Z, et al. (2015) Genome-Wide Specific Selection in Three Domestic Sheep Breeds. PLoS ONE 10(6): e0128688. doi:10.1371/journal.pone.0128688
Academic Editor:Qin Zhang, China Agricultrual University, CHINA
Received:January 9, 2015
Accepted:April 29, 2015
Published:June 17, 2015
Copyright:© 2015 Wang et al. This is an open access article distributed under the terms of the
Creative Commons Attribution License, which permits unrestricted use, distribution, and reproduction in any medium, provided the original author and source are credited.
Data Availability Statement:All data underlying the findings in the study are freely available in the manuscript and supplemental files.
Funding:This research was supported by the National Key Technology R&D Program of China (2011BAD28B05-2)(http://www.most.gov.cn/eng/ index.htm). LZ received funding from the Chinese Academy of Agricultural Sciences(2014ywf-yb-7) (http://en.gscaas.net.cn/). The funder had collected and analyzed data, and decided to publish.
Introduction
China is the largest mutton producer in the world. According to 2012 statistics from the Food and Agriculture Organization of the United Nations, China accounts for almost one third of
the world's yield of mutton (http://faostat.fao.org/). One reason for this is that there are a large
number of Muslim and Mongolian residents in China and mutton is their main meat source. Meanwhile, more and more people of Han Chinese like eating mutton. As the status of mutton increases, so the deficit in the domestic supply of mutton also increases and the annual amount imported becomes ever larger. China does not have its own commercial mutton sheep breed, and the average meat production capacity of traditional Chinese breeds is lower compared with other countries. Therefore, development of a special Chinese sheep breed for meat pro-duction is needed.
Meat production traits have significant economic importance. Hybridization can quickly improve the meat quality of Chinese sheep, but cannot stabilize the inheritance of desirable traits. Identification of genomic regions that influence meat performance would enable improvement of local Chinese varieties by cross-breeding. This would have very real signifi-cance, not only to improve the weakness in Chinese mutton production, but also to improve to mutton production throughout the world.
To mine for genome selection information, the selection signal method has become popular.
For the specific selection of genomic regions, pairwise FST, combined with a haplotype
approach, such as REHH (Relative extended haplotype homozygosity), XPEHH (Cross
popula-tion extended haplotype homozygosity)[1] or RSB (Across pairs of populations)[2] can
deter-mine the selection from a population when dealing with two groups. But it is relatively
complex for multi-groups. Global FST, applied to multiple groups, cannot determine which
breeds have undergone selection. At present, there are two better methods, locus-specific
branch lengths (LSBL) anddi, which detect the locus specific divergence for each breed.
LSBL is generally suitable for three or four groups [3], whereasdiis suitable for three or more
groups [4].
In our previous study, we identified candidate genes associated with growth and meat pro-duction traits by using Illumina Ovine SNP50 BeadChip technology and genome-wide associa-tion study (GWAS) methodology to analyze three sheep populaassocia-tions including one indigenous
Chinese sheep breed and two well-known commercial mutton sheep breeds [5]. Here we also
applied these data to identify artificial selection regions using LSBL anddistatistics.
Materials and Methods
Population samples and quality control
We analyzed SNP (Single-nucleotide polymorphism) data from our previous GWAS [5]. A
total of 322 sheep from three breeds, including 61 Chinese Mongolian fat-tailed (CMF), 161 German Mutton Merino (GMM) and 100 African white Dorper (AWD) sheep were analyzed. There were not any family structure and half sib family in the selected sheep. Two SNP sets were used. First, SNPs that did not pass the following three criteria were excluded: (1) SNPs
with minor allele frequency>0.01; (2) Hardy–Weinberg EquilibriumP-value>0.000001; (3)
SNPs that were located on autosomes. After quality control, there were 322 individuals and 46,752 SNPs in the genetic diversity analysis dataset. The first SNP set was then pruned using the indep-pairwise option, with a non overlapped window size of 25 SNPs, a step of 5 SNPs,
and pairwise r2threshold of 0.1, resulting in 10,260 independent SNP markers. The second
Population analyses
Principal component analysis (PCA) was conducted using snpStats in R (http://cran.r-project.
org). We constructed two neighbor-joining trees. One of uncorrected p-distances for
individu-als using SplitsTree software [6] and one of pairwise FSTfor populations using R package
ape[7].
Statistical analyses
We first calculated pairwise FSTfor each locus of first SNP set between breeds using Genepop
4.2.2 software [8]. Neighbor-joining tree breed-specific population differentiation within
300 kb windows across the 26 autosomes was calculated using Locus-specific branch lengths
(LSBL) [3] anddistatistics [4]. As described in Shriver et al. 2004 [3], LSBL (LGMM, LAWD,
LCMF) were calculated from single locus pairwise FSTdistances, where LGMM= (GMM-AWD
FST+ GMM-CMF FST−AWD-CMF FST)/2, LAWD= (GMM-AWD FST+ AWD-CMF FST
−GMM-CMF FST)/2 and LCMF= (GMM-CMF FST+ AWD-CMF FST−GMM-AWD FST)/2.
Akey et al. [4] first described how to calculatedistatistics for each SNP;di=Pj6¼i
FSTij E F½ STij sd F½ STij ,
whereE FSTij
andsd FijST
denote the expected value and standard deviation of pairwise FST
val-ues between breeds i and j calculated from all SNPs. Only windows with a minimum of three
SNPs were considered. For each breed, windows of significance were determined as those with
LSBL ordivalues falling into the 99thpercentile of the empirical distribution.
Gene annotation
We used the latest sheep genome releaseOvis_aries_v3.1 (http://www.livestockgenomics.csiro.
au/sheep/oar3.1.php) to identify relationships between significant selection windows and ovine genes. Owing to the structural imperfection and incomplete sheep genome sequence (before October, 2012), we also referenced genomic information of other species such as human, cow, mouse and rat.
Results
Population stratification
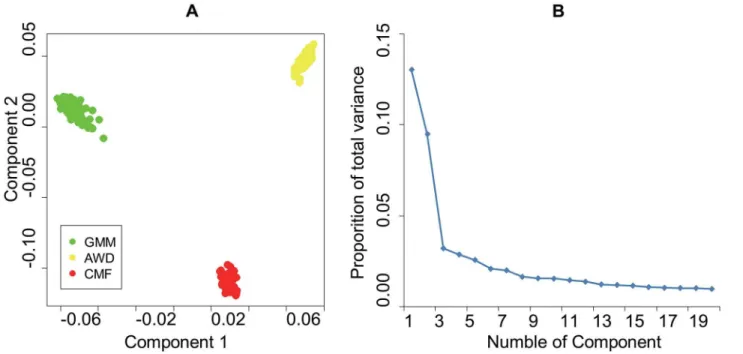
In the present study, we first performed principal component analysis on a pruned set of 10,260 genome-wide SNPs, to characterize the pattern of individual clustering in the sample
set. As shown inFig 1, PC1 (which accounts for 13.01% of the total variance) and PC2 (which
accounts for 9.47% of the total variance) both separate all three population samples from each
other, as the same with the former study[5].
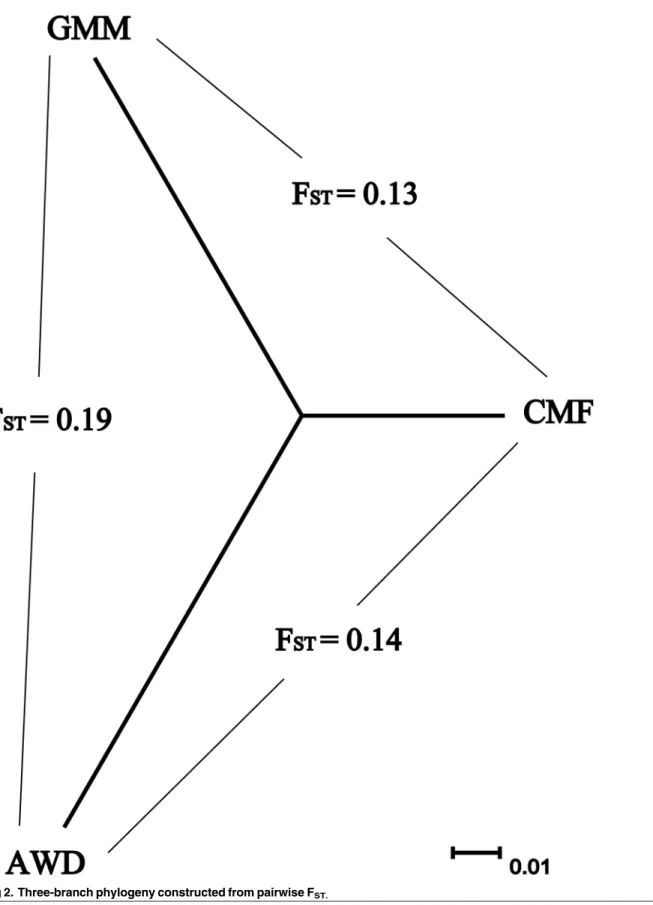
We then calculated pairwise FST[9] for the SNP data generated from the three sheep
popu-lation samples (Fig 2). According to Wright’s theory [10], we found medium divergence (FST=
0.13, FST= 0.14) between CMF and GMM or AWD populations respectively, and high
diver-gence (FST= 0.19) between AWD and GMM populations. We constructed a simple
three-branch phylogeny from pairwise FSTvalues (Fig 2) and also a neighbor-joining (NJ) tree
among the individuals (S1 Fig). The results clearly showed that there were no conflicts
con-cerning the origins of individuals assigned to each breed.
Correlation of two locus specific analysis approaches
Locus-specific branch lengths (LSBL) [3] anddistatistics [4] are both summary statistical
unbiased estimates of pairwise FST[11]. LSBL is suited to the analysis of three populations, and
diis preferred for analysis of more than three populations. When the populations number is
three, both approaches can be used. In this study, we calculated genome-wide LSBL anddi
val-ues. The maximal LCMFand dCMFvalues were higher than those of the other two breeds
(Table 1). Obviously, the mean LAWDand LGMMwere higher than LCMF, and branch lengths of
AWD and GMM were longer than those of CMF (Table 1,Fig 2). In other words, the CMF
breed shows more loci having shorter LSBL compared with the other two breeds. Histograms
of the distribution of LSBL anddistatistics for each breed are shown inFig 3. AWD and GMM
have similar LSBL distributions. But GMM and CMF are similardistatistics distributions.
Fur-ther, we used Pearson’s product-moment correlation to estimate the correlation between LSBL
anddistatistics within each breed. All three breeds showed significant correlation
(P-value<2.2e-16) between the two approaches. The correlations for AWD (r = 0.85) and GMM
(r = 0.84) were higher than that for CMF (r = 0.68).
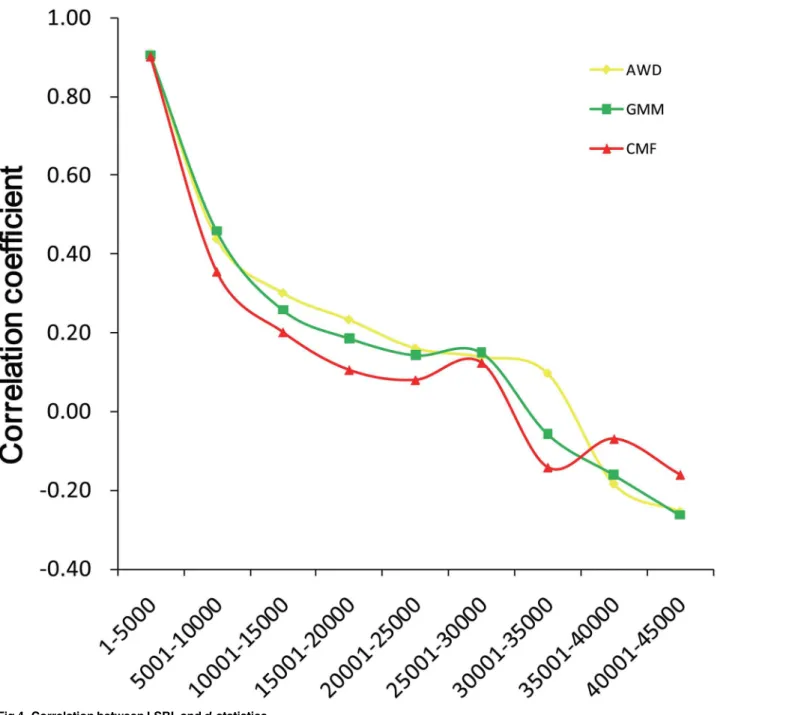
We also investigated the correlation between LSBL anddistatistics in 5000 SNPs in bin
order, from high to low of LSBL value (Fig 4). The highest correlation (r>0.9) occurred in the
region of the top 1–5000 SNPs in all breeds. The correlation values then sharply declined in the top 5001–10000 SNPs.
Detecting breed specific selection regions
For each breed, we performed two locus-specific analyses to identify candidate regions involved in selection. These two statistical methods were calculated for autosomal SNPs in 300 kb windows, with a minimum of three SNPs per window, and defining the populations by breed. In total, 46,752 SNPs were evaluated within 7734 windows, ordered from 1 to 7734, averaging 5.97 SNPs per window (SD = 1.6). We defined candidate selection regions as those
that fell into the upper 99thpercentile of the empirical distribution. Within each breed, 78
win-dows were considered putative signatures of selection.S1 Figshows the genome-wide
distribu-tion of the two analyses. In total, 259 of the windows met this criterion under both approaches Fig 1. A. Animals clustered on the basis of principal component (PC) analysis using individual genotypes B. Scree-plot of proportion of variance.
Fig 2. Three-branch phylogeny constructed from pairwise FST.
doi:10.1371/journal.pone.0128688.g002
Table 1. The descried of LSBL anddivalues for each breed
Value Mean(SD) Min Max
LAWD 0.079(0.13) -0.113 0.838
LGMM 0.071(0.13) -0.125 0.914
LCMF 0.045(0.10) -0.083 0.940
dAWD -0.003(1.62) -1.859 9.728
dGMM -0.012(1.61) -1.809 10.1
dCMF -0.010(1.46) -1.785 11.352
doi:10.1371/journal.pone.0128688.t001
Fig 3. Histogram of the LSBL anddistatistics distribution for each breed.
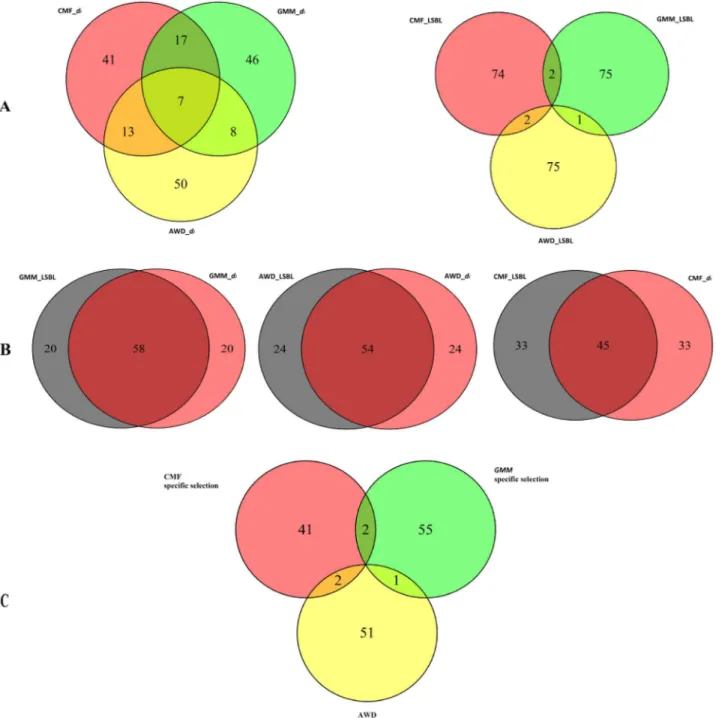
in three breeds. Venn Diagrams were produced for the three breeds for LSBL anddi,
respec-tively (Fig 5A). The numbers of overlapping windows for LSBL were fewer than for thedi
approach. This indicates that LSBL has a greater ability to detect specific selection thandi.
To detect breed specific selection regions for each breed, we merged the window lists gener-ated by these two approaches to identify three subsets of 54 (AWD), 58 (GMM) and 45 (CMF)
windows that showed the strongest signature of selection by displaying both high LSBL anddi
values (Fig 5B). Because the correlation of CMF is lower than that of AWD and GMM, the
number of overlapping windows for CMF is smaller than for the other breeds. Finally, there were also five overlapping windows in the final selected windows that were selected in two
breeds (Fig 5C).
Fig 4. Correlation between LSBL anddistatistics.
doi:10.1371/journal.pone.0128688.g004
Fig 6shows LSBL anddivalues of-SNPs in five overlapping selection windows and in two
nearby windows. The plot of LSBL values shows three clusters in each window. But these
clus-ters are not clear indiwindows. All overlapping windows include 23 SNPs. Then we
investi-gated the diversity of these SNPs. The distribution of genotypes for each SNP in the three
breeds shows a stepladder, two extreme types and one middle type (S3 Fig).Fig 7illustrates a
representative SNP (OAR13_67857725.1) in window 5305. There is clearly a large difference in Fig 5. A. Former: Venn diagram of selection windows fromdiapproach in three breeds, Latter: Venn diagram of selection windows from LSBL approach in
three breeds; B. Venn diagrams of each breed’s selection windows from LSBL anddiapproaches; C. Venn diagram of specific selection windows in three
breeds.
genotype proportion between AWD and CMF; therefore, the overlapping selection window means the two breeds, which have overlapping selection, are different in this region and maybe one or both has undergone selection.
Gene annotation
We used the latest sheep genome release,Ovis_aries_v3.1 (http://www.livestockgenomics.csiro.
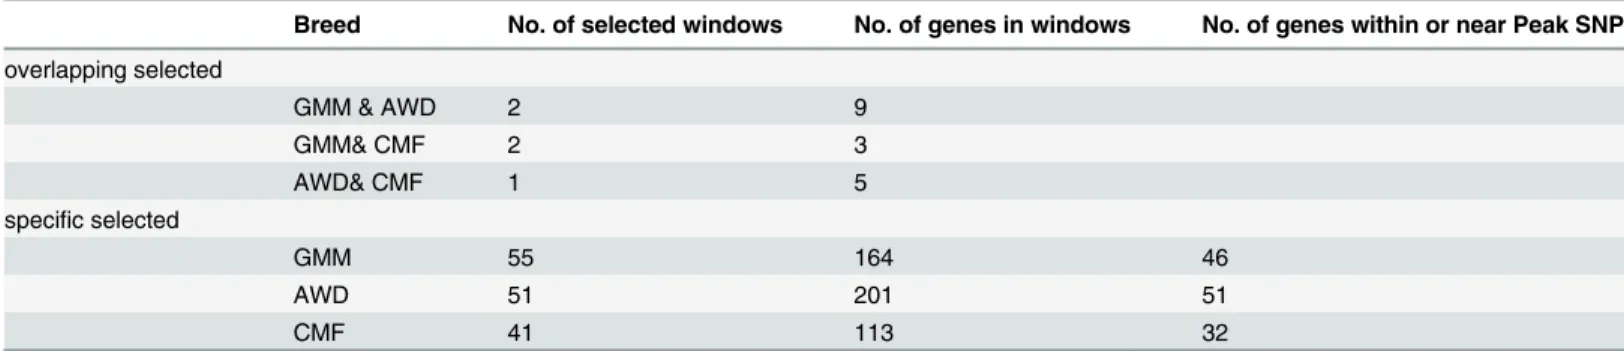
au/sheep/oar3.1.php), to identify relationships between significant selection windows and ovine genes. We removed uncharacterized genes and genes that overlapped among the three breeds. In total, 478 non-overlapping selected genes were annotated and 164, 201and 113 were
selected in GMM, AWD and CMF breed, respectively (Table 2). Because of selective sweep or
hitchiking effort, the effect of a strongly selected allele at one locus on the frequencies of neutral
alleles at a linked locus, fewer genes were in fact selected[12]. We performed a further screen
for each selection window. We selected genes located in or near a peak value SNP in each selec-tion window. At last, we got 46, 51 and 32 candidate genes for GMM, AWD and CMF breed,
respectively (Table 2,S1,S2andS3Tables). We did not screen overlapping windows.
Specific selection genes in each breed
Here we identified many selection genes for each breed. We focused on production, meat, reproduction and health traits because these are highly valued traits in mutton sheep Fig 6. The two statistic of per-SNP of three regions with three consecutive windows, the selected widows in the middle, GMM: green dot, AWD: yellow dot, CMF: red dot.
doi:10.1371/journal.pone.0128688.g006
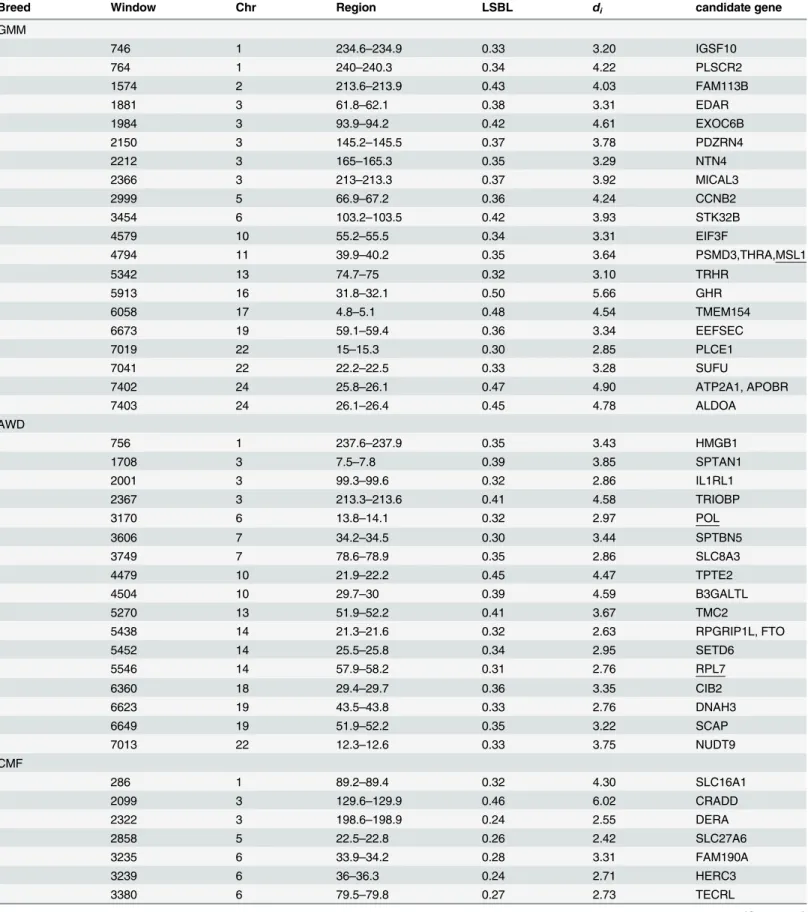
production. We identified candidate genes are for enrichment of these main traits. We list below some genes previously identified to be important in each breed for various traits (Table 3).
Specific selection genes in GMM breed Production traits. Two important genesTRHR
andAPOBRas candidate association with body mass [13,14].PDS5Bshowed negative
covari-ance between average daily weight gain and backfat thickness [15].IGSF10is differentially
expressed in cattle with high and low residual feed intake [16].Meat traits:GHRis a
well-known gene that not only effects meat production and quality but also reproduction traits in
many species [17,18].STK32Bis a QTL(quantitative trait loci) for marbling score in Hanwoo
[19].ALDOA, which encodes a glycolytic metabolic enzyme, was expressed at around 2-fold lower levels in the longissimus muscle of Wagyu-sired fetuses at day 195 compared with
Pied-montese-sired fetuses [20].FAM113Bis expressed in dairy cattle at least twice the level of that
Fig 7. The diversity of OAR13_67857725.1 SNP in 3 sheep breeds.
doi:10.1371/journal.pone.0128688.g007
Table 2. The annotation details in specific selected and overlapping selected region.
Breed No. of selected windows No. of genes in windows No. of genes within or near Peak SNP
overlapping selected
GMM & AWD 2 9
GMM& CMF 2 3
AWD& CMF 1 5
specific selected
GMM 55 164 46
AWD 51 201 51
CMF 41 113 32
in beef cattle [21].NTN4was down-regulated in differentiated adiposities compared with
intra-muscular fibroblast-like cells [22].Reproduction traits:PLSCR2is a candidate endometrial
gene in the regulation of conceptus growth and elongation [23].EIF3Fgene transcripts were
more highly enriched in brilliant cresyl blue (BCB)+ oocytes compared with BCB−oocytes
[24].CCNB2was identified as significantly associated with developmental competence of
bovine oocytes [25].PDZRN4is associated with sperm motility of Holstein-Friesian cattle and
EEFSECis related to buffalo bull fertility [26,27].Health traits:TMEM154can reduce
lentivi-rus susceptibility in sheep [28] and GWAS indicate this gene to be associated with
susceptibil-ity to and control of ovine lentivirus [29].MICAL3is associated with immune response traits
in Canadian Holstein cattle [30].ATP2A1is associated with pseudomyotonia, a muscle
func-tion disorder, in cattle [31].PSMD3shows significant association with the mean corpuscular
volume [32].Other traits:GMM is merino fine wool sheep, so wool trait was also selected
when in process of breeding. Unsurprisingly, we found three important genes involved in wool
trait.EDARis associated with hair thickness in human [33]. Mutation inMpzl3, a gene
encod-ing a predicted adhesion protein, is responsible for rough coat mice with severe skin and hair
abnormalities [34].THRAis located at quantitative. Meanwhile, we found three genes looks
association with milk traits. Such as,EXOC6Bis a candidate gene for teat morphology and
function [35].PLCE1is associated with total protein weight in milk andSUFUis associated
with the mammary system, somatic cell count and survival [36].
Specific selection genes in AWD breed Production traits. FTOis associated with BMI in
human and growth rate and fat mass in pig [37–40].SCAP, part of theINSIG-SCAP-SREBP
pathway, is involved in obesity risk in Chinese children [41]. Mutations inB3GALTLcan
cause disproportionate short stature in human, and developmental delay [42].Reproduction
traits:SLC8A3is a transporter that can potentially increase the availability of alanine and
L-histidine for gap junctional transfer in oocytes [43].SETD6is involved in the transcriptional
regulation of gonadotropin-releasing hormone [44].Health traits:SPTAN1is a candidate gene
for parasite resistance in livestock [45].CIB2is associated with influencing interleukin levels in
African Americans [46].HMGB1is involved in mastitis in dairy cattle [47].TRIOBPand
TMC2can cause recessive hearing loss in human [48,49].NUDT9is a candidate gene for an
inherited cataract in sheep [50]. Mutations inSPTBN5andRPGRIP1Lcause retinitis
pigmen-tosa [51,52]. A SNP mutation inDNAH3is involved in recurrent airway obstruction in
Euro-pean horses [53]. A functional SNP inIL1RL1is associated with asthma in human [54].Other
traits:TPTE2may be directly or indirectly related to epithelial cells or skin development [44]
and is a candidate gene associated with wool traits in Chinese Merino Sheep [55].
Specific selection genes in CMF breed Production traits. TECRLis associated with
with-ers height in racing quarter horse [56].SLC27A6is part of the peroxisome
proliferator-activated receptor (PPAR) signaling pathway, which is associated with carcass conformation in
cattle [57].Meat trait:FAM190Ais a QTL associated with weight after slaughter in Hanwoo
cattle [58].CRADDis associated with muscle compactness [59].PHKG1causes high glycogen
content and low meat quality in pig skeletal muscle [60].CAPN3is related to meat quality traits
in chickens [61].Reproduction traits:TYRO3modulates female reproduction by influencing
gonadotropin-releasing hormone [62].SLC16A1plays an important role in the transport of
mevalonate and ketone bodies [63] and may be involved in differences in efficiency of
repro-duction in cattle[64].Health traits:SOCS3is associated with somatic cell score trait in cattle
and is expressed in goat milk fat globules in response to experimental intramammary infection withStaphylococcus aureus[65].Other traits:In milk traits,PRKAA1is associated with fat percentage and may have effects on fat metabolism affecting milk production traits in cattle
[66].DERAis a positional candidate gene for milk fat percentage in the German
Table 3. The information of main candidate gene of three breeds.
Breed Window Chr Region LSBL di candidate gene
GMM
746 1 234.6–234.9 0.33 3.20 IGSF10
764 1 240–240.3 0.34 4.22 PLSCR2
1574 2 213.6–213.9 0.43 4.03 FAM113B
1881 3 61.8–62.1 0.38 3.31 EDAR
1984 3 93.9–94.2 0.42 4.61 EXOC6B
2150 3 145.2–145.5 0.37 3.78 PDZRN4
2212 3 165–165.3 0.35 3.29 NTN4
2366 3 213–213.3 0.37 3.92 MICAL3
2999 5 66.9–67.2 0.36 4.24 CCNB2
3454 6 103.2–103.5 0.42 3.93 STK32B
4579 10 55.2–55.5 0.34 3.31 EIF3F
4794 11 39.9–40.2 0.35 3.64 PSMD3,THRA,MSL1
5342 13 74.7–75 0.32 3.10 TRHR
5913 16 31.8–32.1 0.50 5.66 GHR
6058 17 4.8–5.1 0.48 4.54 TMEM154
6673 19 59.1–59.4 0.36 3.34 EEFSEC
7019 22 15–15.3 0.30 2.85 PLCE1
7041 22 22.2–22.5 0.33 3.28 SUFU
7402 24 25.8–26.1 0.47 4.90 ATP2A1, APOBR
7403 24 26.1–26.4 0.45 4.78 ALDOA
AWD
756 1 237.6–237.9 0.35 3.43 HMGB1
1708 3 7.5–7.8 0.39 3.85 SPTAN1
2001 3 99.3–99.6 0.32 2.86 IL1RL1
2367 3 213.3–213.6 0.41 4.58 TRIOBP
3170 6 13.8–14.1 0.32 2.97 POL
3606 7 34.2–34.5 0.30 3.44 SPTBN5
3749 7 78.6–78.9 0.35 2.86 SLC8A3
4479 10 21.9–22.2 0.45 4.47 TPTE2
4504 10 29.7–30 0.39 4.59 B3GALTL
5270 13 51.9–52.2 0.41 3.67 TMC2
5438 14 21.3–21.6 0.32 2.63 RPGRIP1L, FTO
5452 14 25.5–25.8 0.34 2.95 SETD6
5546 14 57.9–58.2 0.31 2.76 RPL7
6360 18 29.4–29.7 0.36 3.35 CIB2
6623 19 43.5–43.8 0.33 2.76 DNAH3
6649 19 51.9–52.2 0.35 3.22 SCAP
7013 22 12.3–12.6 0.33 3.75 NUDT9
CMF
286 1 89.2–89.4 0.32 4.30 SLC16A1
2099 3 129.6–129.9 0.46 6.02 CRADD
2322 3 198.6–198.9 0.24 2.55 DERA
2858 5 22.5–22.8 0.26 2.42 SLC27A6
3235 6 33.9–34.2 0.28 3.31 FAM190A
3239 6 36–36.3 0.24 2.71 HERC3
3380 6 79.5–79.8 0.27 2.73 TECRL
Friesian population [67].HERC3is associated with milk production performance in Chinese
Holstein cattle [68].
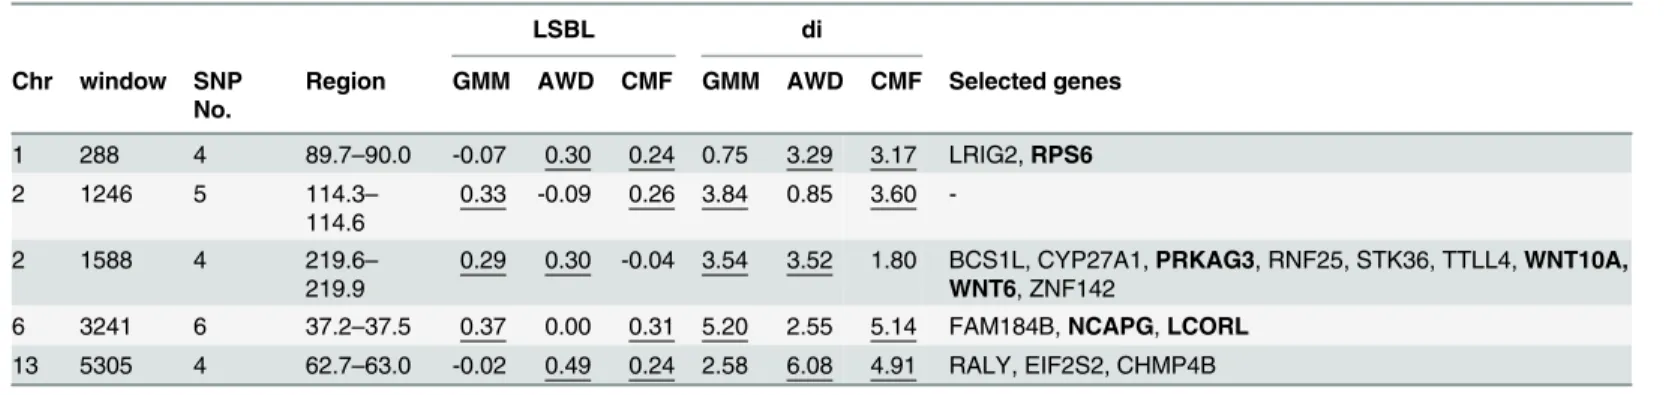
Overlapping selection regions
According to the above analysis, overlapping windows means there are differences between the
two selected breeds. InTable 4, 17 selected genes in these overlapping regions are annotated.
Firstly, two overlapping windows were detected between GMM and CMF breeds. There is no gene involved in the 1246 window. We then identified two well-known genes, NCAPG and its near neighbor LCORL within 37.2–37.5Mb on OAR6, which are reported to be involved in
fetal growth, stillbirth, and carcass size in sheep and other livestock (Table 4). GWAS revealed
that these two genes are associated with body weight in Australian Merino sheep[69]. Kijas
et al. suggest that variation in theNCAPG/LCORLregion also influences production traits in
sheep [70]. In horses, GWAS indicatesLCORL/NCAPGas a candidate region for withers height
[71]. In cattle,LCORLandNCAPGgenes are associated with feed intake and weight gain [72]
and body frame size [73]. Xu et al. detected thatLCORL/NCAPGhave undergone positive
selection in five distinct cattle breeds [74].
Secondly, there are two windows that are different between AWD and CMF breeds. One
region, 89.7 to 90.0 Mb on OAR10, coincides withLRIG2andRPS6genes.RPS6is a candidate
gene in a QTL region affecting growth and reproduction traits in swine [75]. The other region,
from 62.7 to 63.0 Mb, on OAR13 included three genes,RALY,EIF2S2andCHMP4B(Table 4).
Another nearby gene,ASIP, regulates pigmentation in mice, while duplication of ASIP in
sheep controls a series of alleles for black and white coat color [76]. TheASIPregion is one of
Table 3. (Continued)
Breed Window Chr Region LSBL di candidate gene
3605 7 33.9–34.2 0.26 2.85 TYRO3
3608 7 34.8–35.1 0.24 2.71 CAPN3
4834 11 52.8–53.1 0.28 2.63 SOCS3
5918 16 33.6–33.9 0.22 2.64 PRKAA1
7363 24 11.7–12 0.25 2.86 SHISA9
7407 24 27.6–27.9 0.27 3.08 PHKG1
Underlined fonts indicate candidate gene in our former GWAS study.
Table 4. The genes in overlapping selection windows.
LSBL di
Chr window SNP No.
Region GMM AWD CMF GMM AWD CMF Selected genes
1 288 4 89.7–90.0 -0.07 0.30 0.24 0.75 3.29 3.17 LRIG2,RPS6
2 1246 5 114.3–
114.6
0.33 -0.09 0.26 3.84 0.85 3.60
-2 1588 4 219.6–
219.9
0.29 0.30 -0.04 3.54 3.52 1.80 BCS1L, CYP27A1,PRKAG3, RNF25, STK36, TTLL4,WNT10A, WNT6, ZNF142
6 3241 6 37.2–37.5 0.37 0.00 0.31 5.20 2.55 5.14 FAM184B,NCAPG,LCORL 13 5305 4 62.7–63.0 -0.02 0.49 0.24 2.58 6.08 4.91 RALY, EIF2S2, CHMP4B Blot fonts as candidate gene. Underlined fonts indicate values in the topfirst percentiles.
four known melanoma-susceptibility regions and includes the four genes (RALY,EIF2S2,
CHMP4BandASIP) [77]. In Kijas et al. research, a SNP s51670.1 has peak value of global FST
in similar region, ASIP as candidate gene, on OAR13 [78]; here this SNP also has peak value of
LSBL anddiin 5305 windows (Fig 7). In a recent GWAS analysis ASIP was associated with
white versus non-white coat-color variation in sheep [79].
Thirdly, only one region was different between AWD and GMM, at 219.6–219.9 Mb on
OAR4. There are nine genes involved (Table 4), three of which have been are reported. The
most important gene isPRKAG3(protein kinase, AMP-activated, gamma 3 noncatalytic
sub-unit), which increases fatty acid oxidation and glucose uptake to satisfy muscle energy
demands [80] and is a candidate gene associated with meat quality and production traits in pig
[81] and cattle [82]. A mutation inPRKAG3is associated with excess glycogen content in pig
skeletal muscle [83]. Recently GWAS analysis indicated thatPRKAG3affected meat pH and
color in crossbred commercial pig lines [84]. The other two genes areWNT10AandWNT6,
which are strongly co-expressed in human SW480 cells [85]. Wnt6 is an early negative
regula-tor of limb chondrogenesis and ectoderm development in the chicken embryo [86].
Interest-ingly, Christodoulides et al. identified a proband with early onset obesity that is heterozygous
for aWNT10C256Y mutation, which blocks adipogenesis [87].
Discussion
Three breeds of sheep were investigated in this study; CMF comes from China, GMM
origi-nates from Germany and AWD was originally developed in South Africa. The FSTresults
showed significant genetic divergence between GMM and AWD (FST= 0.19) and medium
divergence between CMF and GMM (FST= 0.13) or AWD (FST= 0.14). This is consistent with
domestic sheep being first domesticated in Asia, the Fertile Crescent, and then dispersing to
Europe and Africa [88]. The PCA and neighbor-joining tree clearly separate these three
popu-lation samples from each other.
In the present study, we used two locus specific analysis approaches to detect candidate
regions targeted by selection. Both of them calculated for each breed based on pairwise FST.
From the previously describe, thediapproach measures the standardized locus-specific
devia-tion in levels of populadevia-tion structure [4]. However, the LSBL approach geometrically isolates
allele frequency change [3].
First we compared the values of these two statistical approaches. The two methods had a
high correlation, especially in the selected regions. For example, the highest correlation (r>0.9)
occurred in the region of the top 1–5000 SNPs by LSBLs in all three breeds. Furthermore, the
result shows the high correlation of LSBL anddiin AWD and GMM, while lower in CMF. It
might be relevant with the evolution process of these three breeds. AWD and GMM are notable commercial breeds in the world, which developed through strict selection pressure. However, CMF is local breed which mainly selected for body weight and conformation in recent years [5].
We then calculated the mean value respectively of the two approaches for autosomal SNPs in 300 kb windows for each breed. Interestingly, LSBL had a greater ability to detect specific
selection thandi. We merged the window lists generated by these two approaches to identify
breed specific selection regions. In total, 142 windows showed the strongest signature of selec-tion, five of which overlapped. This means that the two breeds are different in these regions and one or both may have undergone selection.
We have defined candidate genes in selection windows located at or near a peak value SNPs.
Some genes were identified in earlier sheep selection studies, such asNF1andASIP[78],
gene that, not only affects meat production and quality, but also reproduction traits [17,18].
Two genes were detected in sheep by GWAS, such asTPTE2[55],TMEM154[29]. In our
pre-vious study four genes,POL,RPL7,MSL1andSHISA9, are associated with growth and meat
production traits [5]. We notice that there are only a littler common results in these two
stud-ies, although using the same data. Because the sample sizes were too small, we combined three population data as a whole object in our GWA study. But herein, we respectively detected the specific selection for each breed.
Therefore, our study provides additional information for interpreting selection in different domestic sheep breeds. Production, meat, reproduction and health traits of sheep were investi-gated because these are highly valued traits in mutton sheep production. So the candidate
genes enrich for these main traits. For production traits, there are two genes,APOBRandFTO,
are associated with BMI [14,37]. For reproduction traits, we found no major genes controlling
reproduction prolificacy, such asGDF9andBMPR1B; however, we found some genes which
can influence development of the oocyte and sperm. For example,EIF3F,CCNB2andSLC8A3
affect oocyte development [24,25,43] andPDZRN4andEEFSECaffect sperm [26,27]. For
meat traits,ALDOA,STK32BandFAM190Aare related to marbling in cattle[19,20,58]. For
wool traits, EDAR was selected in the GMM breed and is associated with hair thickness [33].
AWD has a characteristic of molting, andTPTE2is related to epithelial cells or skin
develop-ment [44]. For health traits, we noticed that association of candidate genes related to disease
resistance traits is more common in Chinese compared with Mongolian commercial mutton sheep. This shows that the artificial selection of Mongolian sheep has not received sufficient
attention. An important gene was found,TMEM154, which can control and reduce lentivirus
susceptibility in sheep [28,29]. Currently, there is no vaccine to prevent ovine lentivirus
infec-tion and no cost-effective treatment for infected animals. This gene should therefore be used in breeding projects. In the AWD breed, we found a lot of genes associated with disease (except for immune related genes). These included sensory disorders and respiratory system diseases. Interestingly, some genes related to milk traits were selected in GMM and CMF breeds, both of which are from the Northern hemisphere, but not in AWD.
It is worth mentioning that the early growth speed of Chinese Mongolian sheep is too slow compared with commercial breeds. This is because the Chinese Mongolian sheep is a fat-tailed sheep and deposition of tail fat reduces early growth speed. We therefore focused on the
path-ways and genes associated with fat formation. Interestingly, five such genes (SOCS2,SOCS3,
PPP1CC,PHKG1andPRKAA1) are in the insulin signaling pathway.SOCS2andSOCS3 (sup-pressor of cytokine signaling 2 and 3), regulate insulin signaling in different tissues by impacting
on the insulin receptor and insulin receptor substrates [90].PPP1CC, also known asPPP1G, is a
subunit of protein phosphatase 1. It is a glycogen-associated phosphatase responsible for dephosphorylation and subsequent inactivation of glycogen synthase and is universal in skeletal
muscle [91].PHKG1, causes high glycogen content and low meat quality in pig skeletal muscle
[60]. PRKAA1/2 acts as an energy sensor, sensing an increased AMP/ATP ratio, and is known
to regulate substrates that mediate metabolic activity, such as phosphorylation of acetyl coA
car-boxylase (ACACA, also known as ACC) [92]. Furthermore, studies have shown thatPDGF
pro-motes proliferation and inhibits differentiation of preadipocytes [93,94]. Real-time quantitative
PCR indicates thatPDGFDis expressed at a higher level in adipose tissue than in normal
human tissues, except the thyroid [95]. Insulin also stimulates cell growth and differentiation,
and promotes the storage of substrates in fat, liver and muscle by stimulating lipogenesis,
glyco-gen and protein synthesis, and inhibiting lipolysis, glycoglyco-genolysis and protein breakdown [96].
We therefore suggest that these genes affect fat-tail formation but this requires further study. In this study, we also found some different selection regions between breeds; however, we were unable to determine in which breed the candidate gene was selected. For instance, CMF
has a black head and legs, while the AWD are white. It appears as thoughASIP, a key gene of pigmentation, may provide evidence for selection in CMF. According to the same principle, theLCORL/NCAPGregion was selected in GMM, which grows faster and has a bigger carcass
than CMF. Of course, not all genes can be judged, such likePRKAG3affecting meat pH and
color, because the relevant data was lacking. These genes, in addition toRPS6,WNT10Aand
WNT6, require further study.
Conclusions
In the present study, we used the two approaches, LSBL anddistatistics, to detect selection
regions in three different sheep breeds (populations). These approaches clearly identified selected regions in each breed, and provided many candidate genes, including some well-known genes. Overall, growth, meat and health traits are undergoing different levels of selec-tion in these three breeds, but the choice of focus differs for each breed according to origin, local preferences and environment.
Supporting Information
S1 Fig. Neighbor-Joining (NJ) phylogeny for 322 sheep. (TIF)
S2 Fig. Genomic distribution of LSBL and di in 3 sheep breeds. (TIF)
S3 Fig. The diversity of 23 SNPs of 3 sheep breeds. (TIF)
S1 Table. The main candidate genes of specific selections in GMM. (DOCX)
S2 Table. The main candidate genes of specific selections in AWD. (DOCX)
S3 Table. The main candidate genes of specific selections in CMF. (DOCX)
Acknowledgments
We are grateful to Inner Mongolia Sunit Purebred Sheep Stud, Inner Mongolia German Mut-ton Purebred Sheep Stud, and Tianjin Aoqun Animal Husbandry Propriety Limited, especially to Lady Hua Chen, for providing the experimental animals and helping with the sampling. We also thank Hangxing Ren, Jiasen Liu, Guobin Lu, Lingyang Xu, Jian Lu, Shifang Zhang, Xiaon-ing Zhang, Yanfei Lv, and Dan Sun (CAAS) for their generous assistance. This research was supported by the National Key Technology R&D Program of China (2011BAD28B05-2).
Author Contributions
References
1. Sabeti PC, Varilly P, Fry B, Lohmueller J, Hostetter E, Cotsapas C, et al. Genome-wide detection and characterization of positive selection in human populations. Nature. 2007; 449(7164):913–8. PMID: 17943131
2. Tang K, Thornton KR, Stoneking M. A new approach for using genome scans to detect recent positive selection in the human genome. PLoS biology. 2007; 5(7):e171. doi:10.1371/journal.pbio.0050171 PMID:17579516; PubMed Central PMCID: PMC1892573.
3. Shriver MD, Kennedy GC, Parra EJ, Lawson HA, Sonpar V, Huang J, et al. The genomic distribution of population substructure in four populations using 8,525 autosomal SNPs. Human genomics. 2004; 1(4):274–86. PMID:15588487; PubMed Central PMCID: PMC3525267.
4. Akey JM, Ruhe AL, Akey DT, Wong AK, Connelly CF, Madeoy J, et al. Tracking footprints of artificial selection in the dog genome. Proceedings of the National Academy of Sciences of the United States of America. 2010; 107(3):1160–5. doi:10.1073/pnas.0909918107PMID:20080661; PubMed Central PMCID: PMC2824266.
5. Zhang L, Liu J, Zhao F, Ren H, Xu L, Lu J, et al. Genome-wide association studies for growth and meat production traits in sheep. PloS one. 2013; 8(6):e66569. doi:10.1371/journal.pone.0066569PMID: 23825544; PubMed Central PMCID: PMC3692449.
6. Huson DH. SplitsTree: analyzing and visualizing evolutionary data. Bioinformatics. 1998; 14(1):68–73. PMID:9520503.
7. Paradis E, Claude J, Strimmer K. APE: Analyses of Phylogenetics and Evolution in R language. Bioin-formatics. 2004; 20(2):289–90. PMID:14734327.
8. Rousset F. genepop'007: a complete re-implementation of the genepop software for Windows and Linux. Molecular ecology resources. 2008; 8(1):103–6. doi:10.1111/j.1471-8286.2007.01931.xPMID: 21585727.
9. Weir BS. Genetic data analysis. Methods for discrete population genetic data: Sinauer Associates, Inc. Publishers; 1990. PMID:17751487
10. Wright S. Evolution and the genetics of populations, volume 4: variability within and among natural pop-ulations: University of Chicago press; 1984.
11. Weir BS, Cockerham CC. Estimating F-statistics for the analysis of population structure. evolution. 1984:1358–70.
12. Stephan W. Genetic hitchhiking versus background selection: the controversy and its implications. Phil-osophical Transactions of the Royal Society B: Biological Sciences. 2010; 365(1544):1245–53. 13. Liu XG, Tan LJ, Lei SF, Liu YJ, Shen H, Wang L, et al. Genome-wide association and replication
stud-ies identified TRHR as an important gene for lean body mass. American journal of human genetics. 2009; 84(3):418–23. doi:10.1016/j.ajhg.2009.02.004PMID:19268274; PubMed Central PMCID: PMC2668008.
14. Speliotes EK, Willer CJ, Berndt SI, Monda KL, Thorleifsson G, Jackson AU, et al. Association analyses of 249,796 individuals reveal 18 new loci associated with body mass index. Nature genetics. 2010; 42(11):937–48. doi:10.1038/ng.686PMID:20935630
15. Rothschild M, Kim E, Plastow G, editors. Novel Tools Provide New Opportunities for Genetic Improve-ment of Swine. 10th World Congress on Genetics Applied to Livestock Production; 2014: Asas. 16. Chen Y, Gondro C, Quinn K, Herd RM, Parnell PF, Vanselow B. Global gene expression profiling
reveals genes expressed differentially in cattle with high and low residual feed intake. Animal genetics. 2011; 42(5):475–90. doi:10.1111/j.1365-2052.2011.02182.xPMID:21906099.
17. CrisàA, Marchitelli C, Pariset L, Contarini G, Signorelli F, Napolitano F, et al. Exploring polymorphisms
and effects of candidate genes on milk fat quality in dairy sheep. Journal of dairy science. 2010; 93(8): 3834–45. doi:10.3168/jds.2009-3014PMID:20655453
18. Komisarek J, Michalak A, Walendowska A. The effects of polymorphisms in DGAT 1, GH and GHR genes on reproduction and production traits in Jersey cows. Animal Science Papers and Reports. 2011; 29(1):29–36.
19. Lee J, Lia Y, Kim J. Detection of QTL for Carcass Quality on Chromosome 6 by Exploiting Linkage and Linkage Disequilibrium in Hanwoo. Asian-Australasian Journal of Animal Sciences. 2012; 25(1):17–21. doi:10.5713/ajas.2011.11337PMID:25049472
20. Lehnert SA, Reverter A, Byrne KA, Wang Y, Nattrass GS, Hudson NJ, et al. Gene expression studies of developing bovine longissimus muscle from two different beef cattle breeds. BMC developmental biology. 2007; 7(1):95.
21. Sadkowski T, Jank M, Zwierzchowski L, Oprzadek J, Motyl T. Transcriptomic index of skeletal muscle of beef breeds bulls. Journal of physiology and pharmacology: an official journal of the Polish Physio-logical Society. 2009; 60 Suppl 1:15–28. PMID:19609010.
22. SeongLan Y, SangMi L, ManJong K, HangJin J, ByungChan S, JinTae J, et al. Identification of differen-tially expressed genes between preadipocytes and adipocytes using affymetrix bovine genome array. Journal of Animal Science and Technology. 2009; 51(6):443–52.
23. Spencer T. Insights into Conceptus Elongation in Ruminants: Roles of Ovarian Progesterone and the Uterus. J Biol Chem. 2000; 275:32106. PMID:10851241
24. Janowski D, Salilew-Wondim D, Torner H, Tesfaye D, Ghanem N, Tomek W, et al. Incidence of apopto-sis and transcript abundance in bovine follicular cells is associated with the quality of the enclosed oocyte. Theriogenology. 2012; 78(3):656–69. e5. doi:10.1016/j.theriogenology.2012.03.012PMID: 22578626
25. Mourot M, Dufort I, Gravel C, Algriany O, Dieleman S, Sirard MA. The influence of follicle size, FSH-enriched maturation medium, and early cleavage on bovine oocyte maternal mRNA levels. Molecular reproduction and development. 2006; 73(11):1367–79. PMID:16894554
26. Hering D, Olenski K, Kaminski S. Genome-wide association study for poor sperm motility in Holstein-Friesian bulls. Animal reproduction science. 2014; 146(3):89–97.
27. Verma A, Rajput S, De S, Kumar R, Chakravarty AK, Datta TK. Genome-wide profiling of sperm DNA methylation in relation to buffalo (Bubalus bubalis) bull fertility. Theriogenology. 2014; 82(5):750–9. e1. doi:10.1016/j.theriogenology.2014.06.012PMID:25023295
28. Heaton MP, Clawson ML, Chitko-Mckown CG, Leymaster KA, Smith TP, Harhay GP, et al. Reduced lentivirus susceptibility in sheep with TMEM154 mutations. PLoS genetics. 2012; 8(1):e1002467. doi: 10.1371/journal.pgen.1002467PMID:22291605
29. White SN, Mousel MR, Herrmann-Hoesing LM, Reynolds JO, Leymaster KA, Neibergs HL, et al. Genome-wide association identifies multiple genomic regions associated with susceptibility to and con-trol of ovine lentivirus. PloS one. 2012; 7(10):e47829. doi:10.1371/journal.pone.0047829PMID: 23082221
30. Thompson-Crispi KA, Sargolzaei M, Ventura R, Abo-Ismail M, Miglior F, Schenkel F, et al. A genome-wide association study of immune response traits in Canadian Holstein cattle. BMC genomics. 2014; 15(1):559.
31. Grünberg W, Sacchetto R, Wijnberg I, Neijenhuis K, Mascarello F, Damiani E, et al. Pseudomyotonia, a muscle function disorder associated with an inherited ATP2A1 (SERCA1) defect in a Dutch Improved Red and White cross-breed calf. Neuromuscular Disorders. 2010; 20(7):467–70. doi:10.1016/j.nmd. 2010.04.010PMID:20547455
32. Wang Y, Yang J, Yu M, Liu B, Fan B, Zhu M, et al. Polymorphism detection of porcine PSMC3, PSMC6 and PSMD3 genes and their association with partial growth, carcass traits, meat quality and immune traits. Canadian journal of animal science. 2005; 85(4):475–80.
33. Fujimoto A, Kimura R, Ohashi J, Omi K, Yuliwulandari R, Batubara L, et al. A scan for genetic determi-nants of human hair morphology: EDAR is associated with Asian hair thickness. Human molecular genetics. 2008; 17(6):835–43. doi:10.1093/hmg/ddm355PMID:18065779.
34. Cao T, Racz P, Szauter KM, Groma G, Nakamatsu GY, Fogelgren B, et al. Mutation in Mpzl3, a novel [corrected] gene encoding a predicted [corrected] adhesion protein, in the rough coat (rc) mice with severe skin and hair abnormalities. The Journal of investigative dermatology. 2007; 127(6):1375–86. doi:10.1038/sj.jid.5700706PMID:17273165; PubMed Central PMCID: PMC2745225.
35. Pausch H, Jung S, Edel C, Emmerling R, Krogmeier D, Götz KU, et al. Genome-wide association study uncovers four QTL predisposing to supernumerary teats in cattle. Animal genetics. 2012; 43(6):689–95. doi:10.1111/j.1365-2052.2012.02340.xPMID:22497297
36. Cecchinato A, Ribeca C, Chessa S, Cipolat-Gotet C, Maretto F, Casellas J, et al. Candidate gene asso-ciation analysis for milk yield, composition, urea nitrogen and somatic cell scores in Brown Swiss cows. Animal. 2014:1–9. doi:10.1017/S1751731114001098PMID:24804775.
37. Frayling TM, Timpson NJ, Weedon MN, Zeggini E, Freathy RM, Lindgren CM, et al. A common variant in the FTO gene is associated with body mass index and predisposes to childhood and adult obesity. Science. 2007; 316(5826):889–94. PMID:17434869
38. Fan B, Du Z-Q, Rothschild MF. The fat mass and obesity-associated (FTO) gene is associated with intramuscular fat content and growth rate in the pig. Animal biotechnology. 2009; 20(2):58–70. doi:10. 1080/10495390902800792PMID:19370455
40. Fontanesi L, Scotti E, Buttazzoni L, Davoli R, Russo V. The porcine fat mass and obesity associated (FTO) gene is associated with fat deposition in Italian Duroc pigs. Animal genetics. 2009; 40(1):90–3. doi:10.1111/j.1365-2052.2008.01777.xPMID:18786155
41. Liu F-H, Song J-Y, Shang X-R, Meng X-R, Ma J, Wang H-J. The Gene-Gene Interaction of INSIG-SCAP-SREBP Pathway on the Risk of Obesity in Chinese Children. BioMed research international. 2014; 2014.
42. Lesnik Oberstein SA, Kriek M, White SJ, Kalf ME, Szuhai K, den Dunnen JT, et al. Peters Plus Syn-drome Is Caused by Mutations in B3GALTL, a Putative Glycosyltransferase. The American Journal of Human Genetics. 2006; 79(3):562–6. PMID:16909395
43. Eppig JJ, Pendola FL, Wigglesworth K, Pendola JK. Mouse oocytes regulate metabolic cooperativity between granulosa cells and oocytes: amino acid transport. Biology of reproduction. 2005; 73(2): 351–7. PMID:15843493
44. Levy D, Kuo AJ, Chang Y, Schaefer U, Kitson C, Cheung P, et al. SETD6 lysine methylation of RelA couples GLP activity at chromatin to tonic repression of NF-κB signaling. Nature immunology. 2011;
12(1):29. doi:10.1038/ni.1968PMID:21131967
45. Sayre B, Harris G. Systems genetics approach reveals candidate genes for parasite resistance from quantitative trait loci studies in agricultural species. Animal genetics. 2012; 43(2):190–8. doi:10.1111/j. 1365-2052.2011.02231.xPMID:22404355
46. Ayele FT, Doumatey A, Huang H, Zhou J, Charles B, Erdos M, et al. Genome-wide associated loci influ-encing interleukin (IL)-10, IL-1Ra, and IL-6 levels in African Americans. Immunogenetics. 2012; 64(5): 351–9. doi:10.1007/s00251-011-0596-7PMID:22205395
47. Li L, Huang J, Zhang X, Ju Z, Qi C, Zhang Y, et al. One SNP in the 30-UTR of HMGB1 gene affects the
binding of target bta-miR-223 and is involved in mastitis in dairy cattle. Immunogenetics. 2012; 64(11): 817–24. doi:10.1007/s00251-012-0641-1PMID:22875364
48. Shahin H, Walsh T, Sobe T, Abu Sa’ed J, Abu Rayan A, Lynch ED, et al. Mutations in a novel isoform of TRIOBP that encodes a filamentous-actin binding protein are responsible for DFNB28 recessive non-syndromic hearing loss. The American Journal of Human Genetics. 2006; 78(1):144–52. PMID: 16385458
49. Kurima K, Peters LM, Yang Y, Riazuddin S, Ahmed ZM, Naz S, et al. Dominant and recessive deafness caused by mutations of a novel gene, TMC1, required for cochlear hair-cell function. Nature genetics. 2002; 30(3):277–84. PMID:11850618
50. Wilson GR, Morton JD, Palmer DN, McEwan JC, Gately K, Anderson RM, et al. The locus for an inher-ited cataract in sheep maps to ovine chromosome 6. Molecular vision. 2012; 18:1384. PMID:22690116 51. Borràs E, de Sousa Dias M, Hernan I, Pascual B, Mañé B, Gamundi MJ, et al. Detection of novel
genetic variation in autosomal dominant retinitis pigmentosa. Clinical genetics. 2013; 84(5):441–52. doi:10.1111/cge.12151PMID:23534816
52. Fahim AT, Bowne SJ, Sullivan LS, Webb KD, Williams JT, Wheaton DK, et al. Polymorphic variation of RPGRIP1L and IQCB1 as modifiers of X-linked retinitis pigmentosa caused by mutations in RPGR. Retinal Degenerative Diseases: Springer; 2012. p. 313–20.
53. Shakhsi-Niaei M, Klukowska-Roetzler J, Droegemueller C, Gerber V, Leeb T. The equine DNAH3 gene: SNP discovery and exclusion of an involvement in recurrent airway obstruction (RAO) in Euro-pean Warmblood horses. ARCHIV FUR TIERZUCHT-ARCHIVES OF ANIMAL BREEDING. 2013; 56:1–10.
54. Akhabir L, Sandford A. Identification of a functional SNP in an asthma gene: IL1RL1. Allergy, asthma, and clinical immunology: official journal of the Canadian Society of Allergy and Clinical Immunology. 2010; 6(Suppl 3):P1.
55. Wang Z, Zhang H, Yang H, Wang S, Rong E, Pei W, et al. Genome-wide association study for wool pro-duction traits in a Chinese Merino sheep population. PloS one. 2014; 9(9):e107101. doi:10.1371/ journal.pone.0107101PMID:25268383; PubMed Central PMCID: PMC4182092.
56. Meira C, Fortes M, Farah M, Porto-Neto L, Curi R, Moore S, et al., editors. A genome-wide association study for height at withers in racing quarter horse. Proc Assoc Advmt Anim Breed Genet; 2013. 57. Doran AG, Berry DP, Creevey CJ. Whole genome association study identifies regions of the bovine
genome and biological pathways involved in carcass trait performance in Holstein-Friesian cattle. BMC genomics. 2014; 15(1):837.
58. Kim J, Li Y, Lee J, Lee Y. Application of linkage disequilibrium mapping methods to detect QTL for car-cass quality on chromosome 6 using a high density SNP map in Hanwoo. Asian-Aust J Anim Sci. 2011; 24:457–62.
59. Raschetti M, Castiglioni B, Caroli A, Guiatti D, Pagnacco G, Chessa S. SNP identification in swine can-didate genes for meat quality. Livestock Science. 2013; 155(2):165–71.
60. Ma J, Yang J, Zhou L, Ren J, Liu X, Zhang H, et al. A Splice Mutation in the PHKG1 Gene Causes High Glycogen Content and Low Meat Quality in Pig Skeletal Muscle. PLoS genetics. 2014; 10(10): e1004710. doi:10.1371/journal.pgen.1004710PMID:25340394
61. Felício A, Boschiero C, Balieiro J, Ledur M, Ferraz J, Michelan Filho T, et al. Identification and associa-tion of polymorphisms in CAPN1 and CAPN3 candidate genes related to performance and meat quality traits in chickens. Genetics and Molecular Re-search. 2013; 12(1):472. doi:10.4238/2013.February.8. 12PMID:23420372
62. Pierce A, Bliesner B, Xu M, Nielsen-Preiss S, Lemke G, Tobet S, et al. Axl and Tyro3 modulate female reproduction by influencing gonadotropin-releasing hormone neuron survival and migration. Molecular Endocrinology. 2008; 22(11):2481–95. doi:10.1210/me.2008-0169PMID:18787040
63. Pardridge WM. The blood-brain barrier: bottleneck in brain drug development. NeuroRx. 2005; 2(1): 3–14. PMID:15717053
64. Adams HA, Southey BR, Everts RE, Marjani SL, Tian CX, Lewin HA, et al. Transferase activity function and system development process are critical in cattle embryo development. Functional & integrative genomics. 2011; 11(1):139–50.
65. Strillacci MG, Frigo E, Schiavini F, Samoré AB, Canavesi F, Vevey M, et al. Genome-wide association study for somatic cell score in Valdostana Red Pied cattle breed using pooled DNA. BMC genetics. 2014; 15(1):106.
66. Li H, Wang Z, Moore S, Schenkel F, Stothard P. Genome-wide scan for positional and functional candi-date genes affecting milk production traits in Canadian Holstein Cattle. Proc 9th WCGALP, Leipzig, Germany. 2010; 26.
67. Wang X. Identification and Characterization of Candidate Genes for Complex Traits in Cattle 2012. 68. Pan D, Zhang S, Jiang J, Jiang L, Zhang Q, Liu J. Genome-wide detection of selective signature in
Chi-nese Holstein. PloS one. 2013; 8(3):e60440. doi:10.1371/journal.pone.0060440PMID:23555972 69. Al-Mamun H, Clark S, Kwan P, Gondro C, editors. Genome-Wide Association Study on Body Weight
Reveals Major Loci on OAR6 in Australian Merino Sheep. 10th World Congress on Genetics Applied to Livestock Production; 2014: Asas.
70. Kijas JW, Naumova A. Haplotype-based analysis of selective sweeps in sheep. Genome. 2014; 57(999):1–5.
71. Tetens J, Widmann P, Kühn C, Thaller G. A genome-wide association study indicates LCORL/NCAPG as a candidate locus for withers height in German Warmblood horses. Animal genetics. 2013; 44(4): 467–71. doi:10.1111/age.12031PMID:23418885
72. Lindholm-Perry AK, Kuehn LA, Oliver WT, Sexten AK, Miles JR, Rempel LA, et al. Adipose and muscle tissue gene expression of two genes (NCAPG and LCORL) located in a chromosomal region associ-ated with cattle feed intake and gain. PloS one. 2013; 8(11):e80882. doi:10.1371/journal.pone. 0080882PMID:24278337; PubMed Central PMCID: PMC3835320.
73. Setoguchi K, Watanabe T, Weikard R, Albrecht E, Kühn C, Kinoshita A, et al. The SNP c. 1326T>G in
the non-SMC condensin I complex, subunit G (NCAPG) gene encoding a p. Ile442Met variant is associ-ated with an increase in body frame size at puberty in cattle. Animal genetics. 2011; 42(6):650–5. doi: 10.1111/j.1365-2052.2011.02196.xPMID:22035007
74. Xu L, Bickhart DM, Cole JB, Schroeder SG, Song J, Van Tassell CP, et al. Genomic signatures reveal new evidences for selection of important traits in domestic cattle. Molecular biology and evolution. 2014. doi:10.1093/molbev/msu333PMID:25431480.
75. Smith TP, Showalter AD, Sloop KW, Rohrer GA, Fahrenkrug SC, Meier BC, et al. Identification of por-cine Lhx3 and SF1 as candidate genes for QTL affecting growth and reproduction traits in swine. Ani-mal genetics. 2001; 32(6):344–50. PMID:11736804.
76. Norris BJ, Whan VA. A gene duplication affecting expression of the ovine ASIP gene is responsible for white and black sheep. Genome research. 2008; 18(8):1282–93. doi:10.1101/gr.072090.107PMID: 18493018; PubMed Central PMCID: PMC2493430.
77. Barrett JH, Iles MM, Harland M, Taylor JC, Aitken JF, Andresen PA, et al. Genome-wide association study identifies three new melanoma susceptibility loci. Nat Genet. 2011; 43(11):1108–13. doi:10. 1038/ng.959PMID:21983787; PubMed Central PMCID: PMC3251256.
78. Kijas JW, Lenstra JA, Hayes B, Boitard S, Porto Neto LR, San Cristobal M, et al. Genome-wide analysis of the world's sheep breeds reveals high levels of historic mixture and strong recent selection. PLoS biology. 2012; 10(2):e1001258. doi:10.1371/journal.pbio.1001258PMID:22346734; PubMed Central PMCID: PMC3274507.
80. Winder W, Holmes B, Rubink D, Jensen E, Chen M, Holloszy J. Activation of AMP-activated protein kinase increases mitochondrial enzymes in skeletal muscle. Journal of applied physiology. 2000; 88(6): 2219–26. PMID:10846039
81. Fontanesi L, Davoli R, Nanni Costa L, Beretti F, Scotti E, Tazzoli M, et al. Investigation of candidate genes for glycolytic potential of porcine skeletal muscle: Association with meat quality and production traits in Italian Large White pigs. Meat science. 2008; 80(3):780–7. doi:10.1016/j.meatsci.2008.03.022 PMID:22063597.
82. Li W-F, Li J-Y, Gao X, Xu S-Z, Yue W-B. Association analysis of PRKAG3 gene variants with carcass and meat quality traits in beef cattle. African Journal of Biotechnology. 2014; 11(8):1855–61. 83. Milan D, Jeon JT, Looft C, Amarger V, Robic A, Thelander M, et al. A mutation in PRKAG3 associated
with excess glycogen content in pig skeletal muscle. Science. 2000; 288(5469):1248–51. PMID: 10818001.
84. Zhang C, Wang Z, Bruce H, Kemp R, Charagu P, Miar Y, et al., editors. Genome-wide association stud-ies (GWAS) identifstud-ies a QTL close to PRKAG3 affecting meat pH and colour in crossbred commercial pig lines. Proceedings, 10th World Congress of Genetics Applied to Livestock Production; 2014; BC, Canada.
85. Kirikoshi H, Sekihara H, Katoh M. WNT10A and WNT6, clustered in human chromosome 2q35 region with head-to-tail manner, are strongly coexpressed in SW480 cells. Biochemical and biophysical research communications. 2001; 283(4):798–805. doi:10.1006/bbrc.2001.4855PMID:11350055. 86. Geetha-Loganathan P, Nimmagadda S, Christ B, Huang R, Scaal M. Ectodermal Wnt6 is an early
neg-ative regulator of limb chondrogenesis in the chicken embryo. BMC Dev Biol. 2010; 10:32. doi:10. 1186/1471-213X-10-32PMID:20334703; PubMed Central PMCID: PMC2859743.
87. Christodoulides C, Scarda A, Granzotto M, Milan G, Dalla Nora E, Keogh J, et al. WNT10B mutations in human obesity. Diabetologia. 2006; 49(4):678–84. doi:10.1007/s00125-006-0144-4PMID:16477437. 88. Lawson Handley LJ, Byrne K, Santucci F, Townsend S, Taylor M, Bruford MW, et al. Genetic structure
of European sheep breeds. Heredity. 2007; 99(6):620–31. doi:10.1038/sj.hdy.6801039PMID: 17700634.
89. Zhang L, Mousel MR, Wu X, Michal JJ, Zhou X, Ding B, et al. Genome-wide genetic diversity and differ-entially selected regions among Suffolk, Rambouillet, Columbia, Polypay, and Targhee sheep. PloS one. 2013; 8(6):e65942. doi:10.1371/journal.pone.0065942PMID:23762451; PubMed Central PMCID: PMC3677876.
90. Galic S, Sachithanandan N, Kay TW, Steinberg GR. Suppressor of cytokine signalling (SOCS) proteins as guardians of inflammatory responses critical for regulating insulin sensitivity. The Biochemical jour-nal. 2014; 461(2):177–88. doi:10.1042/BJ20140143PMID:24966052.
91. Newgard CB, Brady MJ, O'Doherty RM, Saltiel AR. Organizing glucose disposal: emerging roles of the glycogen targeting subunits of protein phosphatase-1. Diabetes. 2000; 49(12):1967–77. PMID: 11117996.
92. Zhong W, Xie Y, Abdallah M, Awonuga AO, Slater JA, Sipahi L, et al. Cellular stress causes reversible, PRKAA1/2-, and proteasome-dependent ID2 protein loss in trophoblast stem cells. Reproduction. 2010; 140(6):921–30. doi:10.1530/REP-10-0268PMID:20876741
93. Artemenko Y, Gagnon A, Aubin D, Sorisky A. Anti-adipogenic effect of PDGF is reversed by PKC inhibi-tion. Journal of cellular physiology. 2005; 204(2):646–53. PMID:15754337
94. Holmstrom TE, Mattsson CL, Falting JM, Nedergaard J. Differential signalling pathways for EGF versus PDGF activation of Erk1/2 MAP kinase and cell proliferation in brown pre-adipocytes. Experimental cell research. 2008; 314(19):3581–92. doi:10.1016/j.yexcr.2008.09.007PMID:18838072.
95. LaRochelle WJ, Jeffers M, McDonald WF, Chillakuru RA, Giese NA, Lokker NA, et al. PDGF-D, a new protease-activated growth factor. Nature cell biology. 2001; 3(5):517–21. doi:10.1038/35074593 PMID:11331882.
96. Saltiel AR, Kahn CR. Insulin signalling and the regulation of glucose and lipid metabolism. Nature. 2001; 414(6865):799–806. PMID:11742412