countries as conservative climate powers
DOI: http://dx.doi.org/10.1590/0034-7329201600101
Rev. Bras. Polít. Int., 59(1): e001, 2016
Abstract
This article discusses the role of China, Russia, India and Brazil in the climate regime. It describes the trajectory of their emissions, of their domestic policies and of their international commitments, and argues that, despite their responsibility in causing the problem, they have been conservative forces in the climate regime.
Keywords: BRIC countries, decabornization, climate change, international politics, international system.
Acknowledgements
Funding information: Bolsa de Produtividade em Pesquisa, nível 1B (Ministério da Ciência, Tecnologia e Inovação, Conselho Nacional de Desenvolvimento Científico e Tecnológico – CNPq, Brazil); Bolsa de Doutorado Programas de Excelência – PROEX (Coordenação de Aperfeiçoamento de Pessoal de Nível Superior – CAPES, Brazil).
Received: January 12, 2016 Accepted: March 1, 2016
Introduction
C
limate change is the greatest challenge of currentinter national affairs. The rising concentration of
Greenhouse Gases (GHG) – especially carbon dioxide (CO2)
– in the atmosphere is causing irreversible changes in climate patterns: extreme weather events are becoming more frequent, and average global temperature is expected to increase between 3.5 and 4oC by 2100 if current trajectories of emissions continue. Climate change implies severe impacts on living conditions. Global decarbonization – decreasing GHG emissions so that their concentration in the atmosphere can be stabilized, ideally reduced – is of utmost need to mitigate it. At the Paris Conference (2015), countries presented commitments that, if fully implemented, will limit average temperature increase around 2.7oC in the long run. Eduardo Viola
Universidade de Brasília, Instituto de Relações Internacionais, Brasília – DF, Brazil ([email protected]);
ORCID ID:
orcid.org/0000-0002-5028-2443
Larissa Basso
Universidade de Brasília, Instituto de Relações Internacionais, Brasília – DF, Brazil ([email protected]).
ORCID ID:
orcid.org/0000-0002-1744-3866
Copyright:
• This is an open-access article distributed under the terms of a Creative Commons Attribution License, which permits unrestricted use, distribution, and reproduction in any medium, provided that the original author and source are credited. • Este é um artigo publicado em acesso aberto e distribuído sob os termos da Licença de Atribuição Creative Commons, que permite uso irrestrito, distribuição e reprodução em qualquer meio, desde que o autor e a fonte originais sejam creditados.
h t t p : / / w w w. r b p i . i n f o
Revista Brasileira de
Política Internacional
China, India, Russia and Brazil, the BRIC countries object of this article, are among the greatest global GHG emitters. They are, together with the United States, the European Union, Japan and Korea, key climate powers – countries that answer for a relevant share of GHG emissions in total global amount, and have human and technological capacity to implement decarbonization. Since 1992, when the climate regime was inaugurated, the BRIC countries’ emissions have been increasing consistently, contributing to the accumulated amount of GHG in the atmosphere. Yet, it is not clear whether climate change has occupied a central locus in these countries’ policy making.
It is the objective of this paper to contribute to this debate by offering an analysis of the decarbonization in the BRIC countries. The article is divided in three parts. First, the profile of the countries’ emissions is drawn, in order to identify which are their main emitting sectors. Second, due to the weight of energy supply in global GHG emissions, the existence of energy related climate change mitigation policy is checked, as well as its directions concerning low carbon energy sources and energy efficiency. Third, the trajectories of the BRIC countries in the climate regime, to date, are outlined. The analysis will show the reason for which these countries are classified as conservative powers in the climate regime and why it is unlikely that their conservative status will change in the near future.
Four different GHG emission profiles
China, the most populated country in the world and the second world economy, is a key player in the climate regime. China is a climate heavyweight and an energy super-consumer. Its positions in the climate regime and its choices regarding both energy production and energy imports – it is the world’s largest energy importer – impact global decarbonization deeply. Between 1990 and 2012, Chinese GHG emissions increased more than 230%, and, in the same period, Chinese share in global emissions increased from 9.48% to 22.44%. In China, emissions including and excluding Land Use, Land Use Change and Forestry (LULUCF) increase in tandem, meaning that the main sources of GHG emissions in the country are other than LULUCF. In fact, the energy sector is the greatest GHG emitter in China: it was responsible for 19.98% of total global GHG emissions in 2012 (WRI 2015a). Chinese energy-related emissions rose 246.53% between 1990 and 2012 (WRI 2015b). Chinese emissions from other sectors are also relevant in the global aggregate, but do not compare to the ones from energy: industry answered for 3% of global GHG emissions in 2012 (WRI 2015a) and increased 1,031.65% between 1990 and 2012 (WRI 2015b); agriculture answered for 1.92% of global GHG emissions in 2012 (WRI 2015a) and increased 53.23% in the same period (WRI 2015b).
1990 and 2012 and its share in global emissions halved in the same period – from 8.18% to
4.73%. The difference between emissions including and excluding LULUCF is also not relevant.1
Energy is the great driver of Russian GHG emissions, having answered for 4.82% of global GHG emissions in 2012 (WRI 2015a). These emissions decreased 30.75% between 1990 and 2012 (WRI 2015c), though. Agriculture, industry and waste in Russia answered, together, for 0.54% of total world GHG emissions in 2012 (WRI 2015a).
India is the second most populated country in the world and an economy that grows much faster than Russia and Brazil – and, since 2015, faster than China. India is a climate great weight gravitating towards becoming a heavyweight due to its absolute emissions, although there is an enormous gap between those and Indian’s per capita emissions, which still is very low. India is an energy super-importer. Indian emissions increased 140.18% between 1990 and 2012, and their share in global emissions almost doubled in that period. Energy is a key driver: it produced 4.91% of global emissions in 2012 (WRI 2015a), having increased 210.26% between 1990 and 2012 (WRI 2015d). Emissions from agriculture are also relevant in India: they increased 31.08% between 1990 and 2012 (WRI 2015d) and were responsible for 1.52% of global GHG emissions in 2012 (WRI 2015a). Emissions from industrial processes and waste also rose substantially between 1990 and 2012, but, together, they accounted for only 0.53% of total world GHG emissions in 2012 (WRI 2015a).
Brazil is also a climate great weight, but Brazilian GHG emissions have different features. First, emissions including LULUCF are greater than emissions excluding it (see table 03 below). Second, Brazil has successfully tackled its LULUCF’s emissions between 1990 and 2012, but emissions from other sectors have increased in the same period – while Brazilian emissions, including LULUCF, increased 13.48% between 1990 and 2012, the share jumps to 79.18% when LULUCF is excluded. Emissions from Brazilian energy and agriculture sectors are also relevant: the first increased 120.65% between 1990 and 2012 (WRI 2015e) and answered for 1.09% of global emissions in 2012 (WRI 2015a); the latter rose 46.60% between 1990 and 2012 (WRI 2015e) and were responsible for 1.03% of global GHG emissions in 2012 (WRI 2015a). Industry and waste answered, together, for 0.22% of total world GHG emissions in 2012 (WRI 2015a).
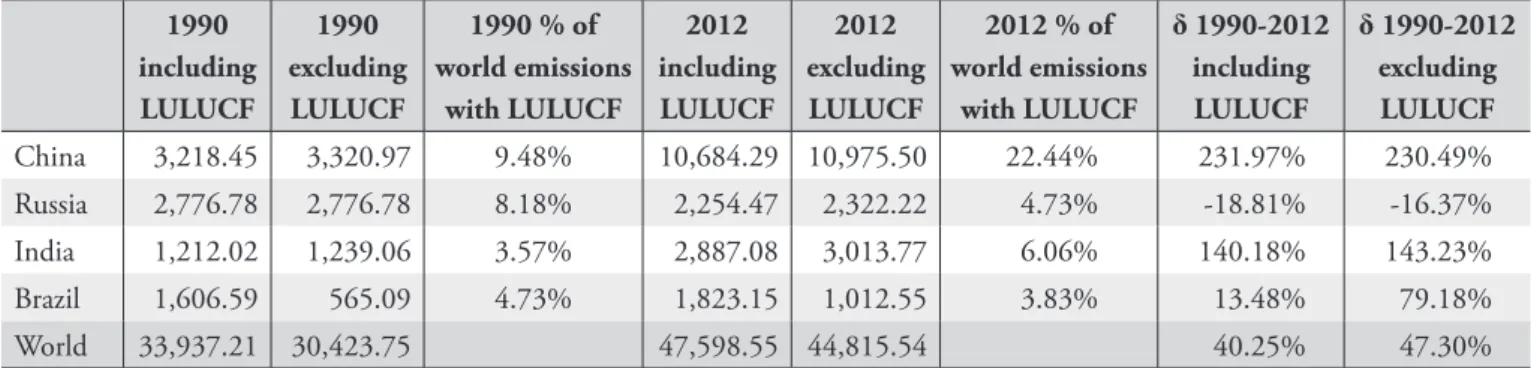
Table 1: Total GHG emissions (Mt CO2e)
1990 including LULUCF 1990 excluding LULUCF
1990 % of world emissions with LULUCF 2012 including LULUCF 2012 excluding LULUCF
2012 % of world emissions
with LULUCF
δ 1990-2012 including LULUCF
δ 1990-2012 excluding LULUCF
China 3,218.45 3,320.97 9.48% 10,684.29 10,975.50 22.44% 231.97% 230.49%
Russia 2,776.78 2,776.78 8.18% 2,254.47 2,322.22 4.73% -18.81% -16.37%
India 1,212.02 1,239.06 3.57% 2,887.08 3,013.77 6.06% 140.18% 143.23%
Brazil 1,606.59 565.09 4.73% 1,823.15 1,012.55 3.83% 13.48% 79.18%
World 33,937.21 30,423.75 47,598.55 44,815.54 40.25% 47.30%
Source: Authors’ own elaboration, based on data from World Resources Institute, CAIT – Climate Data Explorer (database). <http://cait.wri.org/>. Accessed December 15, 2015.
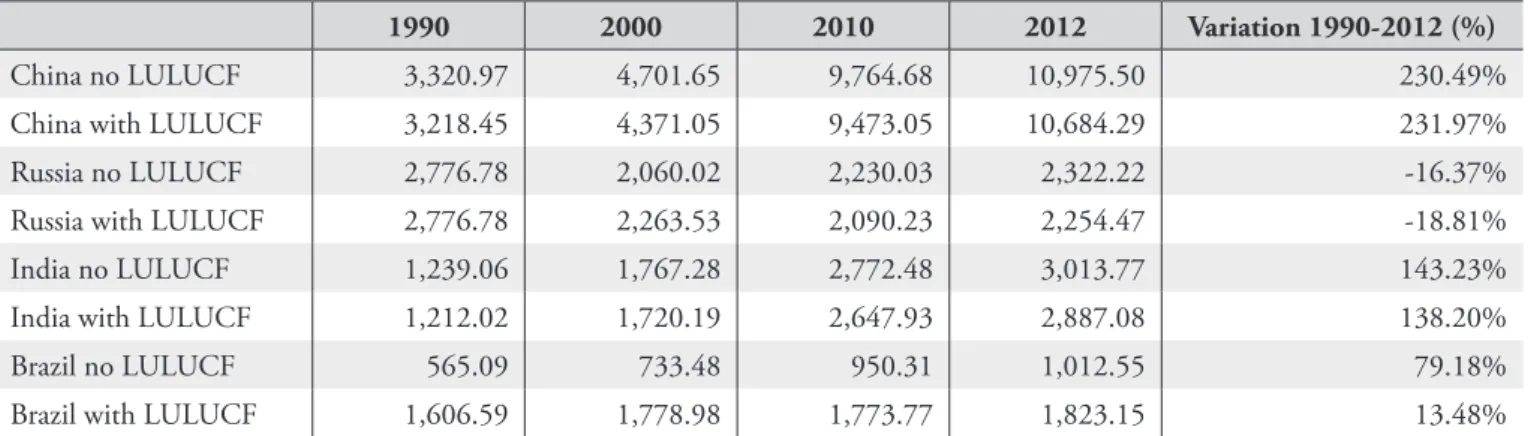
Table 2: Total GHG emissions, excluding and including LULUCF (Mt CO2e)
1990 2000 2010 2012 Variation 1990-2012 (%)
China no LULUCF 3,320.97 4,701.65 9,764.68 10,975.50 230.49%
China with LULUCF 3,218.45 4,371.05 9,473.05 10,684.29 231.97%
Russia no LULUCF 2,776.78 2,060.02 2,230.03 2,322.22 -16.37%
Russia with LULUCF 2,776.78 2,263.53 2,090.23 2,254.47 -18.81%
India no LULUCF 1,239.06 1,767.28 2,772.48 3,013.77 143.23%
India with LULUCF 1,212.02 1,720.19 2,647.93 2,887.08 138.20%
Brazil no LULUCF 565.09 733.48 950.31 1,012.55 79.18%
Brazil with LULUCF 1,606.59 1,778.98 1,773.77 1,823.15 13.48%
Source: Authors’ own elaboration, based on data from World Resources Institute. <http://cait2.wri.org/wri/>. Accessed December 15, 2015.
Despite four different emission profiles, energy-related emissions are increasingly relevant in the four BRIC countries. Considering that reducing energy-related emissions is key to mitigate climate change, the next section focuses each country’s policies and politics regarding energy decarbonization. It assesses: (i) their policy framework towards climate change mitigation and its directions for energy; (ii) low carbon energy trends and policies; and (iii) energy efficiency trends and policies.
Energy decarbonization evolution in the BRIC countries
China
China has a carbon intensive energy matrix. It is world’s largest energy consumer with 21.8% of global Total Primary Energy Supply, TPES, in 2012 (IEA 2014a). China is the largest producer (45.5% of the global production in 2013) and importer of coal (IEA 2014a), using most of it to generate electricity – 76% of its electricity is produced by coal (IEA 2014a). It is also the largest producer of hydropower (23.2% of the global production in 2012) and has world’s largest hydropower installed capacity, 194GW (IEA 2014a). It is world’s fourth producer (2013 data) and the world’s second importer (2012 data) of oil (IEA 2014a). The Chinese economy is energy intensive – 202.1kg of oil equivalent per USD 1,000 GDP in 2011 (constant 2011 PPP) –, although per capita levels (2,029kT of oil equivalent in the same year) are low when compared to OECD countries (World Bank 2013). China has been investing heavily in wind and solar power. It also has 26 first and second-generation nuclear reactors in service, and more than 20 third-generation under construction – simultaneously.
and improve bureaucracy, and light manufacturing came to the fore. From 1978 to 2001, the rapid growth of labor-intensive light manufacturing enabled the country to acquire some energy efficient technology and integrate it to its capital stock, but in 2001 this trend was reversed due to the spread of energy intensive heavy industry, leading to increased energy demand and energy intensity of the Chinese GDP (Rosen and Houser 2007, 9). In fact, between 1978 and 2000, energy demand grew at an annual rate of 4%; it peaked 13% in 2001; since 2006, numbers have started to decrease gradually (Rosen and Houser 2007, 4), but still are among the highest in the world.
Recent energy-related emissions are connected to expanding energy and transport services, both closely linked to urbanization. The share of urban population changed from 48% of the total in 2009 to 53% in 2013 (World Bank 2013). The carbon intensity of Chinese energy supply is related to the extensive use of fossil fuels in the country. Therefore, even if China successfully redirects its industrial activity away from energy-intensive sectors, the demands for heating, cooling, lighting and transportation will keep pressing energy-related emissions.
The 11th Five Year Guidelines (FYG) (2006-2010)2 was aimed at achieving a so-called
Harmonious Socialist Society through a development path that “takes into consideration [...]
environmental concerns” (Fan 2006, 709). It targeted a 20% reduction (from the 2005 levels)
in the Chinese GDP’s energy intensity, energy conservation and emission reductions for each Chinese region, sector and individual business, as well as increasing the share of non fossil sources in the energy matrix to 10% by 2010 and 15% by 2020 (with specific targets for expanding the installed capacity of each renewable source: 300GW for hydro, 30GW for wind, 1.8GW
for solar photovoltaic and 30GW for biomass-based sources). In the context of the 11th FYG,
China launched, in 2007, both its National Climate Change Program and its first White Paper on Energy Conditions and Policies (measures regarding energy efficiency, energy conservation and renewable energy). A economic stimulus package followed, in 2008, and allocated 35%
of USD 850 billion to low carbon development.3 Following it, several policies were enacted.
Regarding energy efficiency and energy conservation: the Energy Conservation Law was revised; benchmarking in key sectors, such as construction and transportation, was established, as well as the Top-1000 Enterprises Energy Conservation Program; energy pricing was coupled with energy efficiency – higher energy costs for businesses that did not meet energy efficiency standards, and financial rewards for the ones that saved energy –; public transport, alternative fuels, combined heat-and-power, surplus heat utilization, green lighting, high performance appliances and energy saving buildings were envisaged. Regarding energy production from
2 The pivotal piece of China’s development planning is the Five Year Plan (FYP). Enacted every five years since 1953, it establishes the guidelines for the economic development of the period, according to the priorities set by the Communist Party of China. In 1978, FYP became more technical: laws and regulations are developed within its framework, in order for the broad objectives of the FYP to be translated into policy. After the 10th FYP, the plans were nominated Five Year
Guidelines (FYG).
low carbon sources: the Medium and Long-term Development Plan for Renewable Energy was approved; higher taxes on oil, coal and natural gas were authorized; operators of power grids were required to buy energy from renewable energy producers; feed-in tariffs, discounted lending and the creation of a national fund to foster renewable energy development were established; guidelines for renewable energy industries – setting technical standards for renewable energy electrical power, technology, and products – were published; rules designed to encourage the construction of renewable power generation facilities, efficient buildings, and rural electrification were designed (IEA 2014b). Financial support for Research and Development (R&D) on key renewable energy technologies, and provincial and local regulation on the same issues followed (Held et al. 2011, 29-31). It was also noted that the Chinese central government and several local governments from the coastal region engaged in diplomatic talks and offered economic incentives to attract investments from Taiwanese companies leaders in low carbon technology.
Achievements of the 11th FYG were substantial, but very heterogeneously distributed
along the country and were not enough to reduce Chinese energy’s carbon intensiveness. In energy efficiency, the greatest failure was the lack of compliance of coal thermal power plants
with the 20% increase in efficiency standards. However, there were important advances:4 China
closed most obsolete power, iron and steel plants; it employed energy-efficient technologies and materials in heating. China also improved fuels and made massive investments in transit systems – even though the expansion of automotive production is resulting in large and long traffic congestions in major Chinese metropolitan areas. There were significant achievements regarding renewable energy as well: China is currently the world’s largest producer and consumer of renewable energy, but in both cases in absolute numbers, not in per capita or per unit of GDP. It became the largest market for wind turbines, and it is world’s largest manufacturer of solar photovoltaic panels. Yet the share of low carbon energy of its matrix is only 4% (Reegle 2013a; World Bank 2013).
The 12th FYG (2011-2015) targets decreasing Chinese energy intensity by 16%, and
Chinese carbon intensity by 17%, from the 2005 levels; non-fossil energy sources should produce 11.4% of Chinese TPES by 2015 and 15% by 2020. The country is planning to expand both low carbon energy sources installed capacity – 40GW from nuclear, 70GW from wind, 5GW from solar and 120GW from hydropower – and power grid (smart grid national standards are being developed). Between 2013 and 2014, China enacted an impressive amount of regulation to further promote renewable energy: incentives to stimulate purchasing of vehicles fueled with renewable energy; bonus for renewable energy electricity generation; financial measures in support of solar photovoltaic technology; feed-in tariffs; procedures for managing of distributed power grid; promoting technology by price leverage effect; strengthening product testing and certification; price policy on offshore wind power electricity generation; promotion of geothermal
energy (IEA 2014b). Further investments are planned for public transportation. The plan also benefits seven “strategic emerging industries” with tax exemptions and beneficial procurement policies, among which new energy, energy conservation and clean energy vehicles.
It is early to evaluate the results of the 12th FYG, but new records of pollution in major
cities are a clear indication of constraints in implementation. The NIMBY (“not-in-my-backyard”) movement is pressing in favor of renewables: in 2013, grassroots’ pressures resulted in the closure of a copper refinery, which is very polluting, and a plutonium processing plant. If sustained in time and fully implemented, the recent trend regarding low carbon energy might benefit global climate change mitigation. It is even possible that Chinese emissions will peak before 2030, but this depends on a transition to a service/consumer-oriented economy.
Russia
Russia is the second largest producer of oil (12.8% of world’s total in 2013), the second largest producer of natural gas (19.3% of world’s total in 2013) and the fourth producer of electricity (1069TWh in 2012) (IEA 2014a). It is a major energy exporter: the largest exporter of gas (203bcm in 2013), the second largest of oil (239MT in 2012) and the third largest of coal (114MT in 2013) (IEA 2014a). Although a share of Russian electricity comes from low carbon sources (hydropower and nuclear answer for 11.7%), fossil fuels provide 67.5% (or 722TWh out of a total 1069TWh) of it – 525TWh are provided by natural gas (IEA 2014a). Russian economy is energy intensive: 226.5kg of oil equivalent per USD 1,000 GDP in 2011 (constant 2011 PPP). In spite of the fact that Russia has one of the largest potential for renewable energy in the world, almost no effort to develop it has been undertaken since 1990.
Due to the fact of being a great exporter of fossil fuels, Russian energy is not only a means to development and a necessity to Russian population wellbeing, but it is a national business with global proportions – including massive corruption. This is very significant, and many of the incoherencies of Russian energy decarbonization policies can be better understood when this is kept in mind.
In 1990, Russia was still part of the ex-USSR, which deemed issues such as energy efficiency or cost-effective energy production and consumption as secondary. This legacy persists in Russia; only small-scale changes have taken place. The reduction in emissions and energy use that took place between 1990 and 2013 were not due to increasing energy efficiency and or to low carbon energy sources, but to decreasing economic activity. In 1990, the ex-USSR consumed 60.914 quadrillion BTU (EIA 2014); in 1992, after the end of the USSR, Russia’s energy consumption was 34.116 quadrillion BTU (EIA 2014); in 2010, it was 29.999 quadrillion BTU (EIA 2014). The country has an enormous potential for improving energy efficiency, but related policy-making and implementation is only at its infancy.
a thermal performance code, energy efficiency labeling and deployment of energy meters; the Energy Conservation and Energy Efficiency Increase Law (Federal Law No. 261-FZ) was enacted
in 2009.5 In the same year, the country launched its guidelines for promoting renewable energy,
targeting the increase of renewable sources in electricity generation – 1.5% in 2010, 2.5% in 2015 and 4.5% in 2020 (IEA 2014c) – and the Climate Doctrine of Russia – a statement that recognizes the danger of climate change, the anthropogenic influence to cause it, and the importance of enhancing energy efficiency and expanding renewable energy in Russia (IEA 2014c; Russia 2009a). More recently, the Decree on the mechanism for the promotion of renewable energy on the wholesale electricity and market – which established incentive mechanisms for the generation of energy from wind, solar photovoltaic and small hydropower plants (IEA 2014c) –, enacted in 2013, and the Russia Energy Strategy to 2030 – which highlights the importance of the energy sector to the Russian economy and the necessary changes, mainly modernization of structures and markets, it has to undergo in order to remain competitive in the future – enacted in 2003 and amended in 2009 (IEA 2014c; Russia 2009b) are key policy advances.
Yet, results are timid. Russian’s energy intensity is still two times higher than the average International Energy Agency member levels – and has slightly increased in the last years –, and its carbon intensity is 60% higher (IEA 2014d). To modify this picture, Russia needs to undergo massive change: (i) reforms in infrastructure – to end regulated tariffs, subsidies and cross-subsidies, to liberalize retail electricity and gas tariffs, to implement consumption-based billing and metering systems, to expand and enforce the quality of service requirements –; (ii) implementation of the regulation that has been created – focusing on co-ordination among Ministries, sub-national laws and regulatory acts –; (iii) more efficient markets –encouraging transparency and competition in oil and gas sectors, and completing the liberalization of electricity markets –; (iv) development of more cost-efficient oil and gas resources and adjustment of export strategies – in order to maintain production in high levels, tax reforms (adoption of a profit-based taxation), regulation of joint ventures (to reduce risks for foreign partners), expanding use of gas in transportation and building new pipelines (IEA 2014d); and, very importantlt, (v) to increase consistently the rule of law. Unfortunately the dynamic of Russia in the last Putin administration (started in 2013) is going in the opposite direction, particularly since the annexation of Crimea and the military intervention in Eastern Ukraine in 2014. Dependent on fossil fuel exports to balance its budget, Russia has been severely affected by the sharp fall of international oil prices (since mid 2014). The country has been trying to get around the lost in revenues by increasing its oil production, and concerns over climate change have been left out of the agenda.
India
India is the world’s third largest producer (613MT in 2013) and importer (178MT in 2013) of coal and the third largest importer (185MT in 2012) of oil (IEA 2014a). It is the third largest producer of electricity (1128TWh in 2012), and 71% of it comes from coal – hydropower generated 126TWh in 2012 (IEA 2014a). It is also an energy intensive economy: 125.7kg of oil equivalent per USD1,000 GDP in 2011 (constant 2011 PPP). Per capita energy consumption, however, is low: while the world average (TPES/capita, ton of oil equivalent) is 1.90 and OECD’s is 4.19, India’s is 0.64; the world average electricity consumption per capita is 2,972 KWh/ capita, OECD’s is 8,089 and India’s is 760. The country faces important infrastructure issues in energy services: approximately 25% of the population has no access to electricity, and 625 million people depend on biomass (wood mainly) for cooking (Reegle 2013b; World Bank 2013).
India is a large importer of energy, and energy imports have been increasing lately. This means that India is very sensitive to changes in global energy markets and also that it could benefit greatly from further development of low carbon sources. In fact, low carbon energy sources are extremely relevant in reducing Indian energy access gap and increasing its energy security. This goes not unseen in India: in fact, the country has a massive amount of plans oriented to increase the share of renewables in its energy matrix. The greatest stumbling block for it’s implementation is the very fragmented political system and important vested interests in exploiting Indian’s vast coal reserves.
India enacts a central piece of policy planning every five years, also called Five Year Plan (FYP). Energy access, energy security and energy efficiency are usually part of it. In the 10th FYP,
increasing the production of coal and electricity, accelerating the exploration of hydrocarbons, restructuring the energy sector (deregulating) to increase efficiency, and introducing energy efficiency standards for processes and appliances were planned (India 2002, 759). Climate
change was part of the 11th FYP, in a chapter specifically called Environment and Climate
Change. In this chapter, climate change was acknowledged as “one of the most serious concerns of our time”, and the impacts and risks for the country were highlighted (India 2007, 203). As a response to the challenge, the FYP targets reducing energy intensity of Indian economy by 20% until 2017 (compared to the 2007-08 levels) and increasing energy production from renewables (India 2007, 205-207). When addressing the energy sector specifically, however, the plan reinforces the conclusions of the Integrated Energy Policy Report: renewables are likely to account for only around 5-6% of the primary commercial energy needs by 2032, and coal production will increase 150% by 2012, compared to the 2006-2007 levels (India 2007, 347).
In the context of the plan, several regulatory pieces were enacted, including a 2009-2010 renewable energy regulation that creates feed-in tariffs in order to incentivize a large development of these energy sources in the country.
In the current 12th FYP (2012-2017), climate change is no longer a central topic: it is
treated as one of the issues to be tackled in order to achieve sustainable development, mainly through eco-efficiency and low carbon strategy for inclusive growth (India 2013, 113-117). As for energy, the plan maintains that Indian dependency on energy imports is a major issue, and that the importance of expanding energy access and energy security leads to increasing coal, oil and gas production country. Nevertheless, the plan states that renewable energy must be emphasized, and that expected increases of 30MW in renewables supply until 2017 and of 75MW until 2022, both from 2012 levels, are reasonable (India 2013, 132-135).
It is hard, though, to expect significant change regarding energy efficiency and renewable energy in India in the next one-to-two decades. Despite the impressive amount of policy directed to the issues6 and gains from addressing the topics, there are conflicting interests that make any effort in the direction of implementing these objectives unlikely to be straightforward. To name a few: (i) the country’s vast coal reserves, which exploitation is seen as best policy advice, given concerns over energy security and the need of fast enhancement of energy access; (ii) the fall in the international price of oil, which has increased Indian oil consumption beyond previous expectations, strengthening GDP growth and carbon emissions in 2015; (iii) the profound fragmentation of Indian political system, which makes it very hard for both enacting coherent national policy and implementing them uniformly across the country; (iv) deep-rooted anti-colonization feelings and a victim attitude, leading to dismissing important mitigation action or blaming industrialized countries for the problem – in fact, it creates a bizarre situation in which India is one of the most vulnerable countries to the effects of climate change but one of the least willing to take consistent positive action towards mitigation; the fact that per capita numbers, and never absolute ones, are quoted by the country in every policy piece and international position is a clear sign of it –; and (v) the situation of extreme poverty in which a considerable share of Indian population live – it is very hard to establish policy objectives that will have an enormous positive impact in the long run, yet require massive investments and behavior change (such as payment for electricity) in the short run, considering that many people have no access to minimum education, sanitation, food and health systems, and a still predominant culture which separates groups in immutable casts in the vastly populated rural.
Brazil
Compared to China, Russia and India, Brazil has much more modest energy numbers. It is not among the greatest oil, coal or natural gas producers or consumers; it produces 11.1% of the world’s total world hydroelectricity (in 2012), 75.2% of its electricity comes from hydro (2012) and has the third largest hydropower installed capacity (84GW in 2012) (IEA 2014a). Brazil has a relatively low carbon energy matrix: in 2012, 46% of its total primary energy production and 42.4% of its total primary energy supply came from low-carbon sources (EPE 2013, 21-22). Brazil does not have an energy intensive economy – 95.9kg of oil equivalent per USD1,000 GDP in 2011 (constant 2011 PPP). Brazil is broadly self-sufficient in energy, and is has vanguard technology for exploring deep offshore oil reserves, hydropower technology (especially in designing reservoirs) and in producing electricity and fuel (ethanol) from sugar cane.
LULUCF, especially deforestation, have traditionally driven Brazilian GHG emissions. In the second half of the 2000s, deforestation in the Amazon was finally tackled, and rates
decreased from 27,000 km2 a year in 2004 to 7,500 km2 a year in 2009 (INPE 2015). They
continued to drop until 2012, and stabilized at around 5,000 km2 a year since then (INPE 2015;
Viola and Basso 2014) – which still are very high levels, showing policy setbacks in dealing with the issue. Around 80% of it is illegal deforestation. On the other hand, there has not been any progress in tackling deforestation in the Cerrado savannah, the current great agricultural frontier of Brazil. Deforestation is still of large concern in Brazil; yet, currently, agriculture and energy share with it the position of main drivers of Brazilian emissions.
The Brazilian National Climate Change Plan was enacted in 2008. The Plan established targets in several areas so to mitigate climate change, among which are initiatives in the energy sector: to stimulate efficiency in all economic sectors (especially: energy efficiency; substitute coal with charcoal coming from planted forests; replace old fridges and HCFCs; invest in solar water heating and urban waste recycling; phasing out the use of fire for clearing sugar cane plantations; integrate agriculture and cattle raising systems); to maintain the share of renewable energy in the Brazilian electricity matrix; to encourage the domestic and international use of biofuels; to seek further reduction of deforestation; to eliminate the net loss of forest coverage; to strengthen inter-sector actions as to reduce climate change vulnerability; and to identify the impacts of climate change in the environment and support scientific research about it (Brazil 2008). In 2009, the Plan was integrated into the National Climate Change Policy (Law No. 12187, complemented by Decree No. 7390/2010) (Brazil 2009). The legal framework established specific targets to reduce GHG emissions in different economic sectors, including energy (Brazil 2009).
controversies over their environmental and social impacts. Second, new hydropower plans employ run-of-the-river technology, which allegedly reduce the impacts over local natural ecosystems, but add to global ones by requiring a backup system to keep electricity generated amounts constant (Viola and Basso 2014). Fossil fuel thermal power plants have been chosen as both backup systems for run-of-the-river hydropower plants, thus their increasing share in the energy matrix.
In 2002, the Brazilian federal government enacted the Alternative Energy Sources Incentive Program (in Portuguese, PROINFA). According to this program, either small hydropower, wind or biomass plants should produce 10% of Brazilian electricity by 2020. Between 2004 and 2011, small hydropower plants sold around 1,800MW in electricity auctions; wind sold 5,399.50MW, and biomass sold 2,500MW (Nogueira and Costa 2012). Solar energy was not included among the renewable sources in PROINFA due to price concerns. In 2014, solar photovoltaic sold 1,048MW (installed capacity) in electricity auction, and in August 2015, 1,043 MW (installed capacity). Poor maintenance of the transmission lines and the absence of a widely established smart grid hinder consistent expansion of renewable electricity in Brazil.
Another setback for renewables took place in the fuel sector. Until 2006, the domestic prices of oil/derivatives followed international ones; after that, however, due to the discovery of the deep offshore reserves – and the illusion that Brazil would rapidly become a great producer and exporter of oil – the federal government misleadingly subsidized oil prices to maintain economic growth rates high, changing the relative prices gasoline/ethanol and undermining the competitiveness of the latter. After the economic crisis that followed the collapse of Lehman Brothers, tax exemptions to the automobile industry were included in the package of countercyclical measures to maintain economic growth. These exemptions led to increase in car ownership and a dramatic increase in fuel demand, while ethanol prices were still not competitive. These heterodox policies might have enhanced short-term economic growth, however increased long-term macroeconomic imbalance and penalized both Petrobras – having faced several important losses – and the ethanol production chain.
Despite using more renewable energy than the world average, Brazil is not an energy efficient country. From 1984 to 2004, the amount of energy effectively employed in final use (in relation to total energy input) shifted from 46.9% to a mere 57.8% (EPE 2013, 193); the performance
of many sectors were even poorer – e.g. from 31.4% to 37.5% in transports (EPE 2013, 193);
became much more stringent; industries were forced to increase energy efficiency so not to face economic losses. In the following years, though, energy waste resumed its previous high levels.
Brazilian transport system is also highly inefficient. The country’s freight is mostly carried
in roads by trucks fueled with diesel, and there is only 8-10%7 of biodiesel in the diesel mix.
Brazilian automotive industry accepts only vague energy efficiency labeling, and European and
US companies lobby against stricter energy efficiency labeling in Brazil.8 Most consumers do
not understand the concept of energy efficiency, and still buy cars according to short-term costs only. Even the flex-fuel technology was not developed due to pure environmental concerns, but as a means to create a market for boosted ethanol production. Considering that energy access is no longer a major issue in the country – electricity is available to 100% of urban and 97% of rural Brazilian population; LPG for cooking, to 94% (IEA 2014f ) –, recent electricity supply crises9 and the increase of fossil fuels in the matrix, which harm the health and the environment,
better standards for energy efficiency should be a priority in the country.
Brazil is experiencing an economic crisis which, in the short term, is even deeper than the Russian’s. The GDP stagnated in 2014, contracted 4% in 2015, it is expected to contract 4% in 2016 and 1% in 2017. Consequently, between 2014 and 2017, Brazilian per capita income is going to shrink more than 10%. Due to current crises – economic and political –, concerns over climate change are being marginalized in Brazil.
Trajectories and commitments in the climate regime
According to the forces that prevail in influencing countries’ positions in the global carbon cycle and their mindset regarding climate change, standings in the climate regime can be classified as reformist or conservative (Viola et al. 2012). When a country is mostly in favor of measures which really push climate change mitigation, thus reforming the current regime, it will be classified as reformist; when it opposes such measures it will be classified as conservative. Granted that this is a broad classification, which takes into account the prevailing standings of a country regarding climate change. Countries are complex entities composed mainly of governments, businesses, scientific communities and civil society, which might not share the prevailing standings.
China has been a conservative country in the climate regime, but lately has moved to a moderate conservative position. It is not part of the Annex I of the Kyoto Protocol, and has headed the G77+China coalition, which defends a radical interpretation of the principle of common but differentiated responsibility, and a heavy commitment of developed countries to engage in reducing emissions first. At COP 15, China pledged to reduce the carbon intensity
7 Law 11.097/2005 and ANP Resolution 15/2006 and 14/2012. 8 Japanese and Korean companies are exceptions to this rule.
of its GDP by 40-45% until 2020, to raise the level of non-fossil fuels in primary energy consumption to 15% until 2020, and to increase forest coverage by 40 million hectares, raising forest stock by 1.3 billion cubic meters, all pledges having 2005 as baseline (UN 2010b). In November 2014, in a bilateral agreement with the United States, China stated its intention
to peak CO2 emissions at least until 2030 and to increase the share of non-fossil fuels in
primary energy consumption to around 20% at least until the same year. In its Intended Nationally Determined Contribution (INDC), China pledged, as general commitments: to peak its emissions at least by 2030 and to reduce carbon intensity of its GDP by 60-65%; to increase the share of non fossil fuels in primary energy consumption to around 20%; and to increase the forest stock volume by around 4.5 billion cubic meters, all by 2030 having 2005 numbers as baseline (UN 2015). The pledge was classified generally as medium, except for the carbon intensity target, considered weak (Climate Action Tracker 2015). The Chinese INDC is not ambitious. In 2015, the country had 17% of the world population and around 28% of global carbon emissions, and it is possible that the latter will amount to a third of global emissions by 2030, thus China is the most important player in the global decarbonization dynamics. A more ambitious Chinese pledge is a necessary condition for a consistent international advance on climate change. On a positive note, the Chinese pledge is very credible because China has shown capacity of implementing the Copenhagen commitment.
Russia is an extremely conservative player in the climate regime. Its engagement in the climate regime is very peculiar. During the negotiations of the Kyoto Protocol, its goal was
to maximize the sales of carbon credits (“hot air”)10 to other developed countries. When the
Kyoto Protocol was ratified and the United States withdrew, Russia understood that the market for “hot air” would be smaller; it ratified the Kyoto Protocol in exchange for its acceptance as a member of the World Trade Organization. Russia is, among the four countries object of the paper, the only in the Annex I of the Kyoto Protocol. Its emissions decreased around 13% between 1990 and 2012, mostly due to reduced economic activity, not for its efforts to decarbonize its economy. At COP 15, Russia pledged a 15-25% reduction in emissions compared to 1990 levels, the range depending on (i) “appropriate accounting of the potential of Russia’s forestry in frame of contribution in meeting the obligations of the anthropogenic emissions reduction” and (ii) “undertaking by all major emitters the legally binding obligations to reduce anthropogenic GHG emissions” (UN 2010a). In its INDC, Russia pledged to reduce 25-30% of its emissions between 2020 and 2030, compared to 1990 levels, “subject to the maximum possible account of absorbing capacity of forests” (UN 2015). The latter pledge was classified as inadequate, not in line with a fair approach to reach global average temperature increase within
2oC (Climate Action Tracker 2015). Considering the gap between Russia’s pledges and their
implementation, the country’s INDC can be considered the least ambitious and least credible (of being implemented) among G20 countries, except maybe Saudi Arabia.
India pushes conservative standings in the climate regime, and is one of the most active defenders of the common but differentiated responsibilities and historical responsibilities
discourse. At COP 15, India pledged to reduce CO2 emissions per unit of GDP between
20-25% by 2020, compared to the 2005 levels, and it would, in order to achieve the target: (i) increase fossil fuel standards by 2011; (ii) adopt building energy codes by 2012; (iii) increase forest cover to sequester an amount equivalent to 10% of its annual carbon emissions; and (iv) increase electricity from wind, solar and small hydropower from 8 to 20% by 2020 (UN 2010b). India resists the idea of compulsory reductions of emissions trajectory for developing countries, interpreting the doctrine of common but differentiated responsibilities almost as if nothing is common and everything is differentiated. In its INDC, India pledged (i) to reduce the emissions intensity of its GDP by 33 to 35% by 2030 from 2005 level, (ii) to achieve about 40% cumulative electric power installed capacity from non-fossil fuel based energy resources by 2030 – “with the help of transfer of technology and low cost international finance including from Green Climate Fund (GCF)” –, and (iii) to create an additional carbon sink of 2.5 to
3 billion tons of CO2 equivalent through additional forest and tree cover by 2030 (UN 2015).
The Climate Action Tracker (2015) classified the pledge as medium because it employs a methodology very sensitive to per capita emissions – if absolute amounts were the baseline, the pledge would have been considered weak. India’s Paris pledge, however, is not ambitious.
explained above, the Brazilian INDC is not ambitious. In addition, the current deep governance crisis in Brazil and the weak implementation of the Climate Law affects the credibility of the pledge’s implementation.
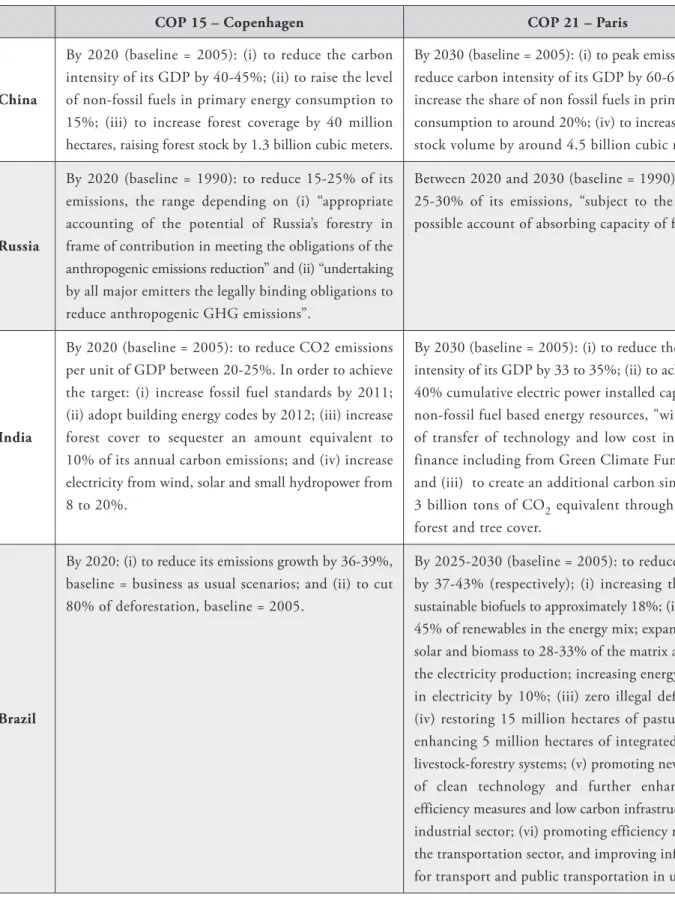
Table 3: Commitments in the climate regime
COP 15 – Copenhagen COP 21 – Paris
China
By 2020 (baseline = 2005): (i) to reduce the carbon intensity of its GDP by 40-45%; (ii) to raise the level of non-fossil fuels in primary energy consumption to 15%; (iii) to increase forest coverage by 40 million hectares, raising forest stock by 1.3 billion cubic meters.
By 2030 (baseline = 2005): (i) to peak emissions; (ii) to reduce carbon intensity of its GDP by 60-65%; (iii) to increase the share of non fossil fuels in primary energy consumption to around 20%; (iv) to increase the forest stock volume by around 4.5 billion cubic meters.
Russia
By 2020 (baseline = 1990): to reduce 15-25% of its emissions, the range depending on (i) “appropriate accounting of the potential of Russia’s forestry in frame of contribution in meeting the obligations of the anthropogenic emissions reduction” and (ii) “undertaking by all major emitters the legally binding obligations to reduce anthropogenic GHG emissions”.
Between 2020 and 2030 (baseline = 1990): to reduce 25-30% of its emissions, “subject to the maximum possible account of absorbing capacity of forests”.
India
By 2020 (baseline = 2005): to reduce CO2 emissions per unit of GDP between 20-25%. In order to achieve the target: (i) increase fossil fuel standards by 2011; (ii) adopt building energy codes by 2012; (iii) increase forest cover to sequester an amount equivalent to 10% of its annual carbon emissions; and (iv) increase electricity from wind, solar and small hydropower from 8 to 20%.
By 2030 (baseline = 2005): (i) to reduce the emissions intensity of its GDP by 33 to 35%; (ii) to achieve about 40% cumulative electric power installed capacity from non-fossil fuel based energy resources, "with the help of transfer of technology and low cost international finance including from Green Climate Fund (GCF)"; and (iii) to create an additional carbon sink of 2.5 to 3 billion tons of CO2 equivalent through additional forest and tree cover.
Brazil
By 2020: (i) to reduce its emissions growth by 36-39%, baseline = business as usual scenarios; and (ii) to cut 80% of deforestation, baseline = 2005.
By 2025-2030 (baseline = 2005): to reduce emissions by 37-43% (respectively); (i) increasing the share of sustainable biofuels to approximately 18%; (ii) achieving 45% of renewables in the energy mix; expanding wind, solar and biomass to 28-33% of the matrix and 23% of the electricity production; increasing energy efficiency in electricity by 10%; (iii) zero illegal deforestation; (iv) restoring 15 million hectares of pastureland and enhancing 5 million hectares of integrated cropland-livestock-forestry systems; (v) promoting new standards of clean technology and further enhance energy efficiency measures and low carbon infrastructure in the industrial sector; (vi) promoting efficiency measures in the transportation sector, and improving infrastructure for transport and public transportation in urban areas.
Conclusion
Global decarbonization is key to mitigate climate change. China, India, Russia and Brazil are among the greatest carbon emitters. They are, together with the United States, the European Union, Japan and Korea, key climate powers – countries with relevant GHG emissions in total global amount, as well as human and technological capacity to implement decarbonization (Viola et al. 2012). Action taken – or not taken – by climate powers determine the intensity and scale of climate change globally.
The BRIC countries have different GHG emissions profile. Industrial processes are key emitting sectors in China, agriculture is central in Brazil and India, and energy is relevant in all of them. Due to the centrality of energy use in total global emissions, this article has analyzed energy decarbonization efforts in the four countries. It concludes that they have been promoting energy decarbonization, but that measures have been dissimilar, taking their rationality and scale into account.
In China, energy decarbonization efforts have been pushed by demands to reduce air pollution and by investments in low carbon energy technology. Low carbon energy production has increased consistently in the last decade, though low carbon sources still occupy a small share of the Chinese energy matrix – increase in energy consumption and the exploitation of large and cheap coal reserves are the main reasons for it. China has been adopting important measures to increase energy efficiency. By looking at the implementation of policies in China so far, the country is embracing energy decarbonization. However, its pace is not fast enough to stabilize GHG emissions. Given that China is a global GHG powerhouse, this is not good news to climate change mitigation: if the country were to be a responsible player in the regime, its GHG reduction should be a lot sharper.
Russian emissions decreased due to reduced economic activity, not decarbonization efforts. It has enacted policies in support of energy efficiency and low carbon energy, but implementation has been weak. The country is still very dependent on the exploitation of fossil fuels, both to answer its energy requirements and as a source of income, since it is one of the world’s greatest exporters of oil and gas. Russia is one of few countries that would benefit, temporarily, from climate change – frozen land would become available for agriculture –, and so government does not prioritize the issue. There is no strong evidence of a changed perspective regarding decarbonization in Russia.
falling behind. It is no surprise that India remains one of the most conservative powers in the climate regime.
In Brazil, deforestation has been the greatest source of GHG emissions, and climate policy has focused on tackling it. Emissions from energy, however, have been increasing, both due to decrease of deforestation as well as to the rising of use of fossil fuels. Brazilian potential to develop new renewables – wind, solar, biomass – is one of world’s greatest. These sources have been expanding timidly; but there are important barriers to their further development, related to the political entanglement of energy sectors in the politics, and the lack of consistent and large-scale incentives to the development of low carbon technology. The country has been mostly conservative in the climate regime, occasionally defending more moderate positions. However, due to its weight in the global carbon cycle, Brazil is lagging behind its potential of becoming a reformist power in the regime.
The four countries have been conservative climate players. Their INDCs, for instance,
should be a lot more ambitious in order to put the world on track of keeping close to 1.5oC
increase in global average temperature by 2100. They all should present more ambitious standings: China and India due to the current weight of their emissions in total global emissions; Russia due to its historical contribution to the increase of GHG concentration in the atmosphere; and Brazil due to its potential of further decreasing emissions and its alleged climate leadership. Their commitment to decarbonization should transcend the multilateral climate regime: further involvement with other multilateral fora, such as the International Renewable Energy Agency (IRENA) – whose creation was opposed by the four countries; yet later, China, India and Russia became members – and with decarbonization measures promoted by G20. These would be important signs of change in perspective regarding the issue.
Bibliographic references
ANEEL – Agência Nacional de Energia Elétrica. Anuário estatístico de energia elétrica 2014,
2014. <http://www.epe.gov.br/AnuarioEstatisticodeEnergiaEletrica/Forms/Anurio.aspx>. Accessed November 18, 2015.
Brazil. Plano Nacional sobre Mudança do Clima (National Climate Change Plan), 2008.
<http://www.mma.gov.br/estruturas/smcq_climaticas/_arquivos/plano_nacional_mudanca_clima.pdf>. Accessed November 18, 2015.
Brazil. Política Nacional sobre Mudança do Clima (National Climate Change Policy – Law
n. 12187 and Decree n. 7390/2010), 2009. <http://www.planalto.gov.br/ccivil_03/_ato2007-2010/2009/lei/l12187.htm>. Accessed November 18, 2015.
Brazil. Estimativas anuais de emissões de gases de efeito estufa no Brasil, 2013. <http://gvces.com. br/arquivos/177/EstimativasClima.pdf>. Accessed November 18, 2015.
Climate Action Tracker. Tracking INDCs, 2015. <http://climateactiontracker.org/indcs.html>. Accessed December 15, 2015.
EIA – US Energy Information Administration. International Energy Statistics, Eurasia, 2014.
<http://www.eia.gov/cfapps/ipdbproject/iedindex3.cfm?tid=44&pid=44&aid=2&cid=r4,&syid =1990&eyid=2012&unit=QBTU>. Accessed November 18, 2015.
EPE – Empresa de Pesquisa Energética. Balanço Energético Nacional 2013, 2013. <https://ben.
epe.gov.br/downloads/Relatorio_Final_BEN_2013.pdf>. Accessed November 18, 2015.
EPE – Empresa de Pesquisa Energética. Resenha Energética Brasileira exercício de 2014, 2015a.
<http://www.mme.gov.br/documents/1138787/1732840/Resenha+Energética+-+Brasil+2015. pdf/4e6b9a34-6b2e-48fa-9ef8-dc7008470bf2>. Accessed December 15, 2015.
EPE – Empresa de Pesquisa Energética. Balanço Energético Nacional 2015, 2015b. <https://ben. epe.gov.br>. Accessed December 15, 2015.
Fan, C. Cindy. “China’s Eleventh Five-Year Plan (2006–2010): from ‘Getting Rich First’ to
‘Common Prosperity”. Eurasian Geography and Economics 47, n. 6 (2006): 708–723.
Held, David, Eva-Maria Hag and Charles Roger. “The governance of climate change in China”.
IEA – International Energy Agency. 2014 Key world energy statistics, 2014a. <http://www.iea.org/ publications/freepublications/publication/KeyWorld2014.pdf>. Accessed November 18, 2015.
IEA – International Energy Agency. Statistics, non-member countries, China, policies and
measures for this country, 2014b. <http://www.iea.org/countries/non-membercountries/ chinapeoplesrepublicof/>. Accessed November 18, 2015.
IEA – International Energy Agency. Statistics, non-member countries, Russia, policies and measures for this country, 2014c. <http://www.iea.org/countries/non-membercountries/russianfederation/>. Accessed November 18, 2015.
IEA – International Energy Agency. Energy Policies Beyond IEA Countries – Russia 2014, 2014d.
<http://www.iea.org/Textbase/npsum/russia2014sum.pdf>. Accessed November 18, 2015.
IEA – International Energy Agency. Statistics, non-member countries, India, policies and measures for this country, 2014e. <http://www.iea.org/countries/non-membercountries/india/>. Accessed November 18, 2015.
IEA – International Energy Agency. World Energy Outlook 2014, energy access database, 2014f.
<http://www.worldenergyoutlook.org/resources/energydevelopment/energyaccessdatabase/>. Accessed December 2, 2015.
India. 10th Five Year Plan, 2002. Accessed December 2, 2015. <http://planningcommission.
nic.in/plans/planrel/fiveyr/welcome.html>.
India. 11th Five Year Plan, 2007. Accessed December 2, 2015. <http://planningcommission.
nic.in/plans/planrel/fiveyr/welcome.html>.
India. National Action Plan on Climate Change, 2008.
<http://www.moef.nic.in/modules/about-the-ministry/CCD/NAP_E.pdf>. Accessed December 2, 2015.
India. 12th Five Year Plan, 2013. Accessed December 2, 2015. <http://planningcommission.
nic.in/plans/planrel/fiveyr/welcome.html>.
INPE – Instituto Nacional de Pesquisas Espaciais. PRODES Project (database), 2015.
<http://www.obt.inpe.br/prodes/index.php>. Accessed December 2, 2015.
MME – Ministério de Minas e Energia. Plano Nacional de Eficiência Energética, 2011.
Nogueira, Luiz A. Horta and Jonas Carvalheira Costa. Opções tecnológicas em energia: uma visão brasileira. Fundação Brasileira para o Desenvolvimento Sustentável – FBDS, 2012. <http://fbds. org.br/fbds/IMG/pdf/doc-531.pdf>. Accessed December 2, 2015.
Reegle – Clean Energy Info Portal. Information on China, 2013a. <http://www.reegle.info/
countries/china-energy-profile/CN>. Accessed December 2, 2015.
Reegle – Clean Energy Info Portal. Information on India, 2013b. <http://www.reegle.info/
countries/india-energy-profile/IN>. Accessed December 2, 2015.
Rosen, Daniel H. and Trevor Houser. “China energy: a guide for the perplexed”. Peterson
Institute for International Economics working paper, 2007. <http://www.iie.com/publications/ papers/rosen0507.pdf>. Accessed November 18, 2015.
Russia. Climate Doctrine of Russia, unofficial translation, 2009a. <http://archive.kremlin.ru/ eng/text/docs/2009/12/223509.shtml>. Accessed December 2, 2015.
Russia. Russia Energy Strategy to 2030, 2009b. <http://www.energystrategy.ru/projects/docs/
ES-2030_(Eng).pdf>. Accessed December 2, 2015.
The Pew Charitable Trusts. Who is winning the energy race, 2012. <http://www.pewenvironment. org/news-room/reports/whos-winning-the-clean-energy-race-2012-edition-85899468949>. Accessed July 12, 2015.
UN – United Nations. Quantified economy-wide emissions targets for 2020, 2010a. <http://unfccc. int/meetings/copenhagen_dec_2009/items/5264.php>. Accessed December 2, 2015.
UN – United Nations. Nationally appropriate mitigation actions of developing country Parties,
2010b. <http://unfccc.int/meetings/cop_15/copenhagen_accord/items/5265.php>. Accessed December 2, 2015.
UN – United Nations. Intended Nationally Determined Contributions, 2015. <http://www4.
unfccc.int/submissions/indc/Submission%20Pages/submissions.aspx>. Accessed October 2, 2015.
Viola, Eduardo and Larissa Basso. “Amazonian policy and politics, 2003-13: deforestation,
hydropower and biofuels”. NOREF – Norwegian Peacebuilding Resource Centre Report, 2014.
Viola, Eduardo and Larissa Basso. (2015) “Brazilian Energy-Climate Policy and Politics towards
Low Carbon Development”. Global Society, v. 29, issue 3. <http://www.tandfonline.com/doi/
abs/10.1080/13600826.2015.1028904#.VdXF43hRfdk>. Accessed December 2, 2015.
Viola, Eduardo; Matias Franchini; Thais Lemos Ribeiro. (2012) “Climate governance in an
international system under conservative hegemony: the role of major powers”. Revista Brasileira
de Política Internacional, v. 55, special edition, 2012, p. 09-29.
World Bank. Statistics online, indicators, 2013. <http://data.worldbank.org/indicator>. Accessed November 18, 2015.
WRI – World Resources Institute. China’s energy emissions, 2015a. <http://www.wri.org/
blog/2015/06/infographic-what-do-your-countrys-emissions-look>. Accessed December 2, 2015.
WRI – World Resources Institute. Chinese emissions profile 1990-2012, 2015b. <http://cait.wri. org/profile/China>. Accessed December 2, 2015.
WRI – World Resources Institute. Russian emissions profile 1990-2012, 2015c. <http://cait.wri. org/profile/Russian%20Federation>. Accessed December 2, 2015.
WRI – World Resources Institute. Indian emissions profile 1990-2012, 2015d. <http://cait.wri.
org/profile/India>. Accessed December 2, 2015.
WRI – World Resources Institute. Brazilian emissions profile 1990-2012, 2015e. <http://cait.