© FECAP
RBGN
Review of Business Management
DOI:10.7819/rbgn.v17i57.2253 Received on
November 17, 2014
Approved on
November 14, 2015
1.Leticia de Almeida Costa
Doctor of Science in Production Engineering Pontiical Catholic Univesity of Rio de Janeiro
(Brazil)
[leticiaalmeidacosta@gmail.com]
2.Felipe Philadelpho Azevedo
Master of Science in Production Engineering Pontiical Catholic Univesity of Rio de Janeiro
(Brazil)
[felipephiladelph@gmail.com]
3.Carlos Patricio Samanez
Doctor of Science in Business Administration
Fundação Getúlio Vargas – FGV-SP
(Brazil)
[cps@puc-rio.br]
Investment strategies in the Brazilian
industry of aluminum cans: an analysis
in the context of real options games
Leticia de Almeida Costa, Felipe Philadelpho Azevedo
Department of Industrial Engineering Pontifícia Universidade Católica do Rio de Janeiro, RJ, Brazil
Carlos Patrício Samanez
Department of Industrial Engineering, Pontifícia Universidade Católica do Rio de Janeiro, and Faculty of Economics, Universidade do Estado do Rio de Janeiro, RJ, Brazil.
Responsible editor: Andre Taue Saito, Dr. Evaluation process: Double Blind Review
ABStRACt
Objective – he purpose of this article is to analyze the impact of preemption (irst move advantage, with the consequent emergence of negative externalities to competitors) in situations that consider the optimal moment for investment, in the context of asymmetric oligopolies and using options games method.
Design/methodology/approach – he developed model was applied to the Brazilian aluminum can industry, in which three irms made up an asymmetric oligopoly, allowing strategic interactions and their consequences on irms’ investment decisions to be analyzed.
Findings – In situations of preemption, the results show the relevance of using a dynamic model, allowing us to observe the importance of obtaining a competitive advantage in cost, and showing that it is possible to obtain monopoly proits or take advantage of isolated expansion for a longer period. If this advantage is great, rivals’ threat of preemption can be considered irrelevant, and that the irm will invest in monopolistic time, ignoring the possibility of rivals’ entry.
Practical implications – In a competitive environment, irms need to decide whether the best strategy is to invest earlier, acquiring a competitive advantage over their rivals, or to postpone their investments, to acquire more information and mitigate the eventual consequences of market uncertainties. his work shows how to do it.
Originality/value – his is the irst work that, by applying real options games, studies the impact of preemption of investment in oligopolistic asymmetric environment in the Brazilian industry of aluminum cans.
Investment strategies in the Brazilian industry of aluminum cans: an analysis in the context of real options games
1 IntRODuCtIOn
The most traditional methodology in capital budgeting is the discounted cash low (DCF) method – which is analysis of the feasibility of an investment project based on expected future cash lows, and on analysis of its main index, the also traditional Net Present Value (NPV). here are several disadvantages which make the use of this index inappropriate in certain cases. Firstly, because NPV analyzes investment opportunities as “now or never” decisions, under passive management, without considering the flexibilities that are inherent to most capital investments, which is not very realistic, and ignores the consequences of possible actions by competitors (Samanez, Ferreira, Nascimento, Costa & Bisso, 2014).
Due to increasingly sophisticated technologies, and to markets becoming more and more dynamic and competitive, the value of lexibilities inherent to capital investment projects must be considered in analysis of its economic feasibility. As opposed to the traditional approach, the methodology known as Real Options considers the dynamic nature and the lexibilities involved in decision-making processes. However, this method presumes that investment decisions are made in an individual way, ignoring possible competitive endogenous interactions. A third methodology, the Game heory, when applied to investment decisions, describes and anticipates rational behavior in environments wherein individuals are independent and interact with each other. In this situation, the actions of a irm have an efect on rival irms, and the latter, in turn, have an impact on the former. When the analysis is applied in a context of imperfect competition, such as is the case in oligopolies, a small number of irms with similar interests interact in such a way that their actions may inluence of each other’s proits and individual values. Although in this methodology the efects of competition and opportunity for cooperation are modelled endogenously, the Game heory fails to explain
why irms must have incentives to remain lexible so as to be able to react to market uncertainties.
Games with real options are, as such, the integrated solution used to overcome the deiciencies of the abovementioned methodologies. The method was developed to capture the dynamics of strategic interactions in a competitive and uncertain environment, and is capable of guiding managerial decisions, enabling a more complete quantiication of market opportunities, since it evaluates the sensitivity of strategic decisions to exogenous variables and competitive situations (Grenadier, 2002).
In academic literature, there are presently studies that analyze the relationship between managerial lexibility and competitive strategy through analysis of real options and game theory. Among them, one may highlight the model developed by Smit and Ankum (1993), wherein the authors analyze a game of perfect equilibrium for investment making decisions in one or two stages for two irms. Smit and Trigeorgis (2009) have analyzed a duopoly competition, and Huisman (2001) and another study have assumed in their studies that two firms may simultaneously make decisions under demand uncertainty and competition (Huisman, Kort, Pawlina and hijssen, 2005). In another study, Smit and Trigeorgis (2004) have illustrated the use of real options and game theory to analyze investment opportunities in case of competitive strategy decisions under uncertainty.
Costa and Samanez (2008) presented a mathematical model based on real options theory and on game theory applied to the residential real estate market in the city of Rio de Janeiro, Brazil. he central idea of the model is the search for the balance between the demand and supply of residential units in a particular region, considering the efect on the prices of these assets and on the attitude of competitors in this market.
emerge. To solve this problem, the authors suggest the use of a method that involves employing mixed symmetric strategies based on Fudenberg and Tirole’s model (1985), who discussed mixed strategies in the deterministic case. hey reveal that, in many cases, it is incorrect to state that, in balance, the probability of both irms investing simultaneously, when investing is good for only one of them is zero. Huisman and Kort (1999) had already demonstrated this in the context of symmetric irms, and Dias and Teixeira (2010) described this result in the symmetric case, also showing the necessary conditions for the asymmetric case.
Using games with options, Angelou and Economides (2009) modeled the competitive interactions that emerge in the sector of communications and information technology. The model developed was applied to a real case study, showing that the problem can be formulated and solved by the applied approach.
he main purpose of this article is to analyze the impact of preemption (irst move advantage, with the consequent emergence of negative externalities to competitors) in situations that consider the optimal moment for investment, in the context of asymmetric oligopolies and using options game method. he developed model was applied to the Brazilian aluminum can industry, in which three irms made up an asymmetric oligopoly, allowing strategic interactions and their consequences on irms’ investment decisions to be analyzed.
In situations of preemption, article results show the relevance of using a dynamic model in subject modeling, allowing us to observe the importance of obtaining a competitive advantage in cost, and showing that it is possible to obtain monopoly proits or take advantage of isolated expansion for a longer period. he results also show that, if competitive advantage is very great, rivals’ threat of preemption can be considered irrelevant, and that the company will invest in monopolistic time, ignoring the possibility of rivals’ entry.
his paper is divided as follows. Section 2 presents the concepts of options games. Section 3 presents the Brazilian aluminum can industry.
Section 4 develops the options games model for asymmetric oligopolies. Section 5 applies the proposed model to the market of aluminum cans in Brazil, and presents the results of a sensitivity analysis to various parameters, and section 6 presents the paper’s conclusions.
2 ReAL OPtIOnS gAMeS
he optimal moment for investment is associated to the choice of the ideal moment to make an investment. How should one decide between investing now, later on, or abandoning a project? A irm in a competitive environment may have an optimal investment policy that is completely diferent from a monopolistic irm. In situations in which there is the possibility of competitors anticipating their rival’s actions, the value of postponing investments deteriorates and its value decreases. According to Chevalier-Roignant and Trigeorgis (2011), the presence of competitors generally leads irms to invest earlier than in the monopolistic case.
In a competitive environment, irms need to decide whether the best strategy is to invest earlier, acquiring a competitive advantage over their rivals, or to postpone their investments, to acquire more information and mitigate the eventual consequences of market uncertainties. Exogenous uncertainties, in the form of luctuating demand, prices or production costs, may inhibit a irm’s investments. In contrast, facing presence of pressures or threats from rival irms, it may create a competitive advantage if it is the irst to invest. his trade-of may be examined through a combination of game theory with real options.
3 the BRAzILIAn ALuMInuM CAn InDuStRy
Investment strategies in the Brazilian industry of aluminum cans: an analysis in the context of real options games
abralatas.org.br/), Rexam PLC, Crown Co. and Latapack-Ball Corporation are three irms in Brazil with an approximate production capacity of 28 billion units per year. he industry as a whole is characterized by high entry barriers, since the economies of scale enabled by many factories favor large producers. Shipping costs are substantial and, therefore, a key factor of competitive advantage is the proximity of factories to places where clients obtain supplies.
Aluminum cans are used to package beverages, both alcoholic and non-alcoholic. Based on the annual reports of Rexam (2012),
of Crown Holdings Inc. (2012) and of the
Latapack-Ball Corporation (2012), the main products that use aluminum cans are beer and soda, which together, in 2012, added up to 76% of the can consumption all over the world. Other products with smaller participation are ice tea, cofee, juices and energy drinks, to name a few. he increase in preference for can results from several factors, such as: practical and easy transportation and refrigeration, respect for the environment, and the fact that cans are recycled rapidly and economically. In 2010, Brazil became the third largest beer producer in the world, surpassing Germany and Russia, and second only to China and the USA. he exponential increase of consumption in the northeast of Brazil and the increase in per capita income were the main drivers of this growth. Moreover, the creation of stricter traic legislation led to the migration of beer consumption from bars (where glass bottles are predominant) to homes, boosting sales of cans in supermarkets. Over the next few years, international events such as the 2016 Olympic Games will further stimulate the consumption of aluminum cans in Brazil.
4 the OPtIOnS gAMeS MODeL – ASyMMetRIC OLIgOPOLy
Considering the Brazilian industry made up of three oligopolistic irms of diferent sizes, competing in a market where there is a preemption
threat and irms are not homogeneous (for the same investment, a firm has lower operating costs than another), this section, in the context of games with real options, equations and analytical solutions that govern the investment decision-making process for each of the three irms will be presented.
In the case applied to the Brazilian aluminum can industry, we consider three irms. One irm with a low cost (l), another with intermediate cost (int), and the last with high cost (h), in such a way that
.
. All of these irms operate in the market and have the option to expand their can production, making a new investment (I), the same for all the irms. However, since their operational costs difer, the oligopoly is asymmetric, and there is, thus, a competitive advantage for the company with the smallest operational cost. When one of the irms decides to expand, the proit of the others is altered, that is, the model considers negative externalities.Considering market uncertainties, the proposed model will suppose that the firm’s proit comprises two parts: a determining part, representing the irm’s installed capacity (present and future), and is represented by
(where i is equal to l, int or h), and a stochastic multiplicative shock,
, which represents industry uncertainty. We presumed that this shock follows a geometric brownian motion (GBM) process represented by equation (1) (Dixit & Pindyck, 1994).
���
�=
���
���
+
���
���
� (1)where is the tendency, σ is the volatility, and
is the increment of Wiener given by equation (2).
��
�=
�
��
, with
�
~
�
(0, 1)
(2)where N(0,1) is a standardized Normal distribution (average zero, variance 1).
(3)
where n is the number of irms that have already carried out the option of market expansion.
When a irm carried out its option of expansion (investing I), this afects the other irms’ proits, since the model considers the possibility of negative externality in prices, given by the demand curve (an increase in quantity produced reduces the inal product price).
he Leader (L) shall be deined as the sole irm that carried out its option for expansion. he natural order, due to competitive advantage, is that the irm with lower costs becomes the
Leader (Ll). Under certain conditions, the high-cost irm coming before the low-high-cost one can be subgame-perfect Nash equilibrium (SPNE), as shown by Dias and Teixeira (2010) in the context of asymmetric duopoly. But this article will only address the most intuitive SPNE.
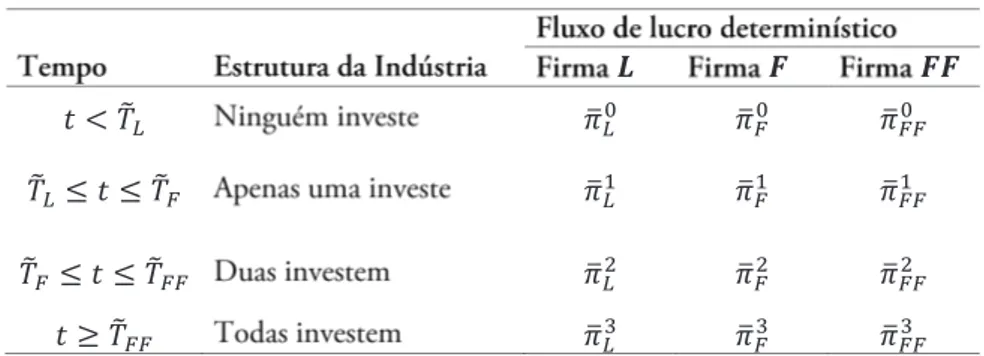
When a irm invests after the Leader, it becomes the First Follower. Following the same reasoning, the irm with intermediate costs shall be the second to invest (Fint). If two irms have already expanded their production and a third irm decides to invest, that irm shall be the Second Follower. Furthermore, according to the natural order, it must be the irm with higher costs (FFh). Table 1 relates the deterministic proit lows of each of the three irms with the four possible stages of industry development.
tABLe 1 – Oligopoly proit in four stages of development
The solution can be found through backwards induction. In this approach, irst it is necessary to estimate the value at the node of the inal decision, in our case the trigger (the value of the irm that sets of the option to invest) of the Second Follower, to then calculate the trigger of the First Follower and, inally, the trigger for
the Leader. According to Chevalier-Roignant and Trigeorgis (2011), the expected present value of the Second Follower irm (in t0 = 0) investing in expansion over time
, using the concepts of expected value for the stochastic discount factor (Dias, 2015; Dixit & Pindyck, 1994), may be deined by equation (4):
(4)
where is the expected value of the stochastic discount factor, and δ is the rate of distribution of the irm’s dividends. he values above are for
Investment strategies in the Brazilian industry of aluminum cans: an analysis in the context of real options games
The firm that invests last maximizes its value by selecting the optimal moment for investing, that is, selecting the trigger over time
. As per the irst order condition, we take the partial derivative of FF0 in relation to the stochastic variable XFF, equalizing the result with zero and obtaining the following equation (Chevalier-Roignant and Trigeorgis, 2011):
he stochastic discount factor, which used to be a function of time, is now a function of value XFF (there are two equivalent strategies: the investor seeks the optimal moment to make his decision, or the optimal target level for investing – value of the stochastic shock) (Dias, 2015; Dixit and Pindyck, 1994).
he derivative of the expected value of the discount factor in relation to XFF is:
(9)
Replacing equations (7) and (9) in equation (5), it is then possible to ind the value for the trigger (XFF) of the Second Follower irm, given by the following equation (10):
(10)
he expected present value of the First Follower irm (over time t0 = 0) investing in expansion at trigger
, for
, is given by equation (11):
(11)
If there was no threat of preemption, the First Follower (Fint) would invest at the trigger point that would maximize the firm’s value. However, due to the threat of preemption, the possibility exists where it may not wait as long to invest. he Second Follower (FFh, for being the third to invest) may have an incentive to become the First Follower (Fh). If the value of the irm as First Follower is greater than its value as the Second Follower, that is, if Fh>FFh. herefore, the strategy of the First Follower irm (Fint) will depend on the size of its competitive advantage. If this advantage is big enough, it may therefore not have to worry about preemption, which occurs when the Second Follower irm (FFh) is never better of as First Follower (Fh). In this case, the First Follower irm (Fint) shall invest by choosing its trigger in a monopolistic manner, which shall be designated by . In this context, using the irst order condition to maximize the irm’s value, one must take the partial derivative of F0 in relation to stochastic variable , equalizing the result to zero and obtaining the following equation:
(12)
he value for the trigger without the threat of preemption shall then be:
(13)
In case the competitive advantage is small, there may be a region in which the Second Follower irm (FFh) will be better of investing as the First Follower (Fh). In this scenario, the optimal strategy of the second irm, to avoid (5)
(6)
(7)
preemption, is to invest when the value of the Second Follower (FFh) is equal to its value as First Follower (FFh), that is, when Fh =FFh. herefore, the trigger for preemption of the First Follower irm (Fh) is given by:
(14)
he trigger for the First Follower irm will be the minimum value between the trigger calculated under monopolistic competition and the preemption trigger:
(15)
According to Chevalier-Roignant and Trigeorgis (2011), the expected present value of the leading irm (at time t0 = 0) investing in expansion at the trigger
is:
(16)
Since the value of the irm depends on the initial state of demand, the following cases are possible:
• For
, only the Leader irm invests immediately:
(17)
• For
, the Leader irm and First Follower irm invest over time t=0:
(18)
• For , all three firms invest immediately:
(19)
he same reasoning used in analyzing the trigger XF shall be used for the Leader irm. In the absence of the preemption threat, the Leader irm (in this case Ll) would invest in the trigger that would maximize the irm’s value. However, due to preemption threat, the possibility exists that it cannot wait that long to invest. he First Follower may have incentives to become Leader (Lint). his will occur if the value of that irm as the Leader is greater than its value as the First Follower, that is, if Lint > Fint.
he strategy of the Leader irm (Ll) shall depend on the size of its competitive advantage. If the advantage is great enough, it may not have to worry about preemption. hus, it will occur whenever the First Follower irm (Fint) is never better of as the Leader (Lint). In this case, the Leader irm (Ll) shall invest by choosing its trigger in a monopolistic manner, which shall be called . In this case, using the irst order condition to maximize the irm’s value, the partial derivative of L0 must be taken, in relation to the
variable of stochastic and equal the result to zero (Chevalier-Roignant and Trigeorgis, 2011). Proceeding accordingly, the value for the trigger without the threat of preemption shall be given by the following equation:
(20)
Investment strategies in the Brazilian industry of aluminum cans: an analysis in the context of real options games
(21)
he trigger of the Leader irm shall be the minimum value between the trigger calculated in a monopolistic manner and the preemption trigger:
(22)
The firms shall compete in the form of a Cournot oligopoly. In a market, with n oligopolistic firms competing in quantity, producing a homogenous good, where each irm i has a marginal cost of production ci, the demand shall be represented by the linear function given by the equation (23).
(23)
he proit function of irm is given by:
(24)
where Q – i gives us the total quantity produced by all the irms in the market except for irm i, with QT = qi +Q – i. To obtain the Cournot–Nash equilibrium, one must ind the proile for the strategy for optimal production
in such a manner that each irm i maximizes its proit considering their rivals’ choices as a given. his leads us to the following irst order condition:
(25)
(26)
In the Cournot oligopoly model, with asymmetric irms, we must solve the following system of n equations and n variables:
(27)
Solving the system, one inds the total quantity produced in this market:
(28)
where
m que é
gives us the average cost of production for the industry.
he individual quantity of each irm is obtained by replacing the industry’s total quantity in each equation of the system (27):
(29)
he equilibrium price shall be:
(30)
he proit of irm i shall be given by:
(31)
where is the average production costs of all market irms, except for irm i.
5 A P P Ly I n g t h e M O D e L tO t h e B R A z I L I A n A L u M I n u M C A n InDuStRy
In accordance with the CAPM (Capital Asset Pricing Model), the risk premium (RP) that will be used in this application is given by:
(32)
hus, a good approximation for the risk free rate for Brazil is the diference between those values, that is, r=8,25%. he estimated risk premium (RP) for Brazil is 2.63% per year (Bloomberg). When calculating the sector’s beta, one uses the estimate presented in the report of the Rexam irm (2012), extracted from Bloomberg’s database. he value of the beta used in evaluating the irm was 0.9. hus the annual RP of the aluminum can industry was estimated at 2.37%.
The parameters of the multiplicative stochastic shock, , representing uncertainty in the aluminum can industry, must be estimated. Supposing follows a Geometric Brownian Motion (GBM) in the form of equation (1).
he Brazilian Association of Manufacturers of Highly Recyclable Cans (Abralatas) publishes data regarding the sector in Brazil. As the Brazilian can industry is relatively new, there is limited historic data concerning consumption and production. Dixit and Pindyck (1994) recommend long series (two decades or more) to estimate trends. here is information regarding consumption of cans from 1997 to 2013, which is a very short time interval and probably the trend estimates would not be representative of the sector. Instead of calculating trends, a more qualitative approach shall be conducted. Rexam’s Annual Report (Rexam, 2012) indicates that between the years of 2014 and 2016 growth in Brazil is estimated to be between ive and six percentage points. Since most of this growth is due to international events such as the 2016 Olympic Games, an inferior growth was assumed, equal to three percentage points, to represent long term growth. herefore: α=3%.
In contrast to the trend calculus, an estimate for volatility does not require a large quantity of data. Even with a limited time interval for the aluminum can sector, the linear regression of the data shall result in a good estimate for the variance of the volatility estimator , since it is proportional to
.
Assuming that consumption in the aluminum can market (QT) follows a GBM, the equation in discrete time shall be given by
(33)
where εt is independent and equally distributed and follows a Normal distribution N(0,σ2).
he estimator of volatility (
) is equal to:
(34)
Based on the annual data from this sector from 1990 to 2012, available through the Abralatas website, the square root of data variance is calculated to find an estimate for annual volatility. herefore:
=19,19%.
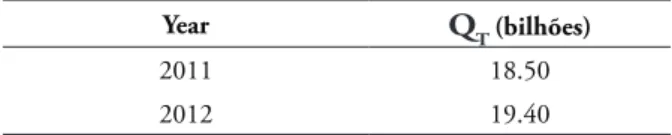
he demand function is linear and the deterministic parties is given by equation (23), where X.P(QT) is the price of an aluminum can, in dollars, in Brazil. To estimate the parameters of the linear function, data was collected from the annual reports of the three irms present in the sector. Considering the total revenue of these irms in Brazil and quantities sold during the years of 2011 and 2012, it was possible to ind a line that represents the Brazilian inverse demand for aluminum cans. Tables 2 and 3 represent the total quantities produced in industry and total net earnings respectively.
tABLe 2 – Annual production of aluminum cans in Brazil in billions of units
year Qt (bilhões)
2011 18.50
2012 19.40
tABLe 3 – Annual net earnings of irms in Brazil (US$ million)
year Ball Crown Rexam
2011 420.38 592.96 1.132,43
2012 432.36 593.22 1.063,58
Investment strategies in the Brazilian industry of aluminum cans: an analysis in the context of real options games
his paper assumes the premise of equal investment among the irms for their expansion in production of aluminum cans. Since the domestic irms import machinery and equipment for building new aluminum factories, this is justiied as they normally deal with the same suppliers. As per the irms’ annual reports, market studies, and sectorial news, the value needed to achieve their investment is quite similar among the competitors. he irms must incur a cost of approximately US$100 million to implement a factory with an annual production capacity of 1
billion aluminum cans. herefore, the investment in billions of dollars shall be I = 0.1.
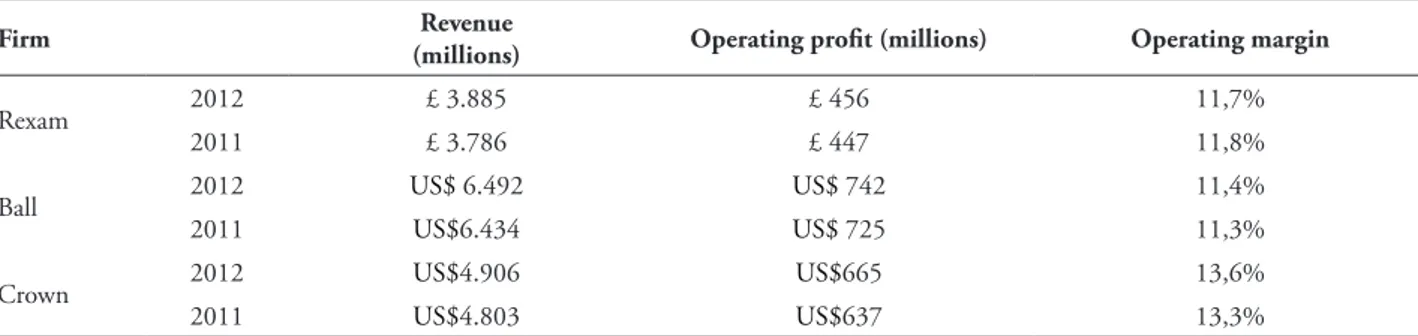
During the calculation of unit production costs (before expansion), information from the annual reports of each one of the firms was used. he unit operational cost of the irms was estimated by multiplying the unit price of sale by the complement of operational margin of each irm. he average operational margin for each irm shall be used. Based on data from Tables 4 and 5, the calculus of the operational costs (US$/can), assuming the 2012 unit prices (US$ 0.11), we have .
tABLe 4 – Operating margin of irms in the sector
Firm Revenue
(millions) Operating proit (millions) Operating margin
Rexam 2012 £ 3.885 £ 456 11,7%
2011 £ 3.786 £ 447 11,8%
Ball 2012 US$ 6.492 US$ 742 11,4%
2011 US$6.434 US$ 725 11,3%
Crown 2012 US$4.906 US$665 13,6%
2011 US$4.803 US$637 13,3%
tABLe 5 – Unit operating cost of irms in the sector
Firm Operating Margin Calculations Operational unit Cost ( )
Rexam (int) 11,75% 88,25% x 0,11 US$ 0,0961
Ball (h) 11,35% 88,65% x 0,11 US$ 0,0965
Crown (l) 13,45% 86,55% x 0,11 US$ 0,0942
he expansion investment shall be modeled through a reduction in the irms’ operational costs. As they compete in terms of quantity, according to the Cournot model, a reduction in cost will lead to the irm increasing the quantity produced. he decrease in operational costs due to investment shall be considered to be 5%. he operational unit costs after expansion shall be given by
.
In the context of Cournot’s asymmetric competition, the proit for irm i shall be given
tABLe 6 – Proit of irms in the four market situations
No Firm Invested
Firm Profit (US$ billions)
����
0 0.234
������
0 0.215
����ℎ
0 0.210
Only the Leader Invested
Firm Profit (US$ billions)
���1� 0.274
���1��� 0.202
����1 ℎ 0.198 Leader and First Follower Invested
Firm Profit (US$ billions)
���2� 0.260
���2��� 0.241
����2 ℎ 0.186
All firms invested
Firma Profit (US$ billions)
���3� 0.247
���3��� 0.227
����3 ℎ 0.223
he irm which has the cost advantage shall produce more than the firm which has a higher cost, thus each irm’s proits shall be diferent. After expansion of the low cost irm as the Leader, both its production and proit shall increase. he increase in production shall decrease the unit market price, consequently reducing the deterministic proits of the intermediate cost and high cost irms.
When the intermediate cost irm’s trigger is reached, it will then act on its option for expansion becoming the First Follower (F). his in turn leads to a reduction in the proits of the low cost irm (which had previously increased its production capacity), as well as the proits of the high cost irm, due to the reduction of the
market price. Following the same reasoning, the expansion of the high cost irm, Second Follower (FF), shall increase its proit and therefore reduce the other irms’ proit.
When analyzing optimal point games, according to Chevalier-Roignant and Trigeorgis (2011), the irst step is to ind the trigger for the Second Follower irm (FF). Previously, we presented the trigger for the Second Follower irm
XFF, given by equation (10). Since that irm is the last one to expand its production, it does not need to concern itself with threats of preemption. he
assumption of the model, ,
implies that the irm with the higher cost h is the Second Follower. herefore, the trigger shall be:
(35)
However, the trigger for the First Follower shall be the minimum one between the trigger calculated in a monopolistic manner and preemption
Investment strategies in the Brazilian industry of aluminum cans: an analysis in the context of real options games
(36)
To calculate the preemption trigger, one must ind the point value where the high cost h irm’s value as First Follower (Fh) is equal to its value as the Second Follower (FFh). To reach this equality, one must ind the value for the
proit lows wherein the low cost irm is the Leader, high cost irm is the First Follower and intermediate cost irm is the Second Follower. Table 7 represents these proits.
tABLe 7 – Proit of the irms considering high-cost Firm as First Follower
No Firm Invested
Firm Profit (US$ billions)
���0� 0.234
���0ℎ 0.210
�������
0 0.215
Only the Leader Invested
Firm Profit (US$ billions)
���1� 0.274
���1ℎ 0.198
����1 ��� 0.202 Leader and First Follower Invested
Firm Profit (US$ billions)
���2� 0.260
���2ℎ 0.236
����2 ��� 0.190 All firms Invested
Firm Profit (US$ billions)
���3� 0.247
���3ℎ 0.223
����3 ��� 0.227
Calculating the trigger for the intermediate cost irm as the Second Follower (XFFint), we obtain that:
(37)
(38)
Replacing the values in the equation and using the Solver function in Excel, we ind the
trigger XFint, that is, the preemption trigger of the intermediate cost irm, .
he intermediate cost irm shall invest in:
(39)
he threat of preemption implies that the intermediate cost irm cannot wait for the point which maximizes its value as the First Follower. Since its cost advantage is not large enough, it needs to invest before in order not to be anticipated by the high cost irm.
he trigger for the Leader irm shall be the minimum between the trigger calculated in a monopolistic manner and the preemption trigger. he monopolistic trigger of the low cost irm is given by:
(40)
To calculate the preemption trigger, one must ind the value for Xt at which intermediate cost the irm is indiferent between investing as the Leader or waiting to invest in XFint, that is, the point at which the value of the intermediate cost irm as the Leader (Lint) is equal to its value as the First Follower (Fint). To ind the value for
Investment strategies in the Brazilian industry of aluminum cans: an analysis in the context of real options games tABLe 8 – Proit of irms considering intermediate-cost irm as
First Follower
No Firm Invested
Firm Profit (billions)
���0��� 0.215
���0� 0.234
����0 ℎ 0.210
Only Leader Invested
Firm Profit (billions)
���1��� 0.254
���1� 0.221
����1 ℎ 0.198
Leader and First Follower Invested
Firm Profit (billions)
���2��� 0.241
���2� 0.260
����2 ℎ 0.186
All firms Invested
Firm Profit(billions)
���3��� 0.227
���3� 0.247
����3 ℎ 0.223
Now, it is possible to calculate the trigger for the low cost irm acting as the First Follower (XFl)
(41)
Next, we may equalize the values of the intermediate cost irm investing as the Leader and First Follower, that is:
(43)
Replacing all the values calculated in the equation and using the Solver function in Excel, one obtains the trigger XLint, that is, the preemption trigger for the low cost irm , thus:
he low cost irm shall invest in:
Carlos Patricio Samanez / Leticia de Almeida Costa / Felipe Philadelpho Azevedo
he threat of preemption implies that the low cost irm cannot wait for the point which maximizes its value as the Leader. Since its cost advantage is not big enough, it needs to invest before in order not to be anticipated by the intermediate cost irm.
At time t = 0, all three irms are active in the market. When the stochastic shock XT reaches the value of 0.290, the low cost irm shall invest the amount I and expand its production. As long as the stochastic shock is greater than 0.290 and lesser than 0.298, only the low cost irm will beneit from increasing production. Only when the shock reaches 0.298, the intermediate cost irm exercise its option to increase production.
As for the high cost irm, it will only invest when the shock reaches 0.348. Figure 1 illustrates the triggers wherein the Leader firm with a low cost, incapable of waiting for the point at which it would maximize its value, shall invest during its preemption point referent to the monopolistic trigger . As for the First Follower irm of intermediate cost, since it cannot wait to invest at the point in which it would maximize its value either, it shall invest during its preemption time point referent to the monopolistic trigger point . Finally, due to lack of preemption threat, the Second Follower irm of high cost shall invest at its monopolistic time point .
��� ൌ ����Ǣ���� ൌ ͲǤ͵ʹͲǢ ͲǤʹͻͲ ൌ ͲǤʹͻͲǤ
�
�
�
Time Present
Value (t=0)
FIguRe 1 – Preemption and monopolistic triggers of irms
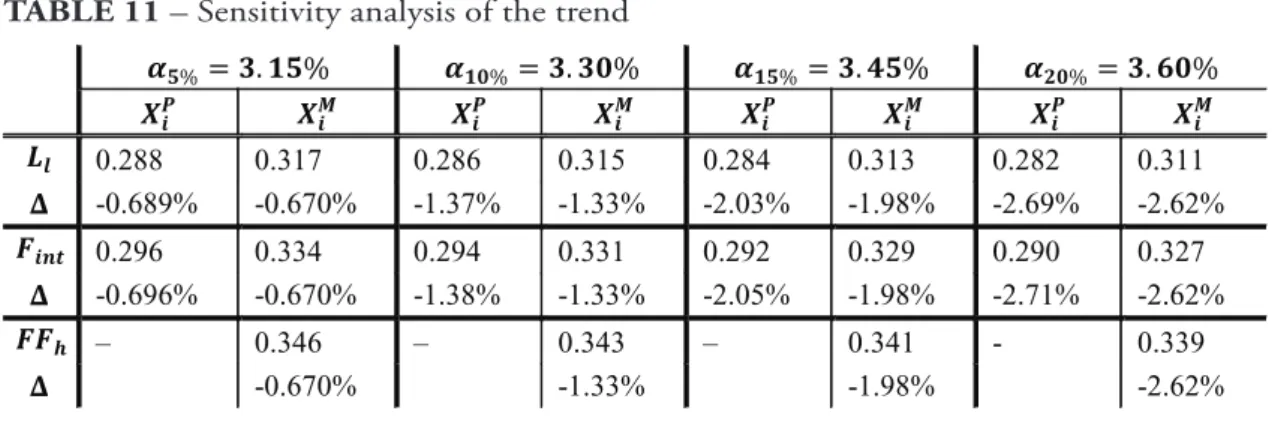
5.1 Sensitivity analysis
Sensitivity analysis is used to study the behavior of the results of a study the extent to which the model assumptions vary. his analysis makes it possible to evaluate the degree of conidence in the results when there is uncertainty in the assumptions of the data and results. A comparison of the variation in monopolistic triggers and preemption of the three firms regarding the variables estimated in this section. he triggers are used as reference:
tABLe 9 – he Triggers
��� ���
�� 0.290 0.320
���� 0.298 0.336
��� – 0.348
Investment strategies in the Brazilian industry of aluminum cans: an analysis in the context of real options games
monopoly triggers and preemption of low-cost, intermediate cost and high cost irms, for the
risk-free rate, to the tendency for volatility, and the demand function, respectively.
tABLe 10 – Sensitivity analysis of risk-free rate
��%=�.��% ���%=�.��% ���%=�.��% ���%=�.��%
��� ��� ��� ��� ��� ��� ��� ���
�� 0.302 0.332 0.313 0.345 0.325 0.357 0.336 0.370
� 3.99% 3.97% 7.96% 7.92% 11.9% 11.8% 15.9% 15.8%
���� 0.310 0.349 0.322 0.362 0.334 0.376 0.345 0.389
� 4.00% 3.97% 7.98% 7.92% 11.9% 11.8% 15.9% 15.8%
��� – 0.362 – 0.375 – 0.389 - 0.403
� 3.97% 7.92% 11.8% 15.8%
An increase of 20% in the risk-free rate causes the trigger to be changed, positively, around 16%. An increase in the risk-free rate will
be postponing the optimal timing of business investment, i.e. investments will be justiied only in a more lucrative market than previously.
tABLe 11 – Sensitivity analysis of the trend
��%=�.��% ���%=�.��% ���%=�.��% ���%=�.��%
��� ��� ��� ��� ��� ��� ��� ���
�� 0.288 0.317 0.286 0.315 0.284 0.313 0.282 0.311
� -0.689% -0.670% -1.37% -1.33% -2.03% -1.98% -2.69% -2.62%
���� 0.296 0.334 0.294 0.331 0.292 0.329 0.290 0.327
� -0.696% -0.670% -1.38% -1.33% -2.05% -1.98% -2.71% -2.62%
��� – 0.346 – 0.343 – 0.341 - 0.339
� -0.670% -1.33% -1.98% -2.62%
An increase of 20% in the trend of geometric brownian motion causes the trigger to be changed negatively around 2.6%. he higher
the trend of GBM, faster the market will grow and become more proitable. he result is poorly sensitive to this variable.
tABLe 12 – Sensitivity Analysis of Volatility
��%=��.��% ���%=��.��% ���%=��.��% ���%=��.��%
��� ��� ��� ��� ��� ��� ��� ���
�� 0.297 0.327 0.304 0.335 0.311 0.343 0.318 0.351
� 2.33% 2.36% 4.70% 4.77% 7.13% 7.23% 9.61% 9.73%
���� 0.305 0.344 0.312 0.352 0.319 0.360 0.326 0.368
� 2.31% 2.36% 4.68% 4.77% 7.09% 7.23% 9.56% 9.73%
��� – 0.356 – 0.364 – 0.373 - 0.382
An increase of 20% in the volatility means positive changes in the trigger, around 10%. he volatility negatively impacts the value of the variable β1. On the other hand, a negative
variation in β1 value increases the value of the trigger. hus, the volatility impacts the trigger value in the same direction.
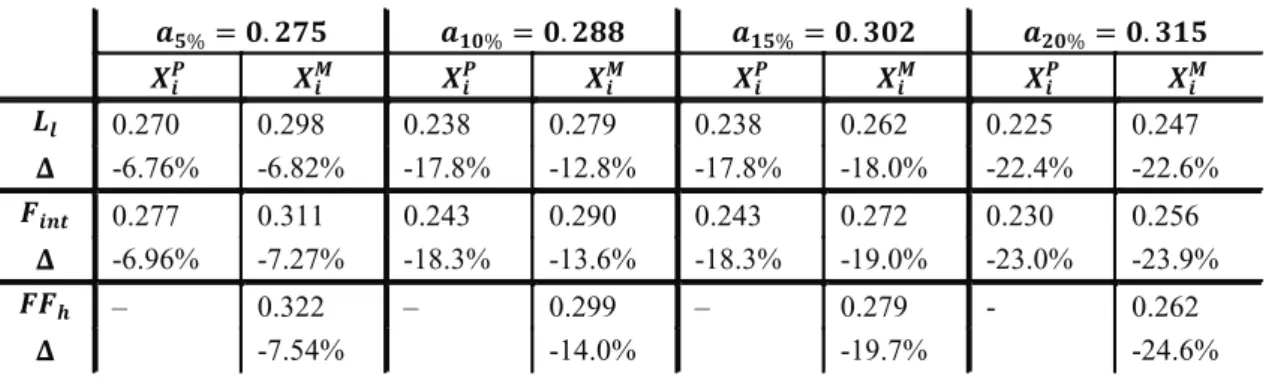
tABLe 13 – Sensitivity Analysis of the Demand Function
��%=�.��� ���%=�.��� ���%=�.��� ���%=�.���
��� ��� ��� ��� ��� ��� ��� ���
�� 0.270 0.298 0.238 0.279 0.238 0.262 0.225 0.247
� -6.76% -6.82% -17.8% -12.8% -17.8% -18.0% -22.4% -22.6%
���� 0.277 0.311 0.243 0.290 0.243 0.272 0.230 0.256
� -6.96% -7.27% -18.3% -13.6% -18.3% -19.0% -23.0% -23.9%
��� – 0.322 – 0.299 – 0.279 - 0.262
� -7.54% -14.0% -19.7% -24.6%
An increase of 20% in variable of demand function means negative changes in the trigger, around 22.6%. he proit is positively afected by the higher price. In this scenario, irms will invest in an early date, and therefore the trigger is negatively impact. his is the more sensitive variable of the model.
6 COnCLuSIOnS
This study examined how the threat of preemption in a context of oligopolistic competition may interfere with the optimal decision point for investment. he model was applied to the aluminum can industry, wherein there are three main active irms. It was possible to compare the impact of preemption in the irms’ trigger.
he accomplishment of this study helps to emphasize the importance, in a dynamic model of obtaining a competitive advantage in costs. As for the static case, the irm with the lowest cost is able to absorb a greater market proit, as it possesses a superior margin. In the dynamic case, monopolistic proits are possibly obtained, or advantages from an isolated expansion may be enjoyed during a greater time period. In case of a very large competitive advantage, the rival’s
threat of preemption may be considered irrelevant and the irm shall invest in the monopolistic period ignoring the possibility of a rival entering the market. When the cost advantage is not large enough for the firms to invest at their monopolistic trigger point, the irm needs to enter a preemption point earlier , due to strategic interaction and market rivalry.
When applying the model, we assumed an investment equal to US$ 100 million for the three irms in the market. he irms’ production was modeled through the Cournot equilibrium. he marginal production cost was estimated by information published by the irms in the market. he result was a relatively similar output for each one of the three irms in the Brazilian sector.
Investment strategies in the Brazilian industry of aluminum cans: an analysis in the context of real options games ReFeRenCeS
Abralatas - Associação brasileira dos fabricantes de latas de alta reciclabilidade. Retrieved July 5, 2013 from http://www.abralatas.org.br/.
Angelou, G.N., Economides, A.E. (2009). A multi-criteria game theory and real-options model for irreversible ICT investment decisions. Telecommunications Policy, 33 (10-11), 686–705. doi:10.1016/j.telpol.2009.07.005
Ball Corporation. (2012). Annual Report. Retrieved April 23, 2013 from http://phx. corporateir.net/External.File?item=UGFyZW50 SUQ9MTc1NTY2fENoaWxkSUQ9LTF8VHl wZT0z&t=1
Chevalier-Roignant, B, Trigeorgis, L. (2011). Competitive strategy: Options and games. Cambridge, Mass: MIT Press.
Costa, F.A, Samanez, C.P. (2008). Teoria dos jogos e opções reais: uma aplicação no mercado imobiliário brasileiro. Revista Brasileira de Economia de Empresas, 8 (2), 565–1581.
Crown holdings Inc. (2012). Annual Report. Retrieved April 23, 2013 from http://phx. corporateir.net/External.File?item=UGFyZW50 SUQ9MTc1ODg5fENoaWxkSUQ9LTF8VHl wZT0z&t=1
Dias, M.A.G, Teixeira, J.P. (201). Continuos-time option games: Review of models and extensions. Multinacional Finance Journal, 14 (3-4), 219-254.
Dias, M.A.G. (2015). Análise de investimentos com opções reais. Teoria e prática com aplicações em petróleo e em outros setores - Volume 2: Processos estocásticos e opções reais em tempo contínuo. Rio de Janeiro: Editora Interciência.
Dixit, A.K., Pindyck, R.S. (1994). Investment under uncertainty. New Jersey: Princeton University Press.
Fudenberg, D., Tirole, J. (1985). Preemption and rent equalization in the adoption of new technology. Review of Economic Studies, 52, 383–401. doi: 10.2307/2297660.
Grenadier, S.R. (2002). Options exercise games: An application to the equilibrium investment strategies of irms. Review of Financial Studies, 15 (3), 691-721. doi: 10.1093/rfs/15.3.691
Huisman, K.J.M. (2001). Technology investment: A game theoretic real options approach. Boston: Kluwer Academic Publishing.
Huisman, K. J. M., & Kort, P. M. (1999). Efects of strategic interactions on the option value of waiting [CentER Working Paper Series nº
1999-92]. Tilburg University, CentER, Tilburg,
Netherlands.
Huisman, K.J.M., Kort, P.M., Pawlina, G., hijssen, J.J. (2005). Strategic investment under uncertainty: A survey of game theoretic real options models. he Capco Institute Journal of Financial Transformation, 13, 112-118.
Rexam PLC. (2012). Annual Report. Retrieved April 23, 2013 from https://www.rexam.com/ iles/reports/2012ar/iles/2012_annual_report.pdf.
Samanez, C.P., Ferreira, L.R., Nascimento, C.C., Costa, L.A., Bisso, C.R. (2014). Evaluating the economy embedded in the brazilian ethanol– gasoline lex-fuel car: A real options approach. Applied Economics, 46 (14), 1565–1581. doi: 10.1080/00036846.2013.877573
Smit, H.T.J; Ankum, L.A. (1993). A real options and game-theoretic approach to corporate investment strategy under competition. Financial Management, 22 (3), 241-250.
Smit, H.T. J., Trigeorgis, L. (2004). Strategic investment: Real options and games. New Jersey: Princeton University Press.
Smit, H.T.J., Trigeorgis, L. (2009). Valuing infrastructure investment: An option games approach. California Management Review, 51 (2), 79-100.