Vânia Daniela Oliveira
Antunes de Almeida
Antecedents of loyalty to a brand – Apple clients vs.
non-clients
Antecedentes da lealdade à marca – clientes vs.
não-clientes da Apple
Vânia Daniela Oliveira
Antunes de Almeida
Antecedents of loyalty to a brand – Apple clients vs.
non-clients
Antecedentes da lealdade à marca – clientes vs.
não-clientes da Apple
Dissertação apresentada à Universidade de Aveiro para cumprimento dos requisitos necessários à obtenção do grau de Mestre em Gestão, realizada sob a orientação científica do Mestre Victor Manuel Ferreira Moutinho, Assistente no Departamento de Economia, Gestão e Engenharia Industrial da Universidade de Aveiro, e do Doutor António Carrizo Moreira, Professor Auxiliar do Departamento de Economia, Gestão e Engenharia Industrial da Universidade de Aveiro.
Mãe, Pai,
Dedico-vos este trabalho como uma forma de apreço por todos os sacrifícios que fizeram por mim, pelo exemplo de luta e dedicação que me dão todos os dias e, acima de tudo, pelo apoio e amor incondicional que sempre me deram.
o júri
presidente Prof. Doutor Daniel Ferreira Polónia Professor Auxiliar Convidado, Universidade de Aveiro
Prof. Doutor Nuno Miguel Fortes Fonseca Santos Professor Adjunto, Instituto Politécnico de Coimbra
Prof. Doutor António Carrizo Moreira Professor Auxiliar, Universidade de Aveiro
agradecimentos Aos professores Victor Manuel Ferreira Moutinho e António Carrizo Moreira pela disponibilidade, orientação e estímulo permanente.
Às Universidades portuguesas que contactei e que gentilmente encaminharam o questionário aos seus alunos e restantes membros da comunidade
académica.
Aos meus amigos e colegas de curso, especialmente a ti Patrícia, que sempre me apoiaram e com os quais fui superando os obstáculos desta etapa. Irei sempre lembrar com nostalgia os nossos “melhores anos” juntos!
E especialmente a ti André, por me guiares dentro do “mundo Apple”, por
acreditares e me fazeres acreditar em mim própria, por me encorajares nos momentos em que me senti mais desanimada, por me tornares uma pessoa melhor… Sem ti, nada teria o mesmo valor!
palavras-chave Experiência da marca, valor percebido, percepções de preço, confiança, satisfação, comprometimento, lealdade, Apple.
resumo A Apple é indubitavelmente uma marca sui generis e notável no que respeita ao branding e experiência da marca, sendo uma referência incontornável na indústria de produtos electrónicos e de computadores.
Os objectivos deste estudo passam por desenvolver e testar empiricamente dois modelos conceptuais que avaliem e permitam comparar as percepções dos não-clientes e clientes da Apple, relativamente à experiência
proporcionada pela marca, ao valor percebido da marca, às percepções de preço e confiança na marca; e que determinem os antecedentes da lealdade dos clientes à marca.
Assim, este estudo contribui para a criação de conhecimento relativamente ao impacto da experiência da marca na percepção de valor do consumidor e nas suas percepções de preço, bem como no que diz respeito à influência das percepções de preço (positivas e negativas) na confiança, satisfação e comprometimento com a marca.
Usaram-se dois questionários para testar cada um dos modelos conceptuais, através de uma amostra composta pela comunidade académica portuguesa. Os resultados obtidos comprovam a forte influência dos aspectos sensoriais e afectivos proporcionados pela experiência da marca, tanto no caso dos clientes como dos não-clientes. Realçam também que o papel negativo do preço é neutralizado quando há uma forte experiência da marca, e que o facto de a Apple ser considerada uma “marca cara” pode fomentar a sua associação
a maior qualidade e alcance de prestígio. Por fim, este estudo reforçou a importância da satisfação e comprometimento com a marca para a criação de lealdade, corroborando a literatura existente. São ainda discutidas as
keywords Brand experience, brand perceived value, price perceptions, brand trust, brand satisfaction, brand commitment, brand loyalty, Apple.
abstract Apple is undoubtedly a sui generis and remarkable brand in what concerns to its branding and brand experience, and remains an indisputable reference in the consumer electronics and computer industries.
The aim of this study encompasses the development and empirical testing of two conceptual models that evaluate and allow to draw a comparison between
Apple clients and non-clients’ perceptions, regarding brand experience, brand
perceived value, price perceptions and brand trust; and that determine the antecedents of clients’ loyalty to the brand.
Therefore, the contribution of this study to the literature relies on the research of the impact of brand experience on brand perceived value and on price perceptions, as well as the influence of price perceptions (positive and negative) on trust, satisfaction, and commitment to the brand.
Two surveys were used to test each conceptual model, through a sample collected across the portuguese academic community. The findings prove the strong influence of the sensory and affective aspects of brand experience on both clients and non-clients. They also reveal that the negative role of price is neutralized in the presence of strong brand experience, and that the fact that
Apple is viewed as an “expensive brand” may highlight its association to higher
quality and prestige. Also, this study reinforces the important role of satisfaction and commitment in building customer loyalty, corroborating the existent
T
T
AABBLLEEOOFFCCOONNTTEENNTTSSC
CHHAAPPTTEERRII––IINNTTRROODDUUCCTTIIOONN........................................................................................................................................................................................................................11
1.1 Introduction... 1
1.2 Objectives and structure of the study ... 2
1.3 Methodology ... 4
C CHHAAPPTTEERRIIII––CCOONNTTEEXXTTUUAALLIIZZAATTIIOONNOOFFTTHHEEBBRRAANNDD................................................................................................................................................................55 2.1 Review of Apple’s evolution ... 5
2.1.1 The genesis ... 5
2.1.2 From Apple I to Macintosh ... 6
2.1.3 A new era – Sculley, Spindler, and Amelio ... 7
2.1.4 A decade of reinventing the industry ... 8
2.1.5 The present days ... 10
2.2 Apple’s position in the market ... 12
2.2.1 Apple’s evolution in the stock market ... 13
2.2.2 Apple named most valuable brand in the world ... 15
2.2.3 The competitors ... 17 C CHHAAPPTTEERRIIIIII––LLIITTEERRAATTUURREERREEVVIIEEWW..................................................................................................................................................................................................2211 3.1 Brands ... 21 3.2 Consumer-brand relationship ... 22 3.3 Brand experience ... 25
3.3.1 Brand experience – brand perceived value ... 29
3.3.2 Brand experience – price perceptions ... 29
3.4 Brand perceived value ... 31
3.4.1 Brand perceived value – brand trust ... 34
3.4.2 Brand perceived value – brand satisfaction ... 35
3.5 Price perceptions ... 36
3.5.1 Value consciousness ... 38
3.5.2 Price sensitivity ... 39
3.5.3 Price as quality indicator ... 41
3.5.4 Prestige sensitivity ... 43
3.6 Brand trust... 44
3.6.1 Brand trust – brand commitment ... 46
3.6.2 Brand trust – brand loyalty ... 47
3.7 Brand satisfaction ... 48
3.7.1 Brand satisfaction – brand commitment ... 49
3.7.2 Brand satisfaction – brand loyalty ... 50
3.8 Brand commitment ... 51
3.8.1 Brand commitment – brand loyalty ... 53
3.9 Brand loyalty ... 54
C CHHAAPPTTEERRIIVV––CCOONNCCEEPPTTUUAALLMMOODDEELL................................................................................................................................................................................................5599 4.1 Conceptual model and hypotheses ... 59
4.2 Measures and survey ... 62
C CHHAAPPTTEERRVV––DDAATTAAAANNDDRREESSUULLTTSS......................................................................................................................................................................................................6677 5.1 Sample ... 67
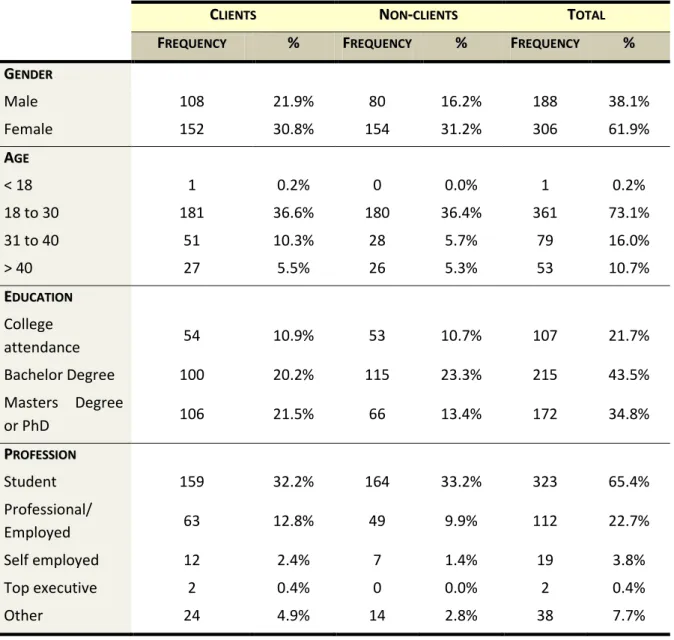
5.1.1 Demographics... 67
5.1.2 Analysis of the non-clients’ reasons for not buying Apple products ... 68
5.1.3 Analysis of the product categories possessed by the clients ... 69
5.2 Methodology ... 70
5.3 Results ... 72
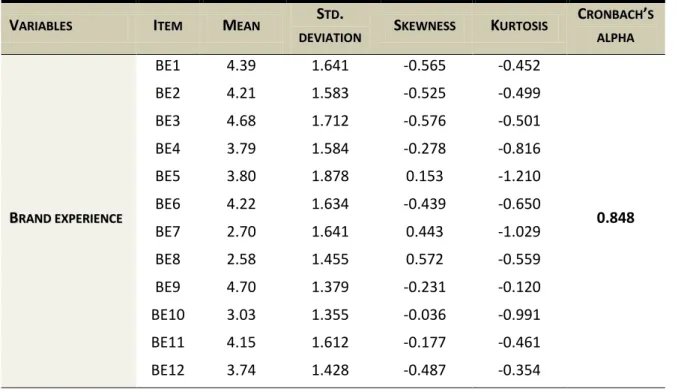
5.3.1 Scales’ reliability and consistency: non-clients’ model ... 72
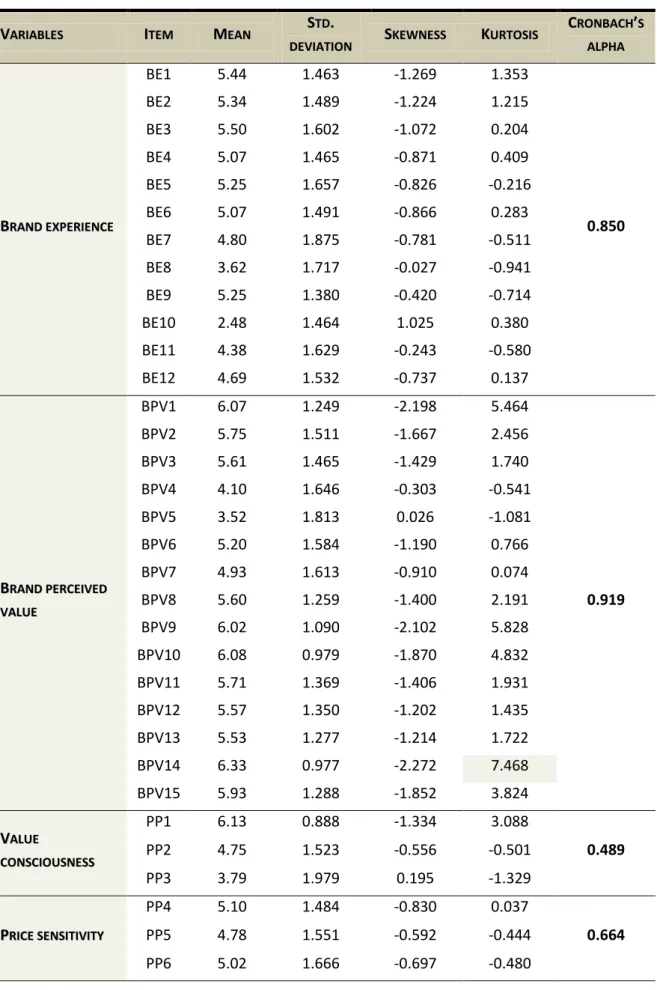
5.3.2 Scales’ reliability and consistency: clients’ model ... 74
5.3.3 Exploratory factor analysis for the non-clients’ model ... 77
5.3.5 Multi-collinearity analysis ... 94
5.3.6 Tests of hypotheses – partial effects model ... 97
Tests of hypotheses regarding the non-clients’ model ... 97
Tests of hypotheses regarding the clients’ model ... 103
5.3.7 Tests of loyalty level differences among product categories ... 115
C CHHAAPPTTEERRVVII––CCOONNCCLLUUSSIIOONNSS..............................................................................................................................................................................................................111177 6.1 Discussion and implications ... 117
6.1.1 Discussion and comparison of the relationships among variables common to the two models: Apple clients and non-clients ... 118
6.1.2 Discussion of the results related to the Apple clients’ model: relationships comprising brand satisfaction, brand commitment, and brand loyalty variables ... 125
6.2 Final remarks ... 131
6.3 Limitations and future research ... 134
R REEFFEERREENNCCEESS........................................................................................................................................................................................................................................................113377 A ANNNNEEXXEESS................................................................................................................................................................................................................................................................114499 Appendix A ... 149 Appendix B ... 159
Anova output regarding brand loyalty among product categories... 159
L
L
IISSTTOOFFFFIIGGUURREESSFigure 1 – Apple’s sales numbers, presented on the Worldwide Developers Conference, in June
2013. ... 16
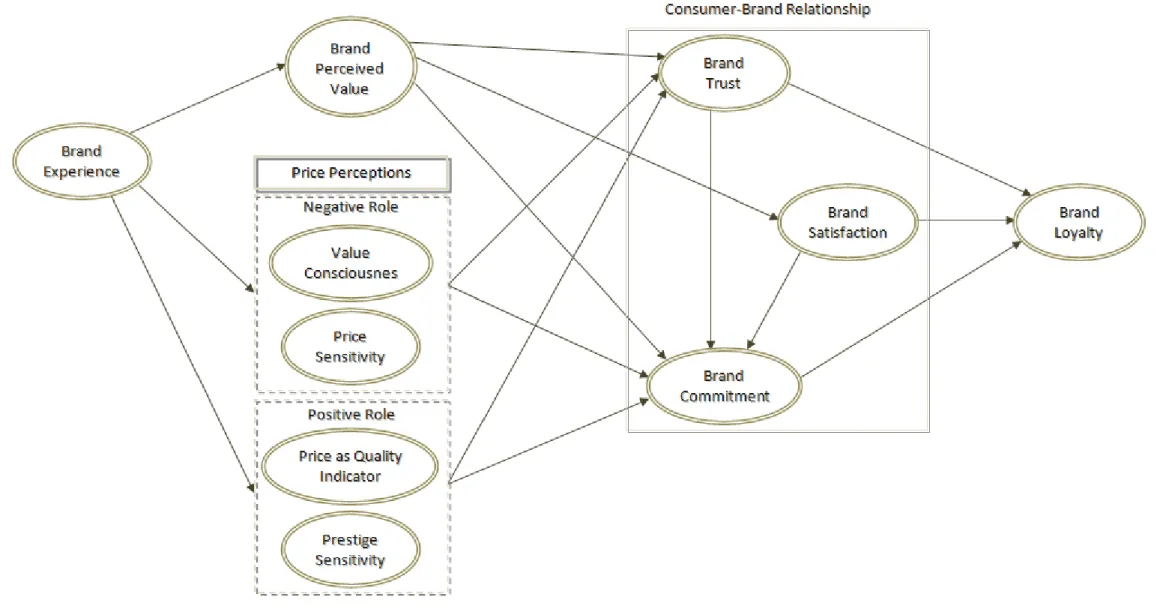
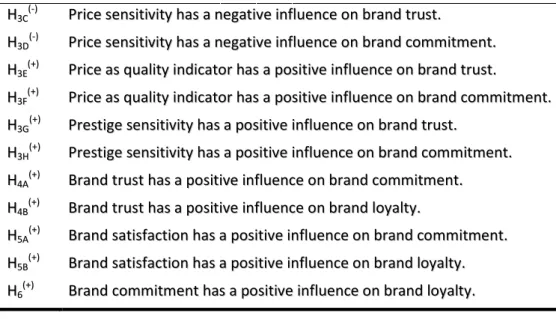
Figure 2 – Proposed conceptual model... 26
Figure 3 – Partial conceptual model relative to the non-clients respondents’ analysis. ... 60
Figure 4 – Complete conceptual model relative to the clients respondents’ analysis. ... 61
Figure 5 – Relationships coefficients for the non-clients’ model. ... 113
Figure 6 – Relationships coefficients for the clients’ model. ... 114
L
L
IISSTTOOFFCCHHAARRTTSS Chart 1 – Apple’s stock price evolution from 1985 to 2010. ... 13Chart 2 – Apple’s stock price evolution from January 2012 to January 2013. ... 14
Chart 3 – Comparison between Apple and the rest of technology sector, regarding brand value. 17 Chart 4 – Brand value comparison for the technology sector. ... 18
Chart 5 – Brand value comparison between Apple and (1) Google, (2) Samsung, (3) Microsoft. ... 19
Chart 6 – Non-clients’ reasons for not buying Apple products. ... 69
Chart 7 – Distribution of clients among Apple product categories. ... 70
L
L
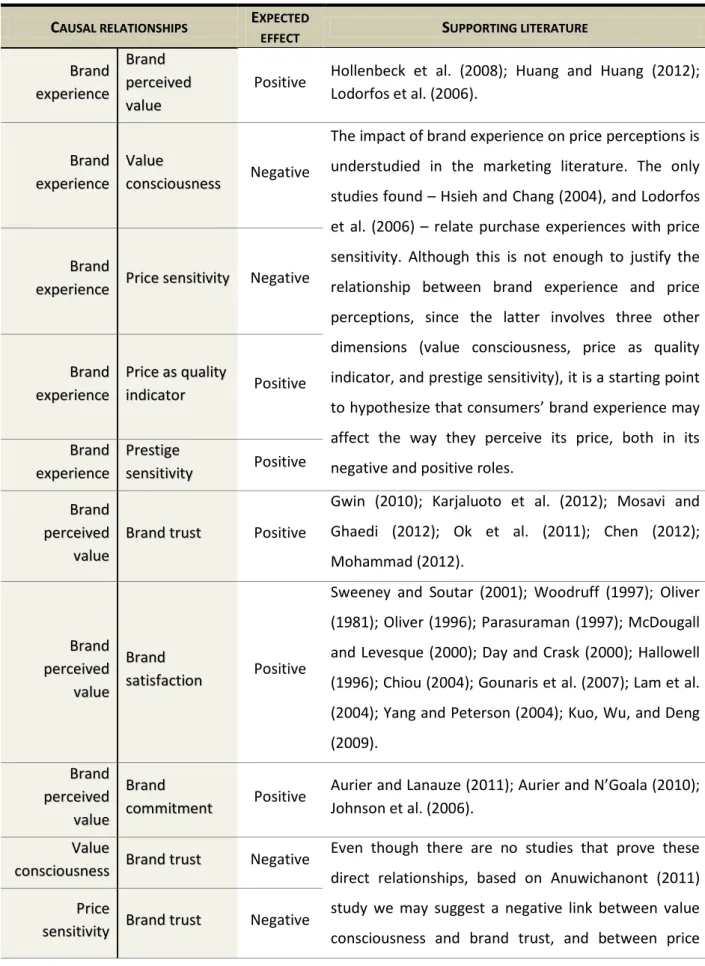
IISSTTOOFFTTAABBLLEESSTable 1 – Overview of supporting literature for the proposed causal relationships between
constructs. ... 56
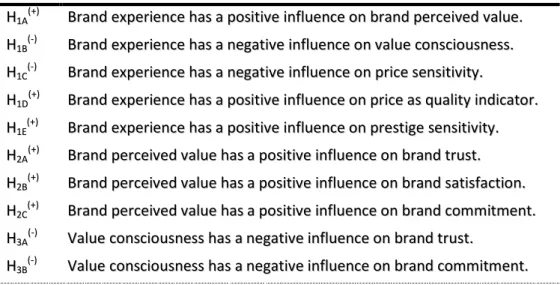
Table 2 – Overview of the proposed hypotheses and expected causal relationships between constructs. ... 59
Table 3 – Items used to measure each construct. ... 63
Table 4 – Sample demographic results. ... 68
Table 5 – Cronbach’s alpha reference values... 71
Table 6 – Kaiser-Meyer-Olkin (KMO) reference values. ... 71
Table 7 – Scales’ reliability analysis results for the non-clients’ model. ... 72
Table 8 – Scales’ reliability analysis results for the clients’ model. ... 75
Table 9 – Brand experience exploratory factor analysis for the non-clients’ model. ... 78
Table 10 – Brand perceived value exploratory factor analysis for the non-clients’ model. ... 80
Table 11 – Value consciousness exploratory factor analysis for the non-clients’ model. ... 81
Table 12 – Price sensitivity exploratory factor analysis for the non-clients’ model. ... 82
Table 13 – Price as quality indicator exploratory factor analysis for the non-clients’ model. ... 83
Table 14 – Prestige sensitivity exploratory factor analysis for the non-clients’ model. ... 83
Table 15 – Brand trust exploratory factor analysis for the non-clients’ model. ... 84
Table 16 – Brand experience exploratory factor analysis for the client’s model. ... 86
Table 17 – Brand perceived value exploratory factor analysis for the clients’ model. ... 87
Table 18 – Value consciousness exploratory factor analysis for the clients’ model. ... 88
Table 19 – Price sensitivity exploratory factor analysis for the client’s model. ... 89
Table 20 – Price as quality indicator exploratory factor analysis for the clients’ model. ... 90
Table 21 – Prestige sensitivity exploratory factor analysis for the clients’ model. ... 90
Table 22 – Brand trust exploratory factor analysis for the clients’ model. ... 91
Table 23 – Brand satisfaction exploratory factor analysis. ... 92
Table 24 – Brand commitment exploratory factor analysis. ... 92
Table 26 – Multi-collinearity analysis for the non-clients’ model. ... 95
Table 27 – Multi-collinearity analysis for the clients’ model. ... 96
Table 28 – Regression analysis of brand perceived value antecedents for the non-clients’ model. 98 Table 29 – Regression analysis of value consciousness antecedents for the non-clients’ model. .. 99
Table 30 – Regression analysis of price sensitivity antecedents for the non-clients’ model. ... 100
Table 31 – Regression analysis of price as quality indicator antecedents for the non-clients’ model. ... 100
Table 32 – Regression analysis of prestige sensitivity antecedents for the non-clients’ model. ... 101
Table 33 – Regression analysis of brand trust antecedents for the non-clients’ model. ... 102
Table 34 – Regression analysis of brand perceived value antecedents for the clients’ model. .... 103
Table 35 – Regression analysis of value consciousness antecedents for the client’s model. ... 104
Table 36 – Regression analysis of price sensitivity antecedents for the client’s model. ... 105
Table 37 – Regression analysis of price as quality indicator antecedents for the client’s model. . 106
Table 38 – Regression analysis of prestige sensitivity antecedents for the client’s model. ... 106
Table 39 – Regression analysis of brand trust antecedents for the clients’ model. ... 107
Table 40 – Regression analysis of brand satisfaction antecedents for the clients’ model. ... 108
Table 41 – Regression analysis of brand commitment antecedents for the clients’ model. ... 109
Table 42 – Regression analysis of brand loyalty antecedents for the clients’ model. ... 110
C
C
H
H
A
A
P
P
T
T
E
E
R
R
I
I
–
–
I
I
N
N
T
T
R
R
O
O
D
D
U
U
C
C
T
T
I
I
O
O
N
N
11
1
.
.
1
1
I
I
NNTTRROODDUUCCTTIIOONN “ “AApppplleeiissaapprriimmeeeexxaammpplleeoofftthheerreewwaarrddsstthhaattccoommeewwhheennyyoouuggeetttthheeeeqquuaattiioonnrriigghhtt:: p prroodduuccttsstthhaattppeeoopplleettrruullyywwaannttaannddggrreeaattbbrraannddiinngg,,wwhhiicchhiisstthheeddoooorrooppeenneerr f foorrwwaakkiinnggppeeoopplleeuuppttootthheepprroodduuccttss..”” (Elliot, 2012, p. 245)The idea that consumers and brands can relate to each other is referred to as ‘consumer-brand relationship’ (Fournier, 1998; Smit, Bronner, & Tolboom, 2007). While for a long time advertisers invested more money in acquiring new customers than in reinforcing relationships with the existing ones, nowadays strengthening relationships with consumers is the focus of marketing activities, since these consumer-brand relationships bring advantages to the companies such as reduced marketing costs, ease of access, acquiring new customers, customer retention, brand equity and more profit (Smit et al., 2007). On the other hand, for consumers, these relationships provide not only functional aids for living, but also the opportunity to enjoy meaning bestowed on various aspects of their lives (Sung & Choi, 2010).
Consumer-brand relationships are usually conceptualized as long-term, committed and affect-laden partnerships, and may include several constructs, such as brand trust, brand satisfaction, and brand commitment (Aurier & Lanauze, 2011; Morgan & Hunt, 1994; Sahin, Zehir, & Kitapçı, 2012; Smit et al., 2007; Sung & Choi, 2010). These will ultimately lead to brand loyalty, and therefore investing in consumer-brand relationships has become the main focus for many companies that seek to build lasting and profitable ties with customers (Pang, Keh, & Peng, 2009). Besides the impact of consumer-brand relationships on brand loyalty, literature has suggested that previous information or experience is held as a reason for repeat purchase, in the sense that a personal experience with a product influences consumers’ behavior (Lodorfos, Mulvana, &
consumers search for brands that recognize their need for new and exciting experiences, and provide them with experiential aspects more than functional ones, creating unique and memorable experiences, through sensory, affective and other experiential appeals (Sahin, Zehir, & Kitapçı, 2011; Walter, Cleff, & Chu, 2013; Zarantonello & Schmitt, 2010).
Apple is considered the ultimate example of a brand concerned about the user experience. The Apple brand experience occurs in different manners, from the product experience, to the look and feel of the products, all the way to the customer service.
Apple stores are the gold standard in customer service, through simple innovations that create deeper, more emotional connections with the customers (Elliot, 2012). From the Genius Bar (Apple store's in-house tech-support system) to the feel of the products, the purchasing experience and the employees treatment in stores, ‘everything Apple’ has an inherent ease of use and brings delight to the customer (DeBord, 2012; Elliot, 2012).
According to Jack Morton’s study, Apple was elected as the number one brand that offers unique experiences. The study also unveiled that 44% of the respondents are willing to pay a premium price for a product, if they know it will provide a unique experience with the brand, and that over 60% of the respondents believe the overall and distinctive experience with a brand is the biggest trigger of the purchasing decision (Jack Morton, 2011).
The success of a brand is largely related to the experiences they built in people’s hearts and minds – the brand is the sum of all the sensations people feel when interacting with it. The fact that Apple was named the most valuable brand in the world is related not only to its stock price or intellectual property, but especially with its intangible assets – these are what put Apple in an overwhelmingly powerful position compared to its competitors and the reason why many believe the Apple brand experience has no peers (catalysto).
1
1
.
.
2
2
O
O
BBJJEECCTTIIVVEESSAANNDDSSTTRRUUCCTTUURREEOOFFTTHHEESSTTUUDDYYThe effects of brand experience and consumer-brand relationship on brand loyalty have been largely studied and proved in the literature (Aurier & N’Goala, 2010; Brakus, Schmitt, & Zarantonello, 2009; Choi, Ok, & Seon, 2011; Mohammad, 2012; Morgan & Hunt, 1994; Sahin et al., 2011, 2012; Yang & Peterson, 2004). The impact of brand perceived value on the consumer-brand relationship constructs – consumer-brand trust, consumer-brand satisfaction, and consumer-brand commitment – has also
been addressed (Aurier & Lanauze, 2011; Aurier & N’Goala, 2010; Gounaris, Tzempelikos, & Chatzipanagiotou, 2007; Johnson, Herrmann, & Huber, 2006; Mosavi & Ghaedi, 2012; Ok, Choi, & Hyun, 2011; Oliver, 1996; Parasuraman, 1997; Sweeney & Soutar, 2001; Yang & Peterson, 2004). The purpose of this study is therefore to fulfill the gap in the literature related to the effect of brand experience on brand perceived value and on price perceptions, as well as the impact of price perceptions on consumer-brand relationships. Also, we intend to disclose the differences between the perceptions of Apple clients and non-clients toward the brand, reason why we developed and tested two separate models for each case. Through this study, we aim to achieve three main objectives:
i. Develop and empirically test two models – one referring to the Apple non-clients’ case that evaluates their brand experience, brand perceived value, price perceptions, and brand trust – and another more complete model for the Apple clients’ case – which evaluates all the previous constructs, as well as brand satisfaction, brand commitment, and brand loyalty.
ii. Unveil the differences between Apple clients and non-clients regarding brand experience, brand perceived value, price perceptions, and brand trust toward the brand in question – and in that way draw conclusions about the importance of the experience with the brand in order to structure a certain perception about it.
iii. Examine the antecedents of brand loyalty for the Apple clients’ case, emphasizing the understudied relationships between brand experience and brand perceived value and price perceptions, as well as the proposed new relationships between price perceptions and consumer-brand relationships.
This study is developed in six chapters. The present chapter regards the introduction, where we briefly present the issue of the study, the objectives we aim to achieve, and the structure and methodology used. In Chapter II – Contextualization of the brand, we focus on the history of Apple, as well as its position on the market: the evolution on the stock market, the most valuable brand achievement, and the competition. The next chapter concerns to the literature review of all the constructs that compose the proposed conceptual models, emphasizing the causal relationships between those constructs that ultimately lead to brand loyalty. The hypothesis and proposed conceptual models are presented in Chapter IV. In Chapter V the methodology used and results obtained are described. Finally in Chapter VI takes place a discussion regarding the findings
and conclusions of the study, from the theoretical and managerial point of view, as well as the limitations and future research.
1
1
.
.
3
3
M
M
EETTHHOODDOOLLOOGGYYTwo types of investigation were held in order to complete the present study – exploratory research and descriptive research.
With the first, we intended to perform a review regarding the relevant studies in the literature related to the constructs adopted for the proposed conceptual models. The exploratory research allowed the development of variables used in this study, and also to present literary support for the relationships proposed between those variables.
The descriptive research fulfills the aim of describing and characterizing the perceptions of the Portuguese academic community (including students, professors, and researchers) toward a specific brand – Apple. It also has the goal of highlighting the differences between the perceptions of those who are actual clients of the brand, and those who know and have an opinion about the brand, but do not buy its products. The required data was obtained through a survey, and was collected online and through personal contact with the respondents. According to the two different conceptual models proposed, two different surveys were applied, one for the Apple clients and the other for the non-clients. The data was then analyzed separately for each model, resorting to statistic analysis – descriptive statistic, multi-collinearity analysis, exploratory factor analysis, linear regression, and an ANOVA test of loyalty level differences among product categories for the Apple clients.
C
C
H
H
A
A
P
P
T
T
E
E
R
R
I
I
I
I
–
–
C
C
O
O
N
N
T
T
E
E
X
X
T
T
U
U
A
A
L
L
I
I
Z
Z
A
A
T
T
I
I
O
O
N
N
O
O
F
F
T
T
H
H
E
E
B
B
R
R
A
A
N
N
D
D
2
2
2
.
.
1
1
R
R
EEVVIIEEWWOOFFA
A
PPPPLLEE’
’
SSEEVVOOLLUUTTIIOONNAs most companies, Apple started small and struggled to succeed. The company was founded in 1976, as the dream of two young men – Steve Jobs and Steve Wozniak – who were fascinated by computers and wanted to build their own. However, the creation of the personal computer, available to everyone and not just to companies or Universities that could afford the huge and expensive models of the time, was far from smooth. Apple as the success we know today took years of trials and errors (Lüsted, 2012).
2
2
.
.
1
1
.
.
1
1
T
T
HEHE GGEENNEESSISISSteven Paul Jobs was born in San Francisco, California, in 1955. Adopted by Paul and Clara Jobs in his early weeks of life, Steve was a very curious child. Throughout his teen years he was described as a loner, who preferred wonder around his neighborhood visiting some of his adult neighbors working in new technological advances (Lüsted, 2012).
In 1971, Steve Jobs met Steve Wozniak through a mutual friend. One year later, Jobs graduated and went to College, but after one semester he dropped out. However, instead of coming back home, he hang out on campus, living in empty dorms and meditating about the path he wanted to follow in his life. In 1974, Jobs moved back home with his parents and started working at Atari, a video game company (Lüsted, 2012). Meanwhile, Wozniak started working at HP. He was still friend with Jobs, who would sneak him into the Atari’s headquarters after hours so that he could play video games for free. In turn, Wozniak helped Jobs with technical problems he could not handle, such as designing a new video game (Lüsted, 2012).
Apple began in the Santa Clara Valley vicinity of California when it was taking on its new name – Silicon Valley (Linzmayer, 2004; O'grady, 2009). Jobs eventually convinced Wozniak to mass produce and sell his computer design, and the two first began building Apple computers on Jobs’ parents living room and later moved to their garage. Wozniak was the engineer while Jobs was a
natural marketing maven, and the two created a synergy that enabled them to build and promote computers in a way no one had done so far (O'grady, 2009).
2
2
.
.
1
1
.
.
2
2
F
F
RROOMMA
A
PPPPLLEEI
I
TTOOM
M
AACCIINNTTOOSSHHIn 1975, Wozniak began developing an idea of a user-friendly desktop computer that could use a standard typewriter QWERTY keyboard, instead of switchers to enter data. Wozniak’s idea was also to connect the computer to a regular television instead of an expensive printer or monitor (Lüsted, 2012). The path to the creation of Apple was set.
Apple I was the result of that work. Hand-built by Steve Wozniak in Steve Jobs' parents garage and first introduced at the Homebrew Computer Club in Palo Alto, California, in 1976, Apple I was originally a do-it-yourself kit which did not even come with a case. Even so, as the first all-in-one microcomputer that, once hooked up to a keyboard and monitor, did not require extra circuitry to display text, it was a giant step forward over the competition (TIME Lists, 2013).
After Apple I was complete Wozniak immediately started to think of ways to make his designs better – “he wanted to optimize them, use fewer chips and less expensive materials, make them faster, more powerful, and colorful” (O'grady, 2009, p. 5). Apple II was the successor and the first personal computer designed for the mass market (Linzmayer, 2006). Jobs knew he needed to get outside funds in order to make the Apple II a reality and it was then he met Armas Clifford ‘Mike’ Markkula Jr., who co-signed for a bank loan for $250.000. Jobs, Wozniak and ‘Mike’ formed Apple Computer, on April 1, 1976 (O'grady, 2009).
The next Apple computer – Apple III – was designed for business users and challenged the notorious Big Blue from IBM. However, this computer ended up being a commercial failure, largely due to its expensive price compared with the competition. One year after the Apple III launch (in 1980), IBM conveniently showcased its Personal Computer (PC) benefiting from Apple’s recent reputation of poor reliability, and so business users fled for the comfort and familiarity of IBM (Linzmayer, 2006; O'grady, 2009).
Following the Apple III computer fiasco, Apple focused on a new one which would revolutionize computing and popularize terms such as mouse, icon, and desktop – the computer Lisa. But Lisa’s launch ended up being a disappointment, mainly due to its sky-high price of $9.995; however, it was the precursor to a much more successful project – the Macintosh (O'grady, 2009).
Meanwhile, in 1980, Apple went public, debuting on the stock market with a valuation of $1.8 million, making Apple the largest IPO since Ford went public, in 1956 (Linzmayer, 2006).
In order to avoid the repetition of the Apple III flop, Steve Jobs removed himself from the Lisa project and began to focus on a new one – the Macintosh. The underlying concept was to create an easy-to-use, low-cost computer, equipped with everything an end-user could possibly want in a complete package (O'grady, 2009). Jobs introduced the Macintosh at the company's annual shareholders’ meeting on January 24, 1984. At the price of $2.495, Macintosh was the first affordable computer to offer a graphical user interface, replacing the text-based operating systems for an intuitive layout of folders and icons (TIME Lists, 2013). The Mac's famous Super Bowl ad – ‘1984’ – directed byRidley Scott, would become a pop icon in its own right, ever sending a message of Apple as the epitome of non-conformity (Elliot, 2012; TIME Lists, 2013).
2
2
.
.
1
1
.
.
3
3
A
A
NNEEWW EERRAA–
–
S
S
CUCULLLLEEYY,
,
S
S
PIPINNDDLLEERR,
,
AANNDDA
A
MMEELLIIOOJohn Sculley was a former vice-president of PepsiCo, and was recruited by Jobs himself, who convinced him to take the job by asking ‘Do you want to spend the rest of your life selling sugared water, or do you want a chance to change the world?’ (Elliot, 2012). Sculley was named Apple’s CEO on April 8, 1983. His mission was to apply his marketing skills to the personal computer market, since Macintosh’s success was not enough to beat the IBM PC. Sculley’s strategy of releasing dozens of models with hundreds of configurations was contradictory to Apple’s reputation of simplicity, and translated into poor sales. The conflicts between Jobs and Sculley grew stronger and eventually resulted in Steve Jobs’ resignation, in 1985 (O'grady, 2009). After leaving Apple, Jobs founded a new company – NeXT – whose core business was building futuristic computers based on the NEXTSTEP operating system, but these computers did not sell due to the elevated price. Jobs also purchased the computer-graphics division of LucasFilm, in 1986, and renamed it Pixar. The return of Steve Jobs to Apple occurred in 1997, after Apple bought NeXT, in December of 1996, for the extraordinary amount of $429 million (O'grady, 2009).
Meanwhile, in 1992, Microsoft released Windows 3.1, considered good enough, catching-up with Macintosh’s ease of use, which made Apple’s market share percentage drop even faster (Linzmayer, 2006). Sculley was removed and Michael Spindler was selected as Apple’s President and CEO, in 1993 (O'grady, 2009).
In 1994, Spindler surprised everyone by announcing a switch to the new PowerPC chips, from the big rival IBM. Although this was a successful project, Spindler also had some downfalls during his term, including the failure of the Newton and the Copland operating systems (O'grady, 2009). In 1995, Microsoft introduced Windows 95, erasing the differences between Mac’s and Windows’ user interface on the public’s mind (Linzmayer, 2006). Spindler was replaced by Gil Amelio, in February of 1996 (O'grady, 2009).
Amelio, a veteran of National Semiconductor, pointed out some of the reasons for Apple’s continuous failure, namely, “a lack of cash, a lack of quality hardware and software, a lack of focus, and an out-of-control culture” (O'grady, 2009, p. 12). During his term, he laid off one-third of the staff, discontinued the Copland OS and shipped Mac OS 8. It was also during his term that Apple bought Jobs’ NeXT, and the NEXTSTEP operating system would become the foundation for Mac OS X, which turned out a great success (O'grady, 2009).
Apple sales remained low and there was a lack of direction. The company’s stock price hit its lowest point under Amelio’s leadership, mainly due to confusion about the product line. The board decided they needed Jobs back, and he returned to Apple in December 1997, as part of the acquisition of NeXT, and subtly orchestrated the removal of Amelio, assuming the role of interim CEO (Linzmayer, 2006; O'grady, 2009). “He had become a far better leader, less of a go-to-hell aesthete who cared only about making beautiful objects”, wrote Fortune's editor Peter Elkind of Steve Jobs’ triumphant return – “Now he was a go-to-hell aesthete who cared about making beautiful objects that made money” (TIME Lists, 2013).
2
2
.
.
1
1
.
.
4
4
A
A
DDEECCAADDEE OOFF RREEIINNVVENENTITINNGG TTHHEE IINNDDUUSSTTRRYYThe return of Steve Jobs to Apple, in 1997, occurred at the company’s lowest point. Jobs took the reins back raising money and restructuring the company’s product line. The next step was the creation of iMac, the machine that would save Apple (O'grady, 2009). iMac was introduced in 1998, at a $1.299 price, dubbed as ‘the Internet-age computer for the rest of us’, proving that Apple was still a force to be reckoned with (Linzmayer, 2006). The elimination of the tangle of device cords that typically powered and connected the computer and monitor made the iMac attractive to users who did not know much about computers (TIME Lists, 2013). And also, this new machine triggered the ‘No Beige’ marketing campaign – opposite to the traditional beige computers of the time, iMac had a curvy translucent blue case (O'grady, 2009).
This computer was a huge hit and became the symbol of Apple’s return, bringing viability and profitability to the company, as well as setting tone on computer design as a whole. One of the most influential person in this path to recovery was Jonathan Ive, the main designer of iMac, iPod, iBook, and iPhone (O'grady, 2009).
Finally, in 2000, Steve Jobs accepted the role of CEO, splitting his time between Cupertino and Emeryville, where he was also CEO of Pixar (Linzmayer, 2006). Apple then began a rebirth phase, in 2001, based on three key strategies: Mac OS X; Apple retail stores; and iPod.
Mac OS X was Apple’s first multi-threaded, protected memory operating system, and was the climax of stability, reliability, and security (O'grady, 2009). Praised as virtually crash-proof, OS X was also noted because of its ‘aqua’ look and feel, soft edges and translucent colors. Its stability, speed and ease of use became a major selling point for new Mac users who switched from Windows-driven PCs (TIME Lists, 2013).
On the other hand, the launch of a line of retail stores was a big gamble at the time, but ended up being an essential turning point for the company. Apple built a prototype store (whose concept was borrowed from the Four Seasons Hotel) and introduced one of the greatest innovations, the ‘Genius Bar’ – a station located inside every Apple store, devoted to offering help and technical support to the customers (Elliot, 2012). These retail stores proved to be very lucrative, since Apple’s store sales are the highest in the industry – in 2004, Apple reached $1 billion in annual retail stores, faster than any retailer in the United States (O'grady, 2009).
The third revolutionary Apple strategy was the iPod – a portable music player, with its innovative interface, impressive storage capacity and download capability. iPod enabled people to carry thousands of songs in a compact and comfortable way – “You can fit your whole music library in your pocket" said Steve Jobs (TIME Lists, 2013) – and made it easy for people to access music through an innovative scroll and hierarchical menu system, focusing on an unprecedented simplicity. iPod became the most significant consumer product of 2001, and maybe of the decade (O'grady, 2009).
In 2003, building on its iPod success, Apple opened the iTunes Music Store, with over 200.000 tracks available for the convenient price of 99 cents each (Linzmayer, 2006). Later, in 2006, Apple announced that one billion songs had been legally downloaded from the iTunes Music Store, since
On January 9, 2007, Steve Jobs announced at the Macworld Expo that Apple was dropping the word ‘Computer’ from its name, becoming ‘Apple, Inc.’. The explanation was that Apple was no longer just a computer company – it had the Mac, iPod, Apple TV, and iPhone (Honan, 2007). The change from ‘Apple Computer, Inc.’ to merely ‘Apple, Inc.’ reflected the repositioning of the company into the consumer electronics area instead of a purely computer company (Honan, 2007; Lu, 2007).
On June 2007, Apple showcased the iPhone, named TIME’s ‘Invention of the Year’. On its release, enormous lines were formed outside Apple stores – and the reviews praised wonders about the ‘phone-music player-pocket computer’ that sold 1.4 million units by September of that same year. One year later, iPhone 3G was released at $199, which seemed to be a good value proposition – in the United States, every iPhone model, including this year's iPhone 5, has started at the same price, as long as clients sign a new two-year contract with a mobile phone service provider (TIME Lists, 2013). In Portugal, for example, iPhone 4s (operator free) is sold at €399, while new iPhone 5c price varies between €599 and €699, and iPhone 5s varies between €699 and €899 (both operator free). It is possible to buy an iPhone for a lower price, as long as the client signs a two-year contract with the mobile phone operator (Magno, 2013).
Steve Jobs then unveiled the iPad on January 2010 – what many believed was just a giant iPhone. However, the idea of a giant iPhone stuck as glue among the consumers and iPad paved the way on a seemingly moribund tablet category, becoming Apple's fastest-selling new product ever and inspiring the traditional magazine publishers to release digital editions built especially for iPad. Innumerous electronic companies copied and released lookalike tablets, none of them beating the iPad.By June of 2012 — four months before the released the iPad Mini — Apple had sold 84 million of those ‘giant iPhones’ (TIME Lists, 2013).
2
2
.
.
1
1
.
.
5
5
T
T
HEHE PPRREESSENENTT DDAAYYSSOn October 5, 2011, Steve Jobs – the mastermind behindApple’s iPhone, iPad, iPod, iMac and iTunes – died at 56 years old, after years of fighting a form of pancreatic cancer and a liver transplant. (Potter, Curry, & James, 2011).
Jobs was first diagnosed with cancer in 2003, but his condition was not made public until the following year.From the early beginning, both Jobs and Apple kept the details of his illness as vague as possible – however, the Apple co-founder was privately struggling. On January 2009 he
was forced to go on extended sick leave (time when he underwent a liver transplant). He returned to work 5 months later, in time to launch a string of successful products. Nevertheless, his frail figure made it obvious he was still struggling, and by January 2011 he went on medical leave again. He returned in March to introduce the iPad 2, receiving a standing ovation, but finally resigned as CEO on August that year (Miller, 2011), handing the reins to long-time deputy Tim Cook, hand-picked by Steve himself before succumbing to pancreatic cancer (Kane & Flower, 2011; Schuppe & Fernandez, 2012).
Although it was public knowledge that Jobs was suffering from the disease, his death came as a shock to the world. His successor Tim Cook has faced many critiques as well as the overpowering doubt of those who believe Apple’s future is doomed without Steve Jobs at its helm. However, Jobs was always committed to finding the right people to surround him. Over the last decade, he spent a lot of time and energy in assembling an executive team that could function without him. People like Tim Cook, Jonathan Ive, Phil Schiller, Bob Mansfield, Eddy Cue, and Scott Forstall each bring great contribution to the team (Macworld Staff, 2012).
Although Steve Jobs will always impact the shape of the company to a certain degree, that does not mean Apple relies solely on his back – actually, he intended for that not to happen. According to Cook, Jobs once told him how Disney employees would ask themselves what the company’s late founder, Walt Disney, would do in certain situations – “And he looked at me with those intense eyes that only he had, and he told me to never do that, to never ask what he would do” Cook said (Macworld Staff, 2012).
By August 2012, Apple delivered a rare earnings disappointment. Weak iPhone sales growth was the main cause, which Apple tried to explain by citing ‘rumors and speculation’ about a new iPhone that could be leading consumers to wait for the new model. Despite not achieving the Wall Street expectations of $37 billion sales, Apple has since rebounded, in part because the company’s stock is still seen as safe in an especially turbulent market (Gustin, 2012).
Regardless of all the tribulations, Steve Jobs instilled a culture of innovation and execution within Apple’s DNA that has the strength to prevail in the future – led by CEO Tim Cook, the company’s chief operating officer for the last decade, instrumental in Apple’s production and supply-chain operation (Gustin, 2012).
It is undeniable, however, that the Apple cult and devotion individuals have toward the brand was nurtured by Steve Jobs’ charismatic leadership and marketing capabilities. Literature focusing on his biography shows that he was not an easy man to work with, but his persistence and ability to create ideas and market them successfully are unquestionable, and ultimately helped him build the most valuable technology company in the world (Lüsted, 2012).
2
2
.
.
2
2
A
A
PPPPLLEE’
’
SSPPOOSSIITTIIOONNIINNTTHHEEMMAARRKKEETTCurrently, Apple offers four main product lines – Mac, iPod, iPhone, and iPad – in addition to innumerous applications, including the iTunes, and accessories (Apple Inc., 2013).
The Mac line is comprised nowadays by the MacBook Air, MacBook Pro, Mac mini, iMac, and Mac Pro. The new operating system OS X Mavericks has already been released – it is the successor of Mountain Lion – and the company has available innumerous accessories and applications. In the iPod line, one can find the iPod shuffle, iPod nano, iPod touch, and iPod classic, as well as the Apple TV device, headphones and accessories. The iPhone has faced great evolutions; currently the latest models are available for purchase on the Apple store – iPhone 5c and iPhone 5s – along with several applications and accessories. The iPad line currently showcases the iPad mini with Retina display and the newly released iPad Air, along with iPad accessories (Apple Inc., 2013). iOS is Apple’s mobile operating system, used in the iPhone, iPad, and iPod touch. iOs 7 is the latest launch of the arguably world’s most advanced mobile operating system, as its easy-to-use interface and features keep Apple devices the most easy and intuitive to use (Apple Inc., 2013). iTunes is a free app which allows users to organize and play music, as well as video, on their computer and other Apple devices. iTunes compiles everything (music, movies, and TV shows) in one single place, by allowing users to import the files into iTunes and quickly browse the whole collection. The latest innovation was the iTunes Radio, with free streaming of radio stations. Complementarily, iCloud makes it possible to store and access contents, such as photos, calendar, contacts, documents, and more, from whatever Apple device the client is using, wirelessly and without syncing (Apple Inc., 2013).
2
2
.
.
2
2
.
.
1
1
A
A
PPPPLLEE’
’
SS EEVVOOLLUUTTIIOONN IINN TTHHEE SSTTOOCCKK MMAARRKKEETTAnalyzing Apple’s historical evolution in the stock market, we can divide it in three periods: the early years, the Jobs’ golden era (Nerney, 2010), and the post-Jobs’ time.
The first period begins with the Initial Public Offering, in 1980, and goes across the time when Steve Jobs left the company, due to a power struggle with the board, in 1985 (Nerney, 2010). The second began in 1997, when the company co-founder was named interim CEO, and long-lasted through a strategic change of cutting dozens of products to focus solely on what Apple could do best – the world witnessed Apple’s success grow as the iMac, Mac OS X, Apple stores, iPod and iTunes, iOS, iPhone, and finally iPad were unveiled, awing and revolutionizing the entire industry (Linzmayer, 2004; Nerney, 2010; O'grady, 2009; TIME Lists, 2013).
On October 5, 2011 Steve Jobs succumbed to his pancreatic cancer, leaving Tim Cook the task of presiding the company he co-founded with Steve Wozniak. His passing caused a big turmoil among investors, as well as the general public, as many people believed Apple could not continue one of the world’s most valuable and innovative companies without its maven Steve Jobs (Kane & Flower, 2011; Macworld Staff, 2012; Schuppe & Fernandez, 2012).
So Apple underwent different periods overtime, and it has not been all uphill. Chart 1 divides the first from the second periods (1985 – 1997, when Jobs left Apple; 1997 – 2010, under Jobs’ guidance) and shows that Apple’s stocks climbed above $300 for the first time on October 6, 2010, nearly 30 years after Apple's IPO in 1980. But in the meantime, like almost every technology company, Apple endured
a rough few years after the Internet bubble burst in March 2000, and had another down-slide in the second half of 2008, during the severe recession (Nerney, 2010).
After that period, Apple would face a big loss in 2011, with Steve Jobs’ death, which concerned a great amount of people regarding the future of the company. However, less than a year after Jobs’ passing, Apple became the most valuable company in history in terms of market capitalization, on August 20, 2012 (see Chart 2). The company achieved a market-capitalization of over $620 billion with shares trading over $662.00 apiece. Some of the reasons appointed for this rise in the stock were the surfacing of rumors surrounding the iPhone 5 as well as the iPad Mini. Then, in September, around the time of iPhone 5 release, Apple’s stock hit the $720 billion mark, once more reinforcing its value. This put Apple way ahead its long-time rival Microsoft, who at that period presented a market-capitalization of about $257 billion – although Microsoft had hit its all-time high on December 30, 1999, at the height of the technology bubble, reaching around $850 billion in inflation-adjusted dollars (Forbes, 2012).
Since that high peak in 2012, Apple’s gross margin and stock price have fallen. In April this year, the fall of Apple’s stock price hit the 40% mark, vaporizing almost $300 billion of market value. One of the reasons for this collapse is related to Apple's profit margin dramatic drop over the past year. Also, the growth of Apple's biggest and most profitable product, iPhone, stagnated. From January to April 2013, iPhone sales grew only 7%, which was well below the estimated 30% growth rate for the smartphone industry as a whole. The possible justification for that deceleration is that the growth of smartphone market has now moved out of rich developed markets into poorer emerging markets – Apple's distribution is limited in these markets, and its products are just too expensive to compete (Blodget, 2013).
Chart 2 – Apple’s stock price evolution from January 2012 to January 2013. (Yarow, 2013)
So in the first semester of 2013, there was a noticeable concern with Apple’s future, mainly due to a significant decrease of iPhone’s sales growth – that was about to change.
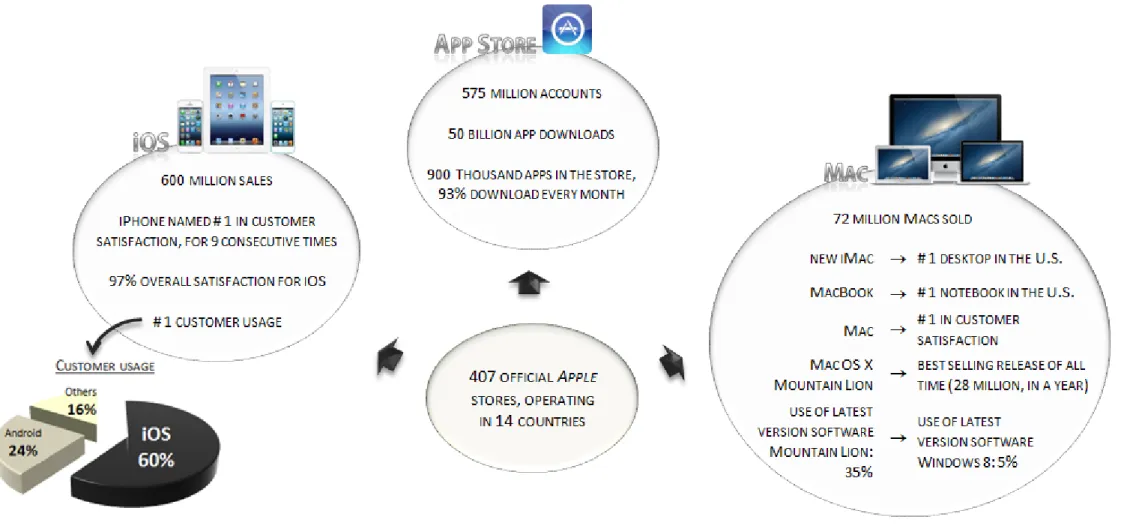
On the Worldwide Developers Conference (WWDC), in June, Apple introduced the all-new iOS 7, OS X Mavericks, the new MacBook Air and gave a preview on the new Mac Pro (Apple Keynote - WWDC, 2013). Amidst all the speculation about Apple’s big drop on the stock market, Tim Cook opened up the WWDC with a pack of astonishing numbers that would rise even further in September, with the new iPhone 5c and 5s sales. Figure 1 shows a brief of the results presented at the Conference.
Then, in September, Tim Cook announced, among other things, the iPhone 5c and iPhone 5s, two models created to satisfy different needs in the market. On September 23, 2013, Apple set a new all-time record for iPhone launch sales: a reportedly 9 million total iPhone 5c and 5s units were sold over that weekend, well over the 5 million of the iPhone 5 launch the previous year. Also more than 200 million devices were already running iOS 7, the latest mobile software launched – that is the fastest software upgrade in history, according to Apple (Fingas, 2013).
2
2
.
.
2
2
.
.
2
2
A
A
PPPPLLEE NNAAMMEEDD MMOOSSTT VVALALUUAABBLLEE BBRRAANNDD IINN TTHHEE WWOORRLLDDCorroborating the legions of adoring fans that broke the sales record with the iPhone 5c/5s purchases, brand consulting company Interbrand has named Apple this year’s most valuable brand in the world, overtaking Coca-Cola after its 13-years-rein in the head of the ‘Best Global Brands’ list (Padilla, 2013).
According to Interbrand, “for revolutionizing the way we work, play, and communicate – and for mastering the ability to surprise and delight – Apple has set a high bar for aesthetics, simplicity, and ease of use that all other tech brands are now expected to match, and that Apple itself is expected to continually exceed” (Interbrand, 2013).
Figure 1 – Apple’s sales numbers, presented on the Worldwide Developers Conference, in June 2013. (Apple Keynote - WWDC, 2013)
Apple reached a financial pinnacle in 2012, becoming the most valuable company of all time. Although that peak was not sustained, Apple counts today 72 million Macs in use, over 600 million iOS devices sold, and Apple stores are performing better than any other physical retail store – the brand has been awarded by its stores’ distinctive design and layout (Interbrand, 2013).
Chart 3 shows a comparison between Apple and the rest of the technology sector, regarding brand value.
2
2
.
.
2
2
.
.
3
3
T
T
HEHE CCOOMMPPETETIITTOORRSSRegarding the competitive landscape, is hard to name Apple’s biggest opponent, since the company makes a wide variety of products that penetrate many different markets (Arnold, 2013). Nevertheless, dividing the products by markets, we may present some of Apple’s biggest competitors. In the iPod era, there was Creative and Sony and many others. In the smartphone market, Samsung is undoubtedly the highest contender. As for the competitors in the tablet market, perhaps Amazon, Samsung or Microsoft qualify as potential threats. And iTunes might be threatened by Netflix or Spotify. The Mac surely competes with HP, Dell, and Toshiba. On the other hand, iCloud’s biggest competition is Dropbox or Google Drive (Arnold, 2013; Dediu, 2013).
Chart 3 – Comparison between Apple and the rest of technology sector, regarding brand value. (Interbrand, 2013)
Currently, is difficult to decide whether Apple’s highest competitor is Google or Samsung. Google qualifies as an Apple competitor on multiple fronts: smartphones – recently unveiled the Android-powered Moto X; cloud service – Google Drive; and wearable tech products, which Apple is rumored to enter soon – Google has already ventured into this growing market with its Google Glass product (Arnold, 2013). However, Google has shown steady but not spectacular growth in revenues with decreasing margins (Dediu, 2013).
Samsung, on the other hand, has showed a great rise driven by Galaxy-branded smartphones that have become extremely popular, directly fighting Apple’s iPhone (Minyanville Staff, 2013). Also in the tablet market, Samsung provides competition with the Samsung Galaxy Tab line. And finally, Samsung already released the Samsung Galaxy Gear Smartwatch, being ahead of Apple’s much rumored iWatch. Many believe Samsung’s recent growth has to do with the fact that its devices and operating systems are stable, reliable and useful, and they are being marketed well. Even though Samsung’s great growth is undeniable, Dediu (2013) argues there is doubts about its sustainability, mainly due to lower operating margins than the rivals Apple, Google, and Microsoft. Just as Microsoft was Apple’s archrival during the PC era, Samsung has now risen as one of Apple’s biggest opponents in the age of mobile devices, beating once strong names such as Nokia and BlackBerry. In turn, many consider Google the main competitor for Apple in the long run (Minyanville Staff, 2013).
This year, Apple bested Google who is now the current runner-up to the most valuable brand in the world (see Chart 4), and is also ahead of rival Samsung – who enters the top 10 ‘Best Global
Chart 4 – Brand value comparison for the technology sector. (Interbrand, 2013)
Brands’ for the first time (Padilla, 2013). Regarding Microsoft, Mac sales have grown an average 15 percent per year, compared with 3 percent growth for the PC market (Interbrand, 2013). Chart 5 demonstrates the positioning of Apple in the technology sector, compared with its major rivals Google, Samsung and Microsoft, regarding brand value.
Chart 5 – Brand value comparison between Apple and (1) Google, (2) Samsung, (3) Microsoft. (Interbrand, 2013)
C
C
H
H
A
A
P
P
T
T
E
E
R
R
I
I
I
I
I
I
–
–
L
L
I
I
T
T
E
E
R
R
A
A
T
T
U
U
R
R
E
E
R
R
E
E
V
V
I
I
E
E
W
W
3
3
3
.
.
1
1
B
B
RRAANNDDSSA brand is a name given to a particular product or service to distinguish it from its competitors. According to Kotler, Keller, Brady, Goodman, and Hansen (2009, p. 425), “a brand is a name, symbol, logo, design or image, or any combination of these, which is designed to identify the product or service”. For several managers, however, brand is much more than that – is the creation of awareness, reputation, prominence and so on, in the marketplace (Keller, Apéria, & Georgson, 2008). A brand can also be interpreted as the expectations and perceptions arising from the experience of the product or the organization (Davis, 2002).
Besides this commonly accepted definition of brand, Chernatony and Riley (1998) made an extensive literature review and found twelve themes where we can categorize a brand as a: legal instrument, logo, company, shorthand, risk reducer, identity system, image in consumers’ mind, value system, personality, relationship, adding value, and evolving entity. For the purpose of the present study we will focus on the consumer-brand relationships, although this dimension inevitably incorporates some of the others.
The brand’s components, both tangible and intangible, interact with consumers and, over time, they build a more established brand in consumers’ mind (Mohammad, 2012). A brand is indeed a product or service whose dimensions differentiate it from the competitors designed to satisfy the exact same needs (Kotler et al., 2009).
Brands have a vital impact on consumers’ choice of products, since they give them the functions that meet their desires, as well as the status they want to achieve in the community. The more the customer is aware of the brand, the higher the probability of loyalty to that brand – in fact, famous brands have the ability to more efficiently spread the benefits associated with that brand than unknown brands, thereby consumers prefer famous and known brands (Mohammad, 2012). This leads to a very important distinction: brand identity and brand image. The first concerns to the way a company wants to identify or position itself or its products in the marketplace. Brand
the visual or verbal expressions of the brand, which lead to psychological or emotional associations the brand hopes to trigger in consumers’ mind (Kotler et al., 2009). The power of the brand relies on what is inside the consumers’ mind, showing the extreme importance of brand image. There has been an association of emotional responses with brands, namely sensory pleasure, aesthetic beauty and excitement, and it has been acknowledged that people express themselves through their brand choices, since people brand themselves by the clothes they wear, the people they associate with, the places they go, the music and the uploads they have in their social sites, among many other ways (Kotler et al., 2009).
Brands are intangible assets of great value both to companies and consumers. Brands can create relationships with consumers, whether positive relationships, by being loyal to the brand, or negative relationships, by changing to another brand. In sum, brands are extremely important for companies, since they attract consumers, influence their behavior and encourage them to repeat the purchase process (Mohammad, 2012).
3
3
.
.
2
2
C
C
OONNSSUUMMEERR-
-
BBRRAANNDDRREELLAATTIIOONNSSHHIIPPFournier (1998) introduced the consumer-brand relationship theory (also referred to as brand relationship quality), that has demonstrated its usefulness for understanding the dynamics of the connection between consumers and brands, and the role brands play in consumers’ life (Sung & Choi, 2010).
In their literature review, Chernatony and Riley (1998) acknowledge the view of a brand as a relationship. Fournier (1998) also defended that interdependence between consumers and brands must exist in order to build a relationship, and that to legitimize the brand as a partner, consumers highlight the ways brands are animated, humanized or personalized – consumers do not see the brand as a passive object, but as an active member contributing to the relationship. Previous studies have shown that people animate brands with human qualities and create relationships with them similar to interpersonal relationships – the motivation for this phenomena relies on the fact that humans see their assets (in this case, their brands) as an extension of themselves (Pang et al., 2009).
Although the nature of consumer-brand relationships is not identical to the relationships between humans, interpersonal relationship literature has been helpful in the comprehension of these
dynamic and multidimensional relationships between consumers and brands (Sung & Choi, 2010). In fact, consumers humanize brands to obtain not only utilitarian benefits, but also enjoy meaningful relationships with a partner brand, as well as share symbolic social and cultural values (Fournier, 1998; Sung & Choi, 2010).
Since consumers instill brands with human characteristics, the interaction with brands becomes similar to human relationships and brands are treated as human-like partners. Although consumers’ relationships with brands have differences from relationships between humans (for instance, romantic relationships which are exclusive, whereas consumers can simultaneously develop and sustain relationships with multiple brands), it is accepted that consumer-brand relationships share qualities similar to human relationships, and consumers consider brands as viable relationship partners (Fournier, 1998; Sung & Choi, 2010).
Breivik and Thorbjørnsen (2008) share this point of view and accept the metaphorical transference of human relationships to marketing relationships. They believe consumer-brand relationships share common elements with interpersonal relationships, such as the partnership, the commitment, the interdependence, the love, among others. They presented in their study an investigation about two alternative models in light of which the consumer-brand relationship construct may be analyzed: the brand relationship quality model (BRQ model), proposed by Fournier (1998); and the relationship investment model (RI model), presented by Rusbult (1980). The BRQ model was specifically developed to evaluate the tie strength between consumers and brands, whereas the RI model was originally developed to comprehend satisfaction and commitment in romantic relations and friendships (Breivik & Thorbjørnsen, 2008).
The BRQ model is composed of six dimensions that influence the relationships’ stability and durability: passion, self-concept connection, personal commitment, behavioral interdependence, intimacy, and partner quality (Breivik & Thorbjørnsen, 2008).
The RI model, on the other hand, is viewed as an extension to the interdependency model proposed by Kelley and Thibaut, in 1978, which outlines two sources of dependency: satisfaction with the current relationship partner and the quality of alternatives. This RI model yet offers another source of dependency – relationship investment – and highlights commitment as a mediating construct. The investment on the relationship might be direct, such as time and money,