Modelling of the thin layer drying kinetics of pears
R. P. F. Guiné, 1M. J. Barroca, 2M. J. Lima, 3D. M. S. Ferreira
CI&DETS, Polytechnic Institute of Viseu, ESAV, Quinta da Alagoa, Ranhados, 3500-606 Viseu, Portugal; tel. + 351 232 446 641, e-mail: [email protected]; 1CERNAS, IPC, ISEC, DEQB, Rua Pedro Nunes, Quinta da Nora, 3030-199 Coimbra, Portugal; e-mail: [email protected]; 2CI&DETS, IPV, ESAV, Quinta da Alagoa, Ranhados, 3500-606 Viseu, Portugal; e-mail: [email protected]; 3CI&DETS, IPV, ESAV, Quinta da Alagoa, Ranhados, 3500-606 Viseu, Portugal; e-mail: [email protected].
INTRODUCTION
Drying is a very widely used method to preserve foods, and stands on the removal of water to such a low level that minimizes microbial activity and reproduction as well as deterioration reactions (Doymaz, 2007). Furthermore, drying also reduces weight for transportation and space for storage, besides avoiding the need of refrigeration systems, and the cost associated to them.
Open-air sun drying has been traditionally used to dry grains, vegetables, fruits and other agricultural products. This is a common method of preserving foods and it is practiced until today in many countries where the climatic conditions are appropriate (Togrul & Pehlivan, 2004). The study of the drying processes contributes to the understanding of these operations, and eventually the establishment of appropriate operating conditions (Fadhel et al, 2005).
“Pera Passa de Viseu” denominates a traditional food product made after pears of the variety S. Bartolomeu using a traditional open-air sun drying (Barrocal et al, 2006). Even though it is quite a cheap drying method, it has many important disadvantages, such as: slowness of the process; dependency from weather conditions; deficient quality of the product due to many types of contaminations (Karathanos & Belessiotis, 1997). Therefore, the development of alternative drying methodologies assumes a pivotal role.
In previous studies the S. Bartolomeu pears have been characterized before and after sun-drying (Ferreira et al, 2001 and 2002) and the effect of ripening stage on the sun-drying kinetics has been and on some physical and chemical properties along drying has been evaluated for three different harvest dates (Guiné et al, 2009).
The objective of this work was to fit the kinetic data to different thin layer models found in literature to describe the drying rates of food products, in order to compare the drying rates in the different systems tested and also to find out which model is best to describe the drying kinetics of these pears.
EXPERIMENTAL
The pears used in the present study are of the Portuguese variety S. Bartolomeu, and were dried like in the traditional method after peeling but uncut. However, unlike in the traditional method the pears were not dried under open-air sun exposure, and, alternatively, were dried in three different systems: a solar stove – ESAV (Figure 1), a solar drier – ESTV (Figure 2) and a drying tunnel – UC, where the drying air is heated by a solar collector (Figure 3). All these systems intend to make use of the sun as the heating source.
Figure 1. Solar stove (ESAV).
Figure 3. Drying tunnel and solar collector (UC).
In the ESAV and ESTV systems, the temperature and relative humidity were variable according to the weather conditions and night/day hours during the period of drying. In the UC system, the temperature was kept constant at 40-42 ºC and the drying air velocity was always 1.1 m/s. In the ESAV system the air velocity was also kept constant at 0.4 m/s.
The drying was carried out until the pears reached the desired moisture content of about 20 % (wet basis), for being the optimum content for conservation and product quality. However, in some cases the final moisture was under this reference because when the samples were analyzed their moisture had already lowered under the optimum value. The drying time was 121 hours in the UC system, 96 h in the ESAV system and 68 h in the ESTV system.
Along drying the moisture content of the pears was determined by sampling in the ESAV and ESTV systems, being measured with a Halogen Moisture Analyser, model HG53, from Mettler Toledo. In the UC system the moisture was determined by weight loss, measured by weighing the whole set of pears along drying.
MATHEMATICAL MODELS
The experimental data was plotted in graphs of moisture ratio (MR) against drying time, where MR is given by:
(1) Wo We Wo W MR − − =
with W the moisture content at time t, Wo the initial moisture content and We the equilibrium moisture content, all expressed in dry basis. To model the drying kinetics the experimental points (MR, t) were fitted with software SigmaPlot V8.0 (SPSS, Inc.) to different thin layer kinetic models found in literature and presented in Table 1.
Table 1. Thin layer kinetic models from literature (Togrul & Pehlivan, 2004).
Equation Name
MR = exp(-Kt) Newton
MR = exp(-Ktn) Page
MR = a exp(-Kt) Henderson & Pabis MR = a exp(-Kt) + c Logarithmic
MR = 1 + at + bt2 Wang and Singh
MR = a exp(-Kt) + b exp(-k1t) Logarithmic two-term
MR = a exp(-Kt) + b exp(-k1t) + c exp(-k2t) Modified Henderson & Pabis
RESULTS AND DISCUSSION
Figure 4 shows the experimental data for the three drying systems, as well as the corresponding fits obtained with the Newton model. From the graph is seen that the solar drier system (ESTV) gives the faster drying, presenting a bigger slope in the drying curve. On the other hand, the solar stove (ESAV) and drying tunnel (UC) systems are very much alike, and with similar drying rates. These observations are confirmed with the data presented in Table 2, which summarises the results obtained for all the fits made in the present work. In fact, it is seen that the drying constant, K, is far greater in the ESTV system (0.0614) than in the other two systems (0.0253 in ESAV and 0.0278 in UC).
Figure 4. Fitting with the Newton model to the experimental data in the three systems: UC – drying tunnel, ESAV – solar stove, ESTV – solar drier.
.
Newton
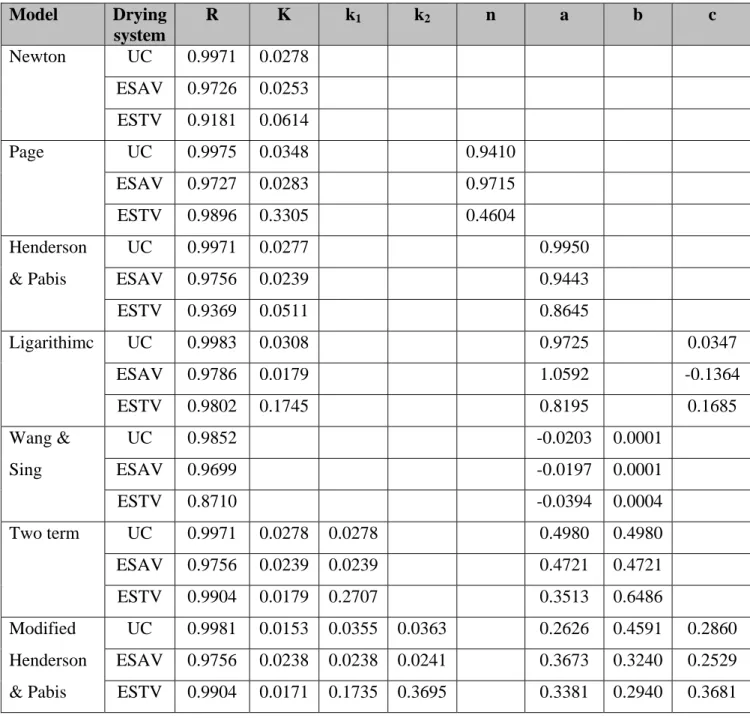
Time (h) 0 20 40 60 80 100 120 140 MR (W W )/( W W 0,0 0,2 0,4 0,6 0,8 1,0 1,2 UC ESAV ESTV Fit UC Fit ESAV Fit ESTVTable 2. Parameters estimated and coefficients of regression for the fittings with the different models to the experimental data of the three drying systems.
Model Drying system R K k1 k2 n a b c Newton UC 0.9971 0.0278 ESAV 0.9726 0.0253 ESTV 0.9181 0.0614 Page UC 0.9975 0.0348 0.9410 ESAV 0.9727 0.0283 0.9715 ESTV 0.9896 0.3305 0.4604 Henderson UC 0.9971 0.0277 0.9950
& Pabis ESAV 0.9756 0.0239 0.9443
ESTV 0.9369 0.0511 0.8645 Ligarithimc UC 0.9983 0.0308 0.9725 0.0347 ESAV 0.9786 0.0179 1.0592 -0.1364 ESTV 0.9802 0.1745 0.8195 0.1685 Wang & UC 0.9852 -0.0203 0.0001 Sing ESAV 0.9699 -0.0197 0.0001 ESTV 0.8710 -0.0394 0.0004 Two term UC 0.9971 0.0278 0.0278 0.4980 0.4980 ESAV 0.9756 0.0239 0.0239 0.4721 0.4721 ESTV 0.9904 0.0179 0.2707 0.3513 0.6486 Modified UC 0.9981 0.0153 0.0355 0.0363 0.2626 0.4591 0.2860 Henderson ESAV 0.9756 0.0238 0.0238 0.0241 0.3673 0.3240 0.2529 & Pabis ESTV 0.9904 0.0171 0.1735 0.3695 0.3381 0.2940 0.3681
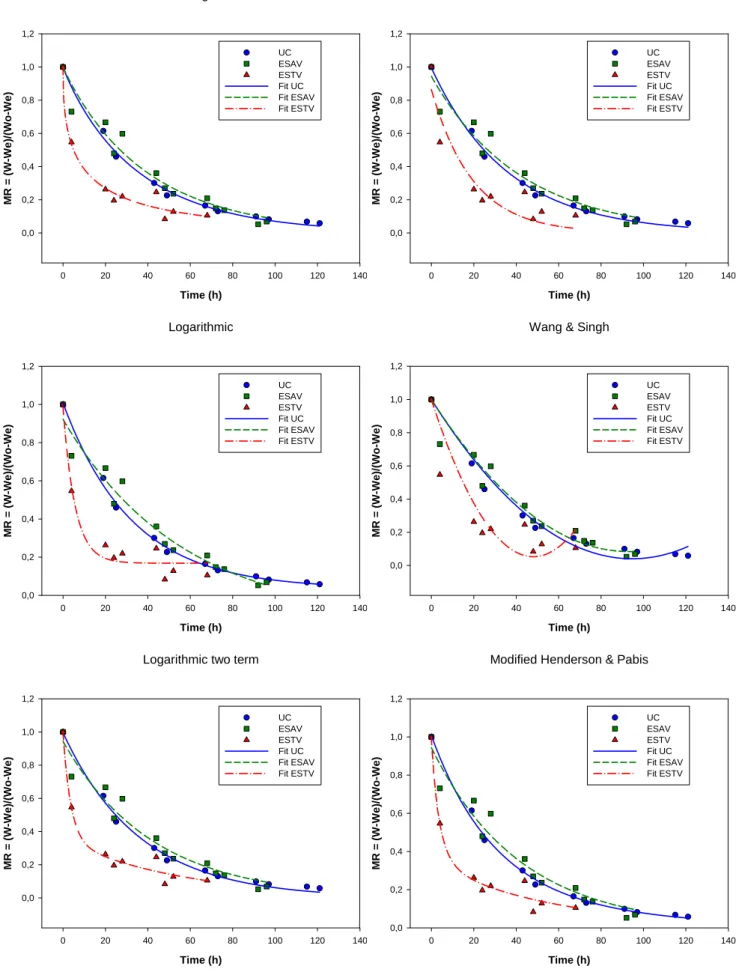
Figure 5 shows the fittings for the three drying systems made with the other 6 models tested: Page, Henderson & Pabis, logarithmic, Wang & Singh, Logarithmic two term, modified Henderson & Pabis. By observing the graphs, is possible to see that the models logarithmic two terms and modified Henderson & Pabis are very similar, and produce almost equal curves. On the other hand, the worst model is Wang & Singh since it produces curves that do not reproduce accurately the final stages of drying. This result is further confirmed in Table 2, where the values of the regression coefficients of the fittings are presented, being the
Figure 5. Fittings for the three drying systems made with the models: Page, Henderson & Pabis, logarithmic, Wang & Singh, Logarithmic two term, modified Henderson & Pabis.
Page Time (h) 0 20 40 60 80 100 120 140 M R = (W-W e) /( Wo -W e) 0,0 0,2 0,4 0,6 0,8 1,0 1,2 UC ESAV ESTV Fit UC Fit ESAV Fit ESTV
Henderson & Pabis
Time (h) 0 20 40 60 80 100 120 140 M R = (W-W e) /( Wo -W e) 0,0 0,2 0,4 0,6 0,8 1,0 1,2 UC ESAV ESTV Fit UC Fit ESAV Fit ESTV Logarithmic Time (h) 0 20 40 60 80 100 120 140 M R = (W-W e) /( Wo -W e) 0,0 0,2 0,4 0,6 0,8 1,0 1,2 UC ESAV ESTV Fit UC Fit ESAV Fit ESTV
Logarithmic two term
Time (h) 0 20 40 60 80 100 120 140 M R = (W-W e) /( Wo -W e) 0,0 0,2 0,4 0,6 0,8 1,0 1,2 UC ESAV ESTV Fit UC Fit ESAV Fit ESTV
Wang & Singh
Time (h) 0 20 40 60 80 100 120 140 M R = (W-W e) /( Wo -W e) 0,0 0,2 0,4 0,6 0,8 1,0 1,2 UC ESAV ESTV Fit UC Fit ESAV Fit ESTV
Modified Henderson & Pabis
Time (h) 0 20 40 60 80 100 120 140 M R = (W-W e) /( Wo -W e) 0,0 0,2 0,4 0,6 0,8 1,0 1,2 UC ESAV ESTV Fit UC Fit ESAV Fit ESTV
In Figure 6 the experimental data for the faster drying system (solar drier) is fitted with all the models, being clear that the ones that fit better the experimental data, giving higher values of the regression coefficient (R = 0.9904) are the two term and modified Henderson & Pabis, which originate practically coincident curves. As previously seen, the model that is less good to predict the drying kinetics of these pears under the drying conditions mentioned is the Wang & Singh, which has the lowest regression coefficient (R = 0.8710).
Figure 6. Fitting of the experimental kinetic data in the solar drier (ESTV) with all the models tested. ESTV Time (h) 0 20 40 60 80 MR = ( W -We)/(Wo-We) 0,0 0,2 0,4 0,6 0,8 1,0 1,2 Experimental points Newton (R = 0.9181) Page (R = 0.9896)
Henderson & Pabis (R = 0.9369)
ESTV Time (h) 0 20 40 60 80 MR = (W-W e )/(Wo-We) 0,0 0,2 0,4 0,6 0,8 1,0 1,2 Experimental points Logarithmic (R = 0.9802) Wang & Singh (R = 0.8710) Logarithmic two term (R = 0.9904) Modified Henderson & pabis (R = 0.9904)
CONCLUSION
The present work allowed to conclude that the solar drier system (ESTV) is faster to dry the pears, when compared to the other two systems tested, the solar stove (ESAV) and the drying tunnel (UC), which originate similar drying rates. As to the different kinetic models tested, it was concluded that the models logarithmic two term and modified Henderson & Pabis originate practically coincident curves, and revealed to be the better ones to fit the experimental data, while the Wang & Singh model proved to be the less good.
Acknowledgment: The authors thank CI&DETS, CERNAS and FCT (project PTDC/AGR-ALI/74587/2006) for financial support.
References
Barroca MJ, Guiné RPF, Pinto A, Gonçalves FM, Ferreira DMS (2006) Chemical and microbiological characterization of Portuguese varieties of pears. Food and Bioproducts Processing, 84, 109-113.
Doymaz I (2007) The kinetics of forced convective air-drying of pumpkin slices. Journal of Food Engineering, 79, 243-248.
Fadhel A, Kooli S, Farhat A, Bellghith A (2005) Study of the solar drying of grapes by three different processes. Desalination, 185, 535-541.
Ferreira D, Guyot S, Marnet N, Delgadillo I, Renard CMGC, Coimbra MA (2002) Composition of phenolic compounds in a Portuguese pear (Pyrus communis L. var. S. Bartolomeu) and changes after sun-drying. Journal of Agricultural and Food Chemistry, 50, 4537-4544.
Guiné R, Lopes P, Barroca MJ, Ferreira DMS (2009) Effect of ripening stage on the solar drying kinetics and properties of S. Bartolomeu Pears (Pyrus communis L.). International Journal of Academic Research, 1(1), 46-52.
Togrul IT, Pehlivan D (2003) Modelling of drying kinetics of single apricot. Journal of Food Engineering, 58(3): 23-32.
Togrul IT, Pehlivan D (2004) Modelling of thin layer drying kinetics of some fruits under open-air sun drying process. Journal of Food Engineering, 65(3), 413-425.