The impact of the Eurosystem’s
asset purchase programmes on
the cost of funding
Master's Final Work in the modality of Dissertationpresented to Católica Porto Business School to fulfill the requirements for the degree of MSc. in
Finance
by
Luis André Pires de Carvalho
under the supervision of Prof. Dr. João Filipe Monteiro Pinto.
Católica Porto Business School April 2018
iii
Acknowledgments
The complexity of this thesis has challenged my ability to research and time management skills.
I would like to express my sincere gratitude to all the people that without whom it would not have been possible to carry out this work. First, I would like to thank my supervisor, Professor João Pinto, who has always shown total guidance, motivation and availability during this work, for his precious advice, for the sharing of knowledge and for the impartial vision given to the analysis. Finally, I would like to thank my family and girlfriend for the patience, understanding and support expressed during the period of work, as they frequently say: “smooth seas do not make skilful sailors”.
v
Resumo
O objetivo deste trabalho é investigar os impactos do programa de compra de ativos (APP) sobre o custo de financiamento dos países e empresas da zona euro. Para a análise empírica, foram consideradas 23.283 observações que são divididas em duas categorias: 9.053 obrigações soberanas (SB) e 14.830 obrigações emitidas por empresas não financeiras (CB), entre 1 de janeiro de 2000 e 31 de dezembro de 2016, em países da zona euro. O método usado para dar resposta às questões de investigação foi a utilização de uma regressão OLS (método dos mínimos quadrados).
Os resultados mostraram que os seguintes programas de compra de ativos: CBPP1 e CBPP3, atingiram os objetivos do BCE e contribuíram positivamente para a redução dos custos de financiamento de médio prazo dos Estados e empresas da zona euro. Por outro lado, o CBPP2 e o CSPP tiveram um efeito negativo na política do BCE, tendo levado a um aumento dos yields.
Além disso, foi demonstrado que nos PIIGS, somente o CBPP3 teve o efeito desejado de redução do YTM no mercado de CB. Por outro lado, o CBPP2 provocou um aumento na YTM das emissões de CB nos PIIGS. Em relação ao impacto dos SB no YTM dos PIIGS, verificou-se que tanto o CBPP1, como o CBPP3 tiveram um efeito positivo de redução do YTM, enquanto os programas CBPP2 e CSPP tiveram efeito adverso face ao que seria esperado pelo BCE, uma vez que estes levaram a um aumento dos YTM nos PIIGS.
Finalmente, os resultados também revelaram que as variáveis que tiveram o efeito mais significativo sobre rendimentos yields de SB e CB para os países e empresas localizadas nos PIIGS foram: a crise de dívida soberana, a taxa isenta de risco e a variável “tranche to transaction”.
Palavras-chave: programas de compra de ativos, obrigações, quantitative easing, obrigações soberanas.
vii
Abstract
The purpose of this work is to investigate the impacts of the ECB asset purchase programme (APP) on the cost of funding by countries and companies from the eurozone. For the empirical analysis, it was considered 23,283 observations that are divided into two categories: 9,053 sovereign bonds and 14,830 corporate bonds, issued by eurozone states and corporates between January 1, 2000 and December 31, 2016. The method used to answer the research questions was an OLS regression (least squares method).
The results showed that the following asset purchase programs: CBPP1 and CBPP3 met the ECB goals and contributed positively to the reduction of the medium-term financing costs of euro area states and companies. On the other hand, CBPP2 and CSPP had an adverse effect on ECB policy, leading to an increase in yields.
Furthermore, it was demonstrated that in PIIGS, only CBPP3 had the desired effect of YTM reduction in the CB issues. On the other hand, as in the emissions of German companies, CBPP2 caused an increase in the YTM of CB emissions in PIIGS. Regarding the impact of SB on PIIGS YTMs, it was found that both CBPP1 and CBPP3 had a reducing effect, whereas the CBPP2 and CSPP programs had an adverse effect on what was expected from the ECB, since they led to an increase of the YTM in PIIGS.
Finally, the results also displayed that the variables that have had the most significant effect on the SB and CB yield to maturity of PIIGS were the sovereign debt crisis, the risk-free rate and the “tranche to transaction” variable.
Keywords: asset purchase programs, corporate bonds, quantitative easing, sovereign bonds.
ix
Table of Contents
Acknowledgments ... iii Resumo ... v Abstract ... vii Table of Contents ... ixList of Figures ... xii
List of Tables: ... xiv
Acronyms ... xvi
Introduction ... 1
Chapter 1: Literature review ... 4
1.1 Overview ...4
1.2 Conventional Policies ...5
1.3 Unconventional Policies ...6
1.3.1 Quantitative easing... 7
1.3.2 Asset Purchase Programs ... 8
1.3.2.1 Sovereign bond market... 10
1.3.2.2 Covered bond market ... 12
1.3.2.3 Asset Securitization ... 17
1.4 Risks and criticisms of the APP ... 20
1.5 Cost of funding ... 21
1.5.1 Countries’ cost of funding ... 21
1.5.3 Corporate funding ... 23
1.6 Spread Determinants ... 25
Chapter 2: Research Questions and Methodology ... 28
2.1 Research Questions ... 28
2.2 Methodology ... 28
Chapter 3: Sample Selection and descriptive statistics ... 30
3.1 Sample Selection ... 30
3.2 Univariate Analysis ... 30
Chapter 4: Empirical Analysis ... 35
4.1 Determinants of yield to maturity for SB and CB ... 35
x
4.4 Multivariate Analysis ... 39
Chapter 5: Robustness Checks ... 47
Conclusion... 53
Bibliography ... 57
Attachments ... 63
xii
List of Figures
Figure 1 – Covered Bond System ... 13
Figure 2 – Accumulated covered bond purchases by Eurosystem under the CBPP ... 14
Figure 3- Total amount outstanding of covered and uncovered bank bonds .... 15
Figure 4 - Covered bond swap spreads ... 16
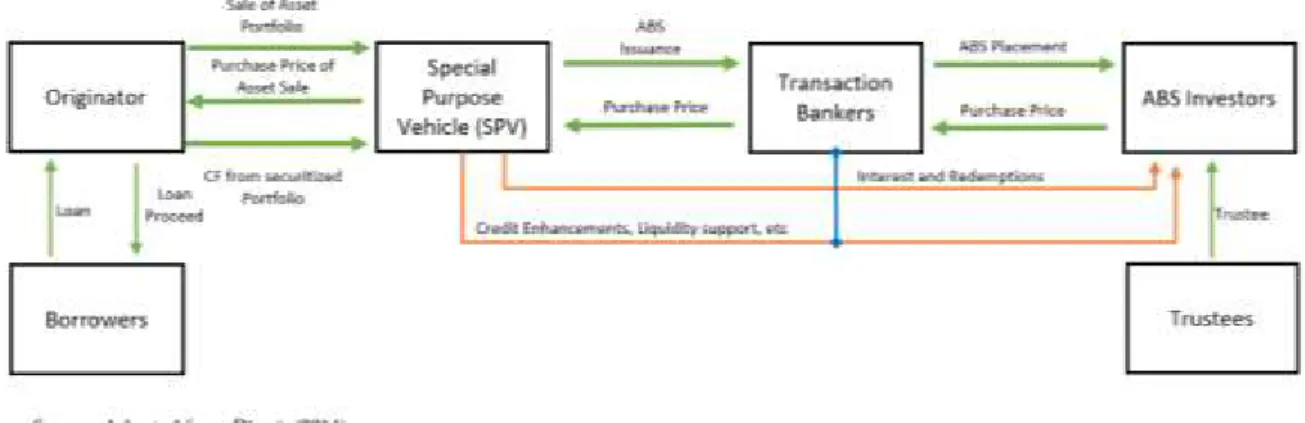
Figure 5 - Assets securitization transaction structure ... 18
Figure 6 - Ten-year government bonds yields in eurozone countries ... 22
Figure 7 - Net issues (flows) of securities other than shares, excluding financial derivatives (Nominal value, Non-financial corporations, € billions) ... 24
Figure 8 - 5-year yields on CSPP-eligible bonds according to rating classification ... 25
Figure 9 – Sovereign CDS premia ... 26
Figure 10 - Spread decomposition from OLS regression analysis ... 27
xiv
List of Tables:
Table 1 - Changes in sovereign bond yields on some major euro area economies
around the APP event dates (basis points) ... 11
Table 2 - Univariate statistics – pricing features associated with SB bonds and CB compared ... 31
Table 3 - Tests of significance for the difference in values among SB and CB issues ... 32
Table 4 - Summary statistics for sovereign bonds yield to maturity across time by issuer country ... 36
Table 5 - Summary statistics for corporate bonds yield to maturity across time by issuer country ... 37
Table 6 - Yield to maturity values during different periods of analysis ... 39
Table 7 - Definition of variables, expected sign, and findings ... 40
Table 8 - Regression analyses of the determinants of yield to maturity ... 44
xvi
Acronyms
ABS - Asset-Backed Securities
ABSPP - Asset-Backed Securities Purchase Programme APF - Asset Purchase Facility
APP - Asset Purchase Program AS - Asset Securitization BOE - Bank of England BOJ – Bank of Japan
BPS – Basis Points (1 BP = 0.01%) ASW - Asset Swap Spread BS - Balance Sheet
CDO - Collateralized Debt Obligations
CSPP - Corporate Sector Purchase Programme CB - Covered Bonds
CBPP - Covered Bond Purchase Program ECB - European Central Bank
EU - European Union
FED - Federal Reserve System GDP - Gross Domestic Product
HIPC - Harmonised Index of Consumer Prices LTROs - Longer-Term Refinancing Operations MCB - Mortgage Covered Bonds
MBS - Mortgage-backed Securities OLS - Ordinary Least Squares
OMTs - Outright Monetary Transactions OTC - Over-The-Counter
PCB - Public Sector Debt-Public Covered Bonds PSPP - Public Sector Purchase Programme
xvii QE - Quantitative Easing
SFSOs - Special-Funds-Supplying Operations SMP - Securities Market programme
SPV - Special Purpose Vehicle S&P - Standard & Poor's UK – United Kingdom US - United States YTM - Yield to Maturity
1
Introduction
Europe has been living in the last ten years various unconventional changes regarding the policies followed by the European Central Bank (ECB). The ECB has been shown to have innovative solutions to shape the bonds yield curves. As a means of doing so, it has used a set of asset purchase programs that directly affect the financing cost of states and corporates in the euro area.
The primary objective of this work is to assess the impact of the ECB´s Asset Purchase Programs (APP) on the cost of financing for eurozone countries and corporates and to analyze whether these programs have reduced the bond yields. This thesis addresses the APP effects in five parts over the literature review. First, it defines the fundamental concepts related to the Quantitative Easing (QE) policies. Then it investigates the needs of using unconventional policies to outline the yield curve. The third part evolves understanding what bond markets will be the aim of purchase by the ECB APP and its effects. On section four the risks and criticisms of the APP are discussed. Finally, it is studied the cost of financing for sovereigns and corporates when the APP was launched and which bond’s characteristics to determining its spreads.
Since this field of study is pioneering in Europe, there is no significant research on this topic. Nevertheless, similar Quantitative Easing (QE) programs were implemented in the US, UK and Japan, which it will be characterized more detailed in the literature review section. Usually, QE is considered an unconventional monetary policy and, as stated by Angelos (2015), “were implemented by the Bank of Japan in 2001, by the Federal Reserve and the Bank of England since 2008”. After a QE program, it can be expected that they stimulate economic activity and raise inflation through various channels [Gambetti and Musso (2017)].
2
To understand the impacts of the affected markets, the contribution of Murphy (2013) will be useful for exploring the concept of covered bonds, which was an important instrument used in most of the programs launched by the ECB. Besides that, it will be analysed the investor concerns about sovereign risk, because in the view of Settlements (2011), higher sovereign risk since late 2009 has pushed up the cost and adversely affected the composition of some euro area bank’s funding, with the extent of the impact mainly in line with the weakening in the creditworthiness of the home sovereign.
Moreover, one of the main authors of this research is Szczerbowicz (2015), that shown in her discussion paper that exceptional liquidity measures (3-year loans to banks and setting the ECB deposit rate to zero) meaningfully reduced persistent money market tensions. Furthermore, shown that asset purchases were the most efficient in sinking the refinancing costs of banks and governments in the presence of high sovereign risk. Finally, another important author is Gazenov (2016), that found that securitized banks tend to be more lucrative institutions, with higher credit risk exposure and despite a more diversified funding structure, they face higher funding costs.
Our results show that the common pricing determinants of the cost of funding differ significantly between covered bonds and corporate bonds. We demonstrate that the sovereign debt crisis had a stronger influence on the cost of financing, namely on SB and CB YTM than the 2007-08 financial crisis. Additionally, we conclude that the asset purchase programmes: CBPP 1 and CBPP 3, contributed to reducing the financing of corporates in the euro zone.
Inversely, the CBPP2 and the CSPP, led to an unexpected increase in the YTM, thus not producing the desirable effects of the monetary policy implemented by ECB.
Furthermore, it was demonstrated that in PIIGS, only CBPP3 had the desired effect of YTM reduction in the CB issues. On the other hand, as in the emissions of German companies, CBPP2 caused an increase in the YTM of CB emissions in
3
PIIGS. Regarding the impact of SB on PIIGS YTMs, it was found that both CBPP1 and CBPP3 had a reducing effect, whereas the CBPP2 and CSPP programs had an adverse effect on what was expected from the ECB, since they led to an increase of the YTM in PIIGS.
Finally, it was concluded that the variables that most affect the CB and SB yields of the PIGS are the risk-free rate and the "tranche to transaction".
The remainder of this paper is organized as follows. Chapter 2 reviews the literature and the research questions are addressed. Methodology and data are presented in chapter 3. Chapter 4 outlines the empirical approach, starting by examining the determinants of YTM for AS and CB issues. Subsequently, the common pricing factors will be presented, following the results of the regression models. Chapter 5 provides robustness tests, to avoid some problems embedded in the regression. Section 6 concludes this study.
4
Chapter 1: Literature review
1.1 Overview
This chapter aims to explore some of the existing literature on this subject. Firstly, it is defined the most relevant concepts regarding unconventional monetary policies, in particular, the Asset Purchase Programmes, a form of Quantitative Easing. Secondly, it is explored how these programs are studied and analyzed by the leading authors.
From 2004 to 2007, the unsecured bonds dominated the market of debt issuance with the expanding of the banking sector. Despite during the 2007-2008 financial crisis, the demand for this bonds reduced sharply, after 2011 the unsecured bonds market “reborn”, when the two ECB’s Longer-Term Refinancing Operations (LTROs)1 were launched, increasing the confidence in
the market (Rixtel et al. 2015).
The introduction of the APP in the short-term was preceded by unfavorable economic conditions such as lower inflation rate and emerged in a period where the households were seeking for savings instead of investment assets (e.g. bonds) [Roediger-schluga et al. (2016)]. This effect triggered a downward on long-term bonds yields. With this deterioration of the economic outlook, the inflation rate was below the ECB objective. Nevertheless, we will see ahead that a successful quantitative easing program should improve macroeconomic conditions, promotes the stability and reduces the corporate defaults [Roediger-schluga et al. (2016)].
1Longer-Term Refinancing Operations (LTROs) is a non-standard monetary policy measure, used by ECB
to provide financing to credit institutions, for periods of up to four years. They usually offer long-term financing to banks in order to facilitate the means of private enterprises and thereby stimulate the economy (European Central Bank, 2016).
5
The final objective of the ECB’s asset purchases programmes was to improve the monetary policy transmission and to restore the standardized credit conditions across the eurozone members [Szczerbowicz (2015)]. The ECB also wanted to decrease the spreads in loans, to ease the funding for banks and companies, to encourage banks on expanding their lending activities and to improve market liquidity [Bertalot et al. (2011)]. When a central bank publicizes the launch of unconventional programs, signals the market the willingness to re-establish the confidence in the economy, and therefore trading opportunities are enhanced since the investors have less afraid of invest [Beirne et al. (2011)].
1.2 Conventional Policies
The eurozone sovereign debt crisis contributed to the sudden increase in risk premia not only for sovereign debt markets but also for money markets and covered bond markets [Szczerbowicz (2015)].
Szczerbowicz (2015) stated that the ECB traditional tool, for example, the interest rates decrease, did not guarantee divergences in the market borrowing costs between member countries. In contrast, the ECB’s unconventional monetary policies contributed meaningfully to soothing financial pressures in the eurozone.
Conventionally, the future interest rates should be determined by the demand and the future inflation through the ECB monetary policy (e.g., Taylor’s rule2)
[Roediger-schluga et al. (2016)]. Nevertheless, we assist that the APP affected directly the future interest rate, increasing them to a level near 2% and therefore produced the desired ECB objectives [Abidi et al. (2017)].
2 John Taylor created Taylor's Rule in 1992, with the objective of making recommendations to the Federal
Reserve about how the interest rates should be in relation to inflation. Lately, this rule has been used to simulate the economic performance of the G-7 countries under different monetary policy rules.
6
The ECB used some traditional policies when implemented several cuts in critical interest rates in the summer of 2007 after the economy faced high financial instability bringing the interest rates down and some experienced negative territory [Gambetti and Musso (2017)].
1.3 Unconventional Policies
After the 2008 crisis, the central banks deeply felt the need to control the economy, efficiently managing its assets and increasing caution in the lending of loans to companies and individuals. In this sense, were created unconventional policies especially to shape the yield curve according to the central bank's needs. On the QE policy carried out by the FED (Federal Reserve System) the target was flattening the yield curve so people could get more easily a long-term loan to buy durable consumer goods, for example, a house or a car.
Szczerbowicz (2015), sustains that the ECB unconventional measures diminish the economy hostile effects such as bank's uncertainty concerning funding liquidity of other market participants and consequently diminish counterparty risk premiums.
In periods of financial difficulties, a central bank may modify the composition of its balance sheet (BS) through the purchasing of securities that are undervalued by financial markets. This policy is sometimes called “credit easing3” [Szczerbowicz (2015)].
Bernanke (2010) points out that when securities are not perfect substitutes, reducing the amount of assets for private investors increases their prices and consequently diminishes the yields by suppressing the risk premia. On the other hand, Roediger-schluga et al. (2016) state that overall the unconventional policies
3 ”Credit Esaing” is a mechanism of changing the asset portfolio composition by the purchase of assets
7
helped to stabilize some sectors of the market, however, they also instigated some risks such as financial stability and risks of losses on the balance sheet as will be discussed later in section 1.4.
1.3.1 Quantitative easing
Central banks may conduct an unconventional monetary policy primarily in response to economic crises to improve the financial wealth of the economy through targeted channels. In this case, central banks can increase the monetary base by buying assets or using lending programs [Fawley and Neely (2013)].
In the QE scope, a central bank creates money and therefore uses to purchase financial assets from private stakeholders such as banks, pension funds and insurance companies [Angelos (2015)]. This program was used by the FED in US (United States) in November 2008 following the 2007-08 global financial crisis to reduce interest rates and consequently to lead business and people to borrow more money. Once they have more money, they spend more, and this process creates new jobs to boost the economy. According to BBC, (2016)4 its effect is
keenly questioned and tough to measure, however, over the last years, the US economy has stabilized, and unemployment has fallen gradually due to the QE program. There have, however, been other cases of launching quantitative easing programs in the world, such as the Bank of Japan (BOJ) in December 2008 where it would lend unlimited amounts to banks at near zero-rates through special-funds-supplying operations (SFSOs). The Bank of England (BOE) also launch a QE program in January 2009 through the Asset Purchase Facility (APF), to buy private sector assets [Fawley and Neely (2013)]. While the FED and the BOE selected vast amounts of assets to buy, the ECB and the BOJ opted to provide
4 BBC “What is quantitative easing,” press release, August 4, 2009, available at
8
loans to ease their monetary [Fawley and Neely (2013)]. These QE policies are of much importance as they allow central banks to respond efficiently to certain market conditions, facilitating credit conditions and creating liquidity.
1.3.2 Asset Purchase Programs
According to the European Central Bank (2016)5, the expanded asset purchase
programs “includes all purchase programmes under which private sector securities and public sector securities are purchased to address the risks of a too prolonged period of low inflation” (below but close to 2% over the medium-term)6. The expanded APP’s is constituted by covered bond purchase
programmes (CBPP1, CBPP2 and CBPP3), asset-backed securities purchase programme (ABSPP), public sector purchase programme (PSPP) and corporate sector purchase programme (CSPP). The programs CBPP1 and CBPP2 were launched in May 2009 and October 2011, respectively. In parallel was launched the securities markets programme (SMP), starting in 2010 with the target of supporting the banking sector. This program would be replaced by outright monetary transactions (OMTs) that allowed the ECB to buy euro area debt in the secondary market if the sovereign meet certain conditions, something that without the SMP would not be possible [Fawley and Neely, (2013)]. In June 2014, the ECB launched a series of long-term refinancing operations (LTROSs) to generate cheap funding to banks such they could support firms borrowing needs. [Altavilla et al. (2015)]. On the other hand, CBPP3, ABSPP, PSPP and CSPP programs belong to the ECB expanded asset purchase program, which was launched on January 22, 2015. Under these programs, a combined amount of
5 European Central Bank, “Asset Purchase Programs,” web site, available at
https://www.ecb.europa.eu/mopo/implement/omt/html/index.en.html
6 European Central Bank, “Asset Purchase Programs,” web site, available at
9
monthly purchases of € 60 billion intended to be carried out until the end of March 2017. In this sense, we still don´t know accurately if these last programs fitted the ECB goals. Nevertheless, Gambetti and Musso (2017) studied two macroeconomic effects of this programme and found that the expanded APP had a substantial impact on GDP (Gross domestic product) and HIPC (Harmonized Index of Consumer Prices), helping the recovery of the economic activity during 2015 and 2016.
Given the target of the APP to address the medium-term risks of price stability, the ECB equalized three main channels of transmission. First, the asset purchases will lead sellers rebalancing their portfolios, and consequently, yields are expected to fall. Once the yields decrease, will cause an increase in the supply of bank lending. The second channel of transmission was denominated by the signaling channel, where the ECB will promote a stable policy for long-run to achieve the desirable price stability. Lastly, the broad credit channel which is related to the effects of asset purchases on the supply of bank lending and lending rates. All these channels are intended to support consumption, investment and setting the inflation on a target level [Gambetti and Musso (2017)].
According to Zaghini (2014), the bank’s funding conditions were affected negatively by the financial crisis in the US associated with subprime mortgage market in the summer of 2007, particularly in some peripheral nations of the euro area due to the general review of risk profiles at both the corporate and sovereign levels. In the same direction, Szczerbowicz (2015) portrayed that the debt crisis triggered a fragmentation of the financial market that resulted in several differences in credit conditions across the eurozone states. In this sense, the Eurosystem’s APP has tried to improve the financing conditions of eurozone banks, companies, and countries. The needs of the eurozone were concentrated in push up the inflation rate and stabilize the economy. Globally, and according to Roediger-schluga, et al. (2016), since the announcement of the APP, good news arrived at the eurozone, which was the reduction of the sovereign yields on
long-10
term bonds across the euro area members. The purpose of the ECB in buying corporate bonds was to reduce long-term bonds yields since they are more sensitive to fluctuations in interest rates and thus riskier. However, the APP carries some adverse effects such as risks mostly related to losses in ECB balance sheet if the assets bought suffer negative fluctuations in their market value.
According to Jobst (2015), the APP strengthened and expanded the size of the ECB balance sheet, helping to support low inflations outcomes risks which are under the ECB price stability objectives.
1.3.2.1 Sovereign bond market
The 2007-2008 financial crisis and the subsequent sovereign debt crisis in Europe increased the default risk in the sovereign bond markets. The market agents started to price the securities in accordance with the high probabilities of sovereign default having in mind the possibility of an EU member abandon the euro area. In consequence, countries suffered from the high refinancing costs and some of them are fearing drastic sanctions, so they are beginning to equate exit from the eurozone [Szczerbowicz (2015)]. These high refinancing costs related to the systemic risk in the euro area could lead to a potential rescue from the government and consequently a deterioration of the public finances. Afterward, the government debt levels may increase, what could result in the downgrade from the leading rating agencies and therefore might increase the bond premium compared to the ten-year German bund [Gerlach et al. (2010)]. It is important to notice that the equity debt ratio is a good proxy for banking risk since banks with a higher equity debt ratio are more prepared to support losses from risky assets, but on the other hand, the investment strategies need to be more careful because there is more interest involved such as shareholders interest.
Going through the fiscal framework, the work of Gerlach et al. (2010) shows that fiscal conditions impact on bond yields. However, since the introduction of
11
the euro currency, this effect is weaker. Moreover, these authors state that the sovereign risk is affected in two ways. Firstly, the government may use public money to act as a lender or recapitalise banks that are targets of bailout programs. Secondly, the reliability of the financial intermediaries’ financial statements should be as transparent as possible to promote the financial stability of the whole economy.
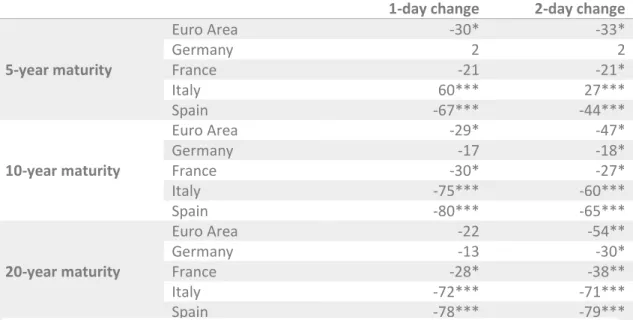
The table 1 reports the effects of the APP on the bond yields of some selected economies, considering maturities of 5, 10 and 20 years. Globally, the results show that the APP significantly reduced the sovereign bond yields in line with the rising of maturities. Considering the 5-years maturity, it can be stated that the yields for Germany and France remain almost unchanged. When considering maturities of 10 or 20 years, the declines are more accentuated, being more expressive on the 2-day change window. Furthermore, it is observed that the reduction had a stronger effect on the Mediterranean countries such as Spain and Italy.
Table 1 - Changes in sovereign bond yields on some major euro area economies around the
APP event dates (basis points)
1-day change 2-day change
5-year maturity Euro Area -30* -33* Germany 2 2 France -21 -21* Italy 60*** 27*** Spain -67*** -44*** 10-year maturity Euro Area -29* -47* Germany -17 -18* France -30* -27* Italy -75*** -60*** Spain -80*** -65*** 20-year maturity Euro Area -22 -54** Germany -13 -30* France -28* -38** Italy -72*** -71*** Spain -78*** -79***
The Public sector purchase programme (PSPP) was created in January 2015 to impact significantly and especially the sovereign bonds yields (Roediger-schluga
Source: ECB and Thomson Reuters
12
et al. 2016). The PSPP amounted to € 893 billion out of the € 1.14 trillion of the APP that comprised maturities between the 2 and 30 years [Altavilla et al. (2015)]. Thanks to this program, the corporate and government debt yields and the forward interest rates decreased while the equity prices increased [Roediger-schluga et al. (2016)].
1.3.2.2 Covered bond market
In order to face the turbulence in the subprime mortgage influenced by reduced incentives for lenders using the securitization process, some policymakers have recommended covered bonds as an alternative for US mortgage markets [Murphy (2013)]. The use of covered bonds is more popular in Europe’s capital markets and, Germany is the biggest market (Bujalance and Ferreira 2010). Nevertheless, it was the US that took the initiative of their use as unconventional monetary policy. European Union (EU) saw this as an opportunity to include in their assets programs purchases since this type of policy was a success in QE policies conducted in the US.
According to Szczerbowicz (2015) “Covered bonds are securities issued by credit institutions to assure their medium and long-term refinancing. They are a pool of loans, typically mortgage loans and public-sector loans that remain on the lender's balance sheet and they are seen as safer than other bank bonds”. CB offer high safety and at the same time provide a higher yield than when compared with government bonds [Liberadzki (2015)].
13
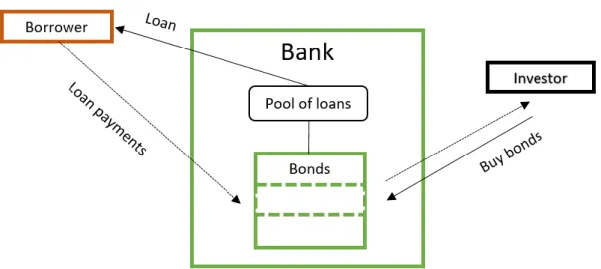
Figure 1 – Covered Bond System
As we can see in Figure 1, the CB holders are protected by the covered pool of collateral, which are usually bonds of high quality that are paid by the borrowers. Typically, the pool of loans is regularly rated by rating agencies and controlled (the quality) by trustees [Kenyon (2009)]. The pool of loans is consequently backed through the bank balance sheet. Additionally, a legal limit is established so that the aggregate nominal value of the CB issue against the pool does not exceed 90% [Bujalance and Ferreira, (2010)]. Kreitzer (2012) shows that Denmark overpowers the covered bond market in Europe and records no default experience even in the times of housing boom. In contrast, the US has the biggest rate of default, followed by Spain and the UK [Kreitzer (2012)].
In an attempt to fund European capital markets, in July 2009, the ECB began a one-year purchase program through CBPP1 of approximately € 60 billion over the 12-month period in covered bonds both primary and secondary markets7 that caused interest-rate spreads8 to narrow [Schwarcz (2011)]. These bonds were
expected to be fully implemented by the end of June 2010 and should be eligible
7 European Central Bank, “Purchase Programme for Covered Bonds,” press release, June 4, 2009, available
at: https://www.ecb.europa.eu/press/pr/date/2009/html/pr090604_1.en.html
8 An interest rate spread on securities is the difference between the interest rate on some securities and the
interest rate on risk-free securities (such as the 10-year German bonds) with similar maturities. The lower the spread, the less riskier is the market. Thus, the narrowing of spreads signals a reduction of risk.
14
for a guarantee to Eurosystem credit operations [(Beirne et al. 2011)]. The investment strategy of the ECB was holding the CB until maturity, so the main risk is primarily default risk. However, there is also market risk if some assets need to be liquidated before maturity [Beirne et al. (2011)].
On December 2014 € 20.9 billion of covered bonds were purchased under the CBPP3. This program raised the average maturities of new issuances and spread it to historic lows [Jobst (2015)].
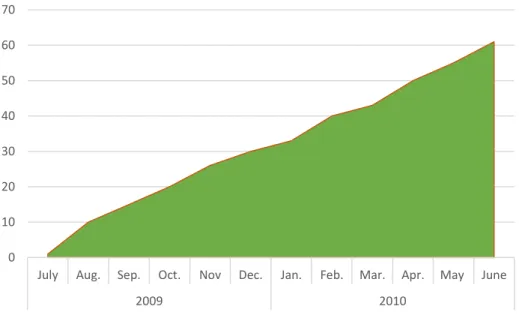
From the figure 2 is possible to see that the amount of total CB purchases in June 2010 ascends to € 60 billion. Overall, between July 2009 and June 2010, there was an increasing rise of the CB emissions eligible for APP.
Figure 2 – Accumulated covered bond purchases by Eurosystem under the CBPP
After the announcement of the CBPP, countries like Greece and Italy saw a significant increase in the number of issuers entered in the covered bond market, and therefore it was recuperated some activity in the eurozone bond market [Beirne et al. (2011)].
Regarding the impact of the first and second covered bond purchase programmes (CBPP1 and CBPP2), the CBPP’s had a diminishing effect on eurozone covered bond yields and subsequently had reduced the spreads (Beirne et al. 2011). Pinto and Correia (2017), found diverse effects: while the first
0 10 20 30 40 50 60 70
July Aug. Sep. Oct. Nov Dec. Jan. Feb. Mar. Apr. May June
2009 2010
15
programme led to lower public sector debt – public covered bonds (PCB) and mortgage covered bonds (MCB) credit spreads, the second programme did not have the ECB desired objectives—it was found a significant positive relationship between the second CBPP and credit spreads for both MCB and PCB. Beirne et al. (2011) found evidence that the covered bond market liquidity has refined and moved closer to pre-crisis levels. This author also argues that the CBPP was efficient in lowering the global funding costs of banks. On the other hand, CBPP did not affect the outstanding amounts of bonds issued by banks but had triggered a substitution effect: uncovered bank bonds were replaced by covered bank bonds [Beirne et al. (2011)].
Figure 3 generates insights about the amount of outstanding covered bonds, which as can be seen, have always been above the uncovered bonds but in periods of turmoil, for example in the 2007-2008 crisis, the gap increased due to a lack of confidence in the markets.
Figure 3- Total amount outstanding of covered and uncovered bank bonds
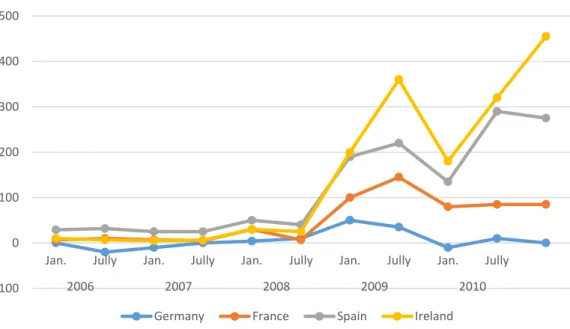
From the figure 4, it is clearly seen that after the announcement of the CBPP in May 2009, there was a decrease of the yields spreads in the eurozone returning to levels observed in 2007 and early 2008. The yields of German covered bonds
0 200 400 600 800 1000 1200 2002 2003 2004 2005 2006 2007 2008 2009
Uncovered bonds Covered Bonds
(in thousands)
16
were around zero in 2010, after the crisis. The most prominent impact was observed in Irish covered bonds’ market, with the highest downward in the figure. These results were consistent with the ECB objectives of increasing the liquidity in the covered bonds’ market.
Figure 4 - Covered bond swap spreads
Kreitzer (2012), found a positive correlation between covered bonds issuance and default rates during the house boosting between 2000 and 2007. In the real estate world, the way the housing system is financed is crucial. While the US mortgages are funded through MBS, European mortgages are financed through covered bonds. This is also why covered bonds play a major role in the asset purchase programme in Europe. It is important to notice that CB and MBS are similar. Nevertheless, one of the remarkable difference is in the risk transfer. While in the MBS, the bank no longer bears the risk because the risk is transferred to an special purpose vehicle (SPV), in CB the bank bears the credit risk of the mortgages [Carbo-Valverde et al. (2013)]. Thus, when banks want to reduce the risk, they opt for MBS. In turn, when banks face liquidity constraints, they prefer CB. Kreitzer (2012), also found that during the 2008 crisis, the countries with larger covered bond markets experienced lowest mortgage default rates.
-100 0 100 200 300 400 500
Jan. Jully Jan. Jully Jan. Jully Jan. Jully Jan. Jully
2006 2007 2008 2009 2010
Germany France Spain Ireland
(in basis points) Source: DataStream and ECB calculations.
17
In addition, while in a purchase of CB, investors are exposed to the credit risk in relation to the issuer, in securitization transactions the buyer is not exposed to credit risks, but only bear the risks associated with the underlying portfolio [Bujalance and Ferreira (2010)].
What makes covered bonds special is the dual recourse feature, since the investor has a recourse against the issuer and against the collateral. However, valuing the cover pool is not forthright [Packer et al. (2007)].
Given the remarkable characteristics of covered bonds, in particular to obtain lower costs of financing, the internationalization of this market has become a reality nowadays. In 2014, almost 30 countries in Europe and other countries such as Australia, New Zealand, South Korean and Singapore had adopted legislation to govern CB [Bertalot (2014)].
1.3.2.3 Asset Securitization
“Economic theory tells us that, by using securitization, a bank may be able to improve its performance through a number of channels, including lower funding costs, improved credit risk management, and enhanced profitability” (Gazenov 2016). Asset Securitization can be view as a differentiated technique for financing and refinancing operations [Dincă (2014)].
Gazenov (2016) in his work state that thought the securitization, a bank could improve its performance transforming its illiquid assets that are traditionally held until maturity into marketable securities by pooling these assets and transferring them to an SPV that, in turn, finance the purchase by issuing securities backed by the pool.
18
In figure 5, it’s represented the AS structure transaction. First, the originators and the SPV play a key role. There is a transference of the assets from the originator to the SPV [Cuchra and Jenkinson (2006)]. Then, the SPV issues debt securities (assets backed) to investors (typically in rated tranches) that will receive a return in function of the exposure. The most senior tranches have the first call against the poll of assets. This transaction characterizes a way that financial institutions may have of shifting the credit risk to investors.
Between the 1990s and 2008, there was a massive increase in the scope of securitization markets [Gazenov (2016)]. Murphy (2013), stated that this increase was partly because this was believed to transfer default risk out of the banking system. After this extended period of quick expansion, securitization markets froze in late 2008, after the collapse of Lehman Brothers [Gazenov (2016)]. Nevertheless, according to Murphy, (2013), securitization is still more popular in the United States that covered bonds.
In banking system, securitization could play a central role. According to Nadauld and Weisbach (2012), banks have a maturity mismatch between assets (e.g. long-term mortgages loans) and liabilities (e.g. short-term deposits) that exposes these institutions to some potential problems when the interest rates suffer thrilling fluctuations [Nadauld and Weisbach (2012)]. In this sense, according to Murphy (2013) securitization “allows banks to sell their long-term
19
assets and thus potentially better cope with the maturity of mortgages and similar assets”.
In the same way for Bonner et al. (2016), securitization was the “engine” of the increase in bank lending before the 2007-2008 crisis but not afterward. This increase was through the risk diversification, shifting the credit risk from issuing loans to investors that want to bear it and over the conversion from liquidity assets to liquid securities. Securitization also allows banks to reduce the capital requirements and consequently to reduce the funding costs [Bonner et al. (2016)].
Schwarcz (2012) shows some advantages of securitization in a way that enabled companies to access its capital needs directly, and in most of the cases, at lower costs than when issues debt. One of the factors that make securitization cost less monetary resources is the well-known “disintermediation” that consists in avoiding intermediaries such as banks.
However, securitization brings also some risks. The main argument is that, since banks are the main investors ABS (asset-backed securities), rather than transferring the risk out of the bank system, this risks are still among banks [Bonner et al. (2016)]. Schwarcz (2012) enumerates five potential flaws including the fact that investors and rating agencies may over-rely on mathematical models to assess the risks of the securities to avoid spending time on the financial statements comprehension. Schwarcz (2012) also states that moral hazard can happen through the originate-to-distribute model of securitization because the lender-originator did not hold its riskiest loans, instead of selling them off (asymmetry of information).
During and after the crisis the investors were remaining become more risk-averse, and therefore the demand for ABS decreased [Bonner et al. (2016)]. Hence, the author found that ABS issuers are more likely to issue CB during and after the crisis.
With the launch of the ABSPP in 2015 through the expanded APP, the ECB intended to absorb part of the existing credit risk related to securitization
20
transactions which facilitated this process among financial institutions and investors.
1.4 Risks and criticisms of the APP
Roediger-schluga et al. (2016) group the risks of the APP in three categories: i) risks to financial stability, ii) factors that limit the effectiveness of the purchase programme and iii) risks of losses on the balance sheet of the ECB. Relatively to the first one they argue that expansionary monetary policy could take financial institutions to engage risky activities and therefore compromise their stability. The second category supports that governments can increase the duration risk through the growth of the outstanding debt for a given level of maturity and therefore expose the investors to this risk. The last category sustains that when ECB engage the purchase of assets, the Eurosystem's banks may face a significant risk on their risky portfolio because, as we will explore later, the assets could suffer devaluations and therefore this could compromise banks solvency (through the BS assets could lose value). Demertzis and Wolff (2016) found some criticisms to the APP such as the programs are ineffective, redundant, and illegal in a monetary union without a common treasury and associated with adverse effects related to the financial stability. They also documented that the APP has reduced the profitability of the banks tightening their margins, so banks are unwilling on investing in new activities what constitutes another risk of the APP.
21
1.5 Cost of funding
1.5.1 Countries’ cost of funding
In recent years, banks from weak9 eurozone areas (Greece, Ireland and
Portugal) have increased its liquidity through the issue of government bonds to collateralize the funding actions [Carney (2011)]. The rating downgrades that these banks suffered since the sovereign crisis make the funding activity costly.
Sovereign tensions in one country tend to contaminate the other countries, and therefore it is imperative that the governments of each country implement strategies to stabilize or reduce the debt levels and also increase the transparency on that levels, so policymakers can accurately evaluate the risks [Carney (2011)]. On the medium-long term, the reduction in government support should be enough to increase market discipline, reduce bailout expectations and reduce the correlation between bank funding costs and sovereign risk [Carney (2011)].
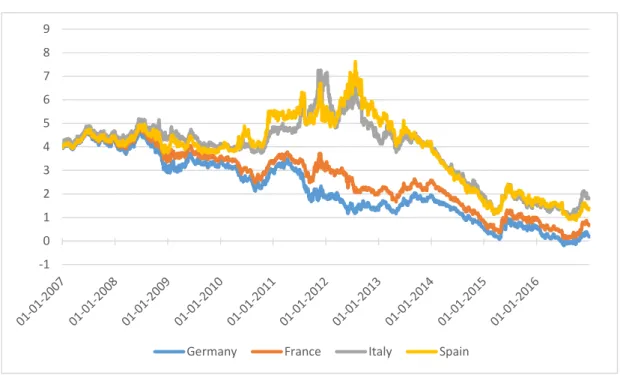
As we can see through the figure 6, the bonds yield started to increase together in the late March of 2007 in all countries presented. This leads us to conclude that the financial crisis (2008-2010) has affected the euro area in a similar way. The same cannot be verified for the sovereign crisis started in 2010, which has affected asymmetrically the eurozone countries. In this case, countries such as Italy and Spain saw its YTMs increasing exponentially witch suffered from high financing costs, given the sovereign risk of collapse. On the other hand, we can see that the sovereign crisis has not affected considerably countries such as Germany and France. These findings also suggest that after the rescue packs came to be known, investors had different expectations about the market, so they start pricing the bonds according to their credit risk.
22
Figure 6 - Ten-year government bonds yields in eurozone countries
Levy and Zaghini (2010), estimate the sovereign creditworthiness measured by sovereign rating and CDS spreads, and they found that “weak banks from strong countries may have access to cheaper funding than strong banks from weak countries”.
Furthermore, the literature has shown that the guaranteed bonds have been successful because it promoted the ability for banks to raise funds by reducing liquidity risks.
Levy and Zaghini (2010), discovered an interesting feature. They found that spreads seem to be related to the nationality of the banks, for example, Portuguese banks such as the old Banco Espírito Santo (rated A) and Caixa Geral de Depósitos (rated A+) pay larger spreads at launching debt than German banks, for example, the Commerzbank (rated A). This outcome is because Germany has a higher rating than Portugal.
In general, it is considered that government bonds are considered almost default-free. However, CB could be regarded as a substitute for government bonds since they hold specific features such as the high quality of their collateral, what drastically reduces their default probabilities [Prokopczuk et al. (2013)].
-1 0 1 2 3 4 5 6 7 8 9
Germany France Italy Spain
23
Roediger-schluga et al. (2016) in their analysis found that the PSPP announcement, in general, led to an improvement in the economic outlook and consequently raised the stocks prices in all sectors of the economy. These improvements were accompanied by an increased demand for credit and therefore led to higher profits of banks [Roediger-schluga et al. 2016)]. When banks face high profits, they are less likely to invest in risky projects because they have more to lose [Demertzis and Wolff, (2016)].
Authors such as Carney (2011), Zähres (2012) studied the impact of QE programs on banks' financing costs.
In this context, Zähres (2012) also studied the underlying impacts of the lack of creditworthiness after the sovereign crisis. Finally, according to Demertzis and Wolff (2016), with the flattening of the yield curve resulting from the ECB strategy in decreasing the long-term sovereign yields, the banks might reduce their profitability because they will transform the short-term deposits in long-term loans.
1.5.3 Corporate funding
The corporates funding conditions are mostly related to the rating associated towards the country where corporations are located. Besides that, factors like size of the balance sheet, historical activity, and rating (if applicable) are central to explain bond spreads. In this sense, Gabbi and Sironi (2002) found that ratings of corporate bonds are the most important factor in determining the spread between the yield to maturity of corporate bonds and its correspondent government bond. They also found that the bond investors are relying increasingly on the rating from the main rating agencies (e.g. Standard & Poor's, Moody’s, and Fitch).
The investors require different premiums to invest in corporate bonds as a function of the quality of the debt. For example, they will demand a higher
24
premium for investing in a junior or subordinated debt than for a senior debt that has priority in an eventual default event.
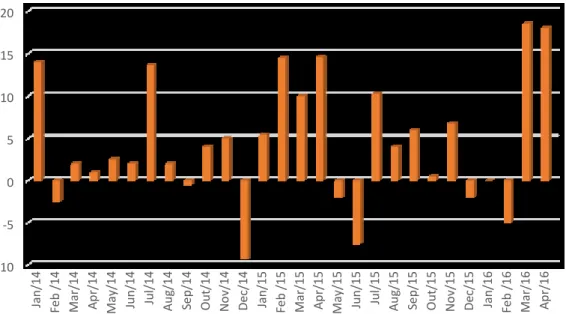
Demertzis and Wolff (2016), found some evidence that the corporate sector has taken advantage of the ECB decision on launching the CSPP. This benefit was materialized by issuing a higher amount of securities by corporates since March 2016 (figure 7). This program is aimed to make it easier for corporates to raise money which they can invest in their business.
Figure 7 - Net issues (flows) of securities other than shares, excluding financial
derivatives (Nominal value, Non-financial corporations, € billions)
Gabbi and Sironi (2002), also found that other features such as the coupon, maturity, trading volume and face value are factors that will be incorporated into bond pricing. Since banks are the most vital source of financing, especially by supporting business, boosting the economy, requires some support to its funding needs by the Eurosystem [Beirne et al. (2011)]. This necessity came across when the ECB announced the CSPP in March 2016, being that only were launched in June 2016 containing monthly purchases ranging between € 4 billion and € 10 billion from June 2016 to May 2017 [European Central Bank (2017). In June 2017, another CSPP was launched as part of the expanded APP with an amount of
-10 -5 0 5 10 15 20 Jan /14 Fe b /14 Mar /14 A p r/14 May/14 Ju n /14 Ju l/14 A u g/14 Se p /14 O u t/14 N o v/14 D ec/14 Jan/15 Fe b /15 Mar /15 A p r/15 May/15 Ju n /15 Ju l/15 A u g/15 Se p /15 O u t/15 N o v/15 De c/15 Jan /16 Fe b /16 Mar /16 A p r/16
25
purchases ascended at €92 billion [(European Central Bank (2017)]. The purchases under CSPP were made both in the primary and secondary market.
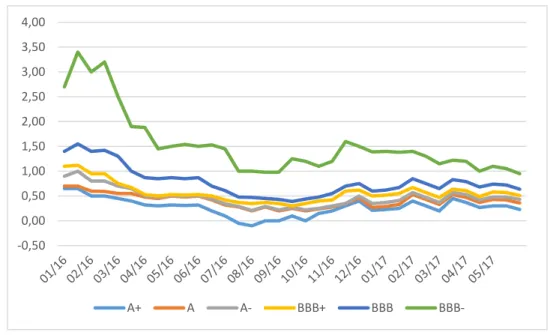
After the announcement of the CSPP, the credit premium decreased reflecting the investor's willingness in buying bonds from lower-rated companies (figure 8). In this way, investors began to rebalance their portfolios, which now include more risky assets [(European Central Bank (2017)].
Figure 8 - 5-year yields on CSPP-eligible bonds according to rating classification
According to European Central Bank (2017) economic bulletin, the financing conditions across euro area have become better, in particular through the fact that the companies with the lowest rating (e.g. BBB-) can issue bonds with smaller premiums.
Considering the effects of the APP on the spreads of non-targeted corporate bonds Altavilla et al. (2015), found that the spreads decreased 20 basis points relative to risk-free rates for euro area financial and non-financial companies.
1.6 Spread Determinants
Zaghini (2014) shows that bond premium reflects the characteristics of each institution (trustworthiness and solvency). In this sense, the author founds that
-0,50 0,00 0,50 1,00 1,50 2,00 2,50 3,00 3,50 4,00 A+ A A- BBB+ BBB
26
the larger the magnitude of the balance sheet, the lower the premium paid on bonds’ issuance.
Since late 2009, banks from southern Europe such as banks from Portugal, Greece and Ireland found it difficult to raise debt at a reasonable cost as we can see from the figure 9, where these countries face high CDS premia. The weak balance sheets, the sovereign risk associated with the decrease of the collateral banks can use to have liquidity, and the sovereign downgrades from the main rating agencies10 make the funding very costly [Carney (2011)].
Figure 9 – Sovereign CDS premia
The risk premium on bank bonds is founded on two core sources of influence according to Zaghini (2014): the characteristics of the issuer, and the features of the bonds itself. Hu and Cantor (2005) compare AS with CB credit spreads, and document relatively higher credit spreads for AS bonds. In the same sense, (Marques et al. 2016), verifies using a sample of AS and corporate bonds closed between 2000 and 2011, that AS bonds have lower credit spreads than corporate bonds [Pinto and Correia 2017)].
Through the figure 10, it is verified that the spread decomposition described by Levy and Zaghini (2010), in his OLS estimation. They found that the amount of spread reduction depends more on country-specific factors namely on
10Considering that the main rating agencies are: Standard & Poor's, Moody's, and Fitch.
0 200 400 600 800 1000 1200 1400 1600 1800 . 2009 2010 2011
France Germany Spain Italy Portugal Ireland Greece
27
sovereign CDS and government rating than on bank-specific factors. Furthermore, on country-specific factors, the government rating seems to be the most influent on spread reduction.
Moreover, Flannery et al. (2012) found that factors like credit rating, maturity, liquidity, systematic risk and taxes are important determinants of corporate bond credit spreads.
0 20 40 60 80 100 120 140
Low Sovereign CDS Goverment rating is AAA Low commitment on all bank… Large absolute amount of bond… Timeliness of reimbursement
Low CDS spread Large issuance volume Short bond maturity Favourable market conditions
Ammount in spread reduction if:
Country-specific factors Issue-specific factors Bank-specific factors
Source: Adapted from Levy and Zaghini, (2010)
28
Chapter 2: Research Questions and
Methodology
2.1 Research Questions
Based on the theoretical and empirical literature discussed in chapter 1, we raised the following research question: "Have the ECB's asset purchase programs reduced significantly the euro area countries and corporates cost of funding?" (Q.1)
Based on this major question, we also raised following questions:
• Which programs have had more impact on reducing financing costs from both sovereigns and corporates? (Q.2)
• What was the impact of ECB’s APP on the SB and CB yield to maturity of PIIGS (Portugal, Ireland, Italy, Greece and Spain)? (Q.3)
In order to answer these questions, a sample of bonds issued in the 2000-2016 period by countries and corporates from all the eurozone economies were used.
All these research questions seek to add value to a recent thematic (Eurosystem's APP), with only almost nine years since its first publication in May 2009.As the effects are recent, it is necessary to generate a solid knowledge in this field. Thus, this study is considered a significant contribution to literature research in this specific area, since it is imperative to know if these programs should be used in the economy because they involve a huge investment for the ECB and has several effects that we are going to realize later on.
2.2 Methodology
In order to empirically assess the impact of ECB quantitative easing policy on the cost of funding for firms and countries, it will be used a statistical and
29
econometric analysis of the cost of funding (yield to maturity) by these two entities when issuing bonds on the primary market in the 2000-2016 period.
Bonds’ data was extracted from DCM Analytics database, provided by Dealogic, - a well-known financial markets platform. However, other relevant sources of information were used such as Eurosystem’s data (e.g. bulletins, reports), Eurostat, Bloomberg, OECD and Eikon financial analysis to support the thesis with relevant tables and figures. Lastly, to obtain data about the macroeconomic expectations we rely on one source of information: the ECB Survey of Professional Forecasters (SPF). This is a quarterly survey of the rates of inflation, real GDP (Gross Domestic Product) growth and the unemployment rate in eurozone conducted by experts in financial markets.
In this work, we use the yield to maturity (YTM of the bond at issue) as our independent variable. On the other hand, the explanatory variables are microeconomic characteristics (e.g., tranche size, transaction size, maturity and the number of banks) and macroeconomic characteristics (e.g., market volatility, crisis and country risk).
The research method used will be exclusively quantitative, in particular, an econometric analysis will be used to understand the impact of the various measures (microeconomics and macroeconomics) on the bond yields. For this, a linear regression will be employed using Ordinary Least Squares (OLS), which, according to Craven and Islam (2011), is a “generalized linear modeling technique that may be used to model a single response variable which has been recorded on at least an interval scale”, assuming the following assumptions: linearity, strict exogeneity, lack of multicollinearity and non-spherical error terms [Williams et al. (2013)]. Possible endogeneity problems will be solved with the estimation of a fixed effects model.
30
Chapter 3: Sample Selection and
descriptive statistics
3.1 Sample Selection
As mentioned earlier, data on bonds was extracted, provided by Dealogic. From this database, we obtained detailed historical information ranging between January 1, 2000, and December 31, 2016, about the bond pricing characteristics (e.g. currency, maturity, and rating) and information about the issuers (e.g. nationality and sector). Since the database includes information on various deal-types, we will only include those that are sovereign bonds (SB) and corporate bonds (CB).
After applying several screens, we collect historical data (2000-2016) from the sovereign and corporate bond issued in all eurozone countries. We include bonds in the DCM Analytics database with a deal-type code of "sovereign bond" and "corporate bonds". In addition, it was excluded from sample bond issues which have a type code of "Non-EU Agency", and bonds with caps, floors and options. Bond tranches classified either with fixed-rate bonds (with coupon rate information) or variable rate bonds (with both spread and index information) were included. Indeed, were examined a sample of 23.283 observations that are divided into two categories: 9.053 of sovereign bonds and 14.830 of corporate bonds, issued by eurozone states and companies, from 19 different countries.
3.2 Univariate Analysis
In the univariate analysis, we examine continuous and dummy variables associated with sovereign and corporate bonds characteristics with the purpose of providing information about their pricing characteristics. Table 2 provides the summary statistics for the full sample of SB and CB, while table 3 provides
31
Wilcoxon rank-sum test for continuous variables and a Fisher's exact test for dummy variables.
Table 2 - Univariate statistics – pricing features associated with SB bonds and CB compared
Variable of interest Type of bond issue Variable of interest Type of bond issue
SB CB SB CB
Continuous variables
Yield to maturity (bps) Tranche to transaction
(%)
Number 9,056 14,831 Number 11,403 28,557 Mean 315.0 441.4 Mean 98.8% 66.4% Median 322.0 420.7 Median 100.0% 100.0% Std. Dev. 196.5 242.1 Std. Dev. 8.8% 42.8%
Transaction size (€ million) Number of banks Number 11,403 28,557 Number 11,403 28,553 Mean 1,306.1 2,147.5 Mean 1.9 3.2 Median 611.0 400.0 Median 1.0 2 Std. Dev. 1,626.5 7,555.6 Std. Dev. 2.8 3.5
Tranche size (€ million) Number of tranches Number 11,403 28,557 Number 11,403 28,557 Mean 1,282.0 304.1 Mean 1.0 16.3 Median 600.0 103.2 Median 1.0 1.0 Std. Dev. 1,608.1 463.2 Std. Dev. 0.2 32.6
Credit rating [1-22 weak] Country risk [1-22
weak] Number 10,845 22,459 Number 11,403 28,557 Mean 3.1 5.5 Mean 2.9 1.8 Median 2.0 5.0 Median 1.0 1.0 Std. Dev. 2.6 3.1 Std. Dev. 2.9 2.0
Time to maturity (years) Management fee (bps) Number 11,400 28,543 Number 362 2,395 Mean 9.1 6,2 Mean 13.5 22.7 Median 6.5 5,0 Median 10.0 22.5 Std. Dev. 8.2 6,6 Std. Dev. 10.0 18.6
Dummy variables
Fixed rate Currency risk N, of issues with data
available 11,403 28,557
N, of issues with data
available 11,403 28,557 N, of issues with dummy=1
9,521 22,948 N, of issues with
dummy=1 678 9,942 % of total available data
83.5% 80.4% % of total available
data 5.9% 34.8%
U, K, borrowers Callable N, of issues with data
available 11,403 28,557
N, of issues with data
available 11,403 28,557 N, of issues with dummy=1
653 4,672 N, of issues with
32
% of total available data
5.7% 16.4% % of total available
data 1.1% 14.2%
Table 3 - Tests of significance for the difference in values among SB and CB issues Variable of interest
Type of bond issue SB vs CB
Continuous variables: Wilcoxon rank-sum z-test
Yield to maturity (bps) -41.26
Credit rating [1-22 weak] -75.00
Time to maturity (years) 43.09
Tranche to transaction (%) 75.61
Country risk [1-22 weak] 42.85
Transaction size (€ million) 16.55
Tranche size (€ million) 65.72
Number of tranches -75.73
Number of banks -57.66
Management fees (bps) -12.75
Dummy variables: Fisher's exact test (p-values)
Fixed rate 0.00
Currency risk 0.00
U.K. borrowers 0.00
Callable 0.00
According to Forbes et al. (2008) “Yield to Maturity is the single discount rate that, when applied to all future interest and principal payments, produces a present value equal to the purchase price of the security.” Regarding the relative pricing of SB versus CB issues, tables 2 and 3 show that the average yield to maturity is economically and statistically higher for CB bonds (420.7 bps) than they are for SB (322 bps) at the 5% significance level. However, this analysis does not allow us to identify other factors that are unknown and affect yield to maturity. We follow this analysis now looking at the credit rating.
This table reports summary statistics for a sample of sovereign bonds (SB) and corporates bonds (CB) issues closed between January 1, 2000 and December 31, 2016. Information on SB and CB issues was obtained from DCM Analytics. For a definition of the variables, see Table 7.
Notes: Was performed a Wilcoxon rank-sum test for continuous variables and a Fisher's exact test for dummy variables. These tests compare the value of each variable in SB bonds sample, with the corresponding values in the CB sample. The signal # indicates that the common pricing variables do not differ significantly between the two security classes at the 5% significance level. The signal * indicates that the proportion of tranches for which dummy = 1 does not differ significantly between the two security classes.
33
Credit rating, as reported by Hu and Cantor (2005) is one of the most determinants of spreads. In this sense, we followed the rating scale used in (Vink and Thibeault 2008) that consists of 21 rating scales from three rating agencies: Fitch, Moody’s, and Standard and Poor’s (See figure 12). This variable is constructed using a set of twenty credit-rating dummy variables that correspond to the credit rating of the issue - CR=1, CR=2, CR=3, CR=4, CR=5, CR=6, ..., CR=20, that correspond to credit rating: Aaa/AAA, Aa1/AA+, Aa2/AA, Aa3/AA-, A1/A+, A2/A, ..., B2/B. Country risk is the S&P's country credit rating at the closing date, and is converted as follows: AAA=1, AA+=2, and so on until D=22. In line with Rixtel et al. (2016), country risk characteristics become more important drivers in bonds issuance during crisis periods, suggesting a significant and negative sign for the sovereign CDS spread.
The average number of banks participating in CB transaction (3.2 bps) is significantly higher than for SB transaction (1.9 bps). Moreover, the level of management fees is strictly higher for CB (22.7 bps) than for SB (13.5 bps), which means that CB is riskier.
While the average tranche size is considerably higher for SB (€ 1,282.0 million) than for CB (€ 304.1 million), the transaction size is higher for CB (€ 2,147.5 million) than for SB (€ 1,306.1 million).
Dealing with the remaining variables, it was possible to verify, for example, that UK Borrowers only represent 5.7 % of the SB issues, while records 16.4% for CB issues.
The average tranche to transaction ratio for SB (98.8%) is relatively higher than for CB (66.4%), which leads us to think that CB may benefit from tranching a larger degree and SB may have just one tranche per transaction only. Looking now at bond maturities, it was found that SB market (9.1 years) shows maturities significantly higher than in CB market (6.2 years).
We obverse that a higher proportion of SB (83.5%) are issued with fixed rates than that for CB (80.4%). Nevertheless, in accordance with Vink and Thibeault
34
(2008), floating-rate issues tend to offer more flexibility due to the prepaid options embedded in mortgage loans, which allows the borrowers of the loans to prepay the notional before maturity. Currency risk is the financial risk of an investment value change due to changes in currency interest rate. Relatively to this risk, we observe that merely a small percentage of SB (5.9%) shown currency risk, which reveals the importance of euro-denominated SB market. On the other hand, we recognize a higher value for CB (34.8%) Lastly, the variable callable presents a higher percentage for CB (14.2 %) than for SB market, which means that the call options are more used in the CB market, that usually present more complex derivative instruments.
Summarily, we find that the common pricing characteristics vary widely across SB and CB issues. Table 3 indicates that all variables shown statistically significant differences in value. Relatively to the main differences, we documented that: (i) the YTM is statistically higher for CB than for SB; (ii) CB are riskier than SB due to the higher management fees; (iii) the transaction size is greater in CB than in SB, however; (iv) CB are issued with a significantly lower number of tranches; (v) the average maturities are longer in SB, nonetheless are less likely to be arranged for U.K. Borrowers as in the case of CB; and (vi) SB issues are more likely to be fixed rate instead of floating rate than CB.
Later on, in section 4.4, we will explore the bond pricing factors through an OLS estimation.