E
NERGY AND
E
NVIRONMENT
Volume 4, Issue 4, 2013 pp.663-676
Journal homepage: www.IJEE.IEEFoundation.org
Modelling the drying kinetics of green peas in a solar dryer
and under open sun
Sunil
1, Varun
2, Naveen Sharma
31 Department of Mechanical Engineering, BRCM CET Bahal, Haryana–127028, India
2 Department of Mechanical Engineering, NIT Hamirpur, (H.P.)–177005, India
3 Department of Mechanical and Industrial Engineering, IITR, (U.K.)–247667, India
Abstract
The drying kinetics of green peas was investigated in an indirect solar dryer and under open sun. The entire drying process took place exclusively in falling rate period. The constant rate period was absent from the drying curves. The rehydration capacity was also determined for peas dried in solar dryer and under open sun. The rehydration capacity of solar dried peas was found higher than open sun dried peas. The drying data obtained from experiments were fitted to eight different mathematical models. The performance of these models was examined by comparing the coefficient of correlation (R2), sum of squares error (SSE), mean squared error (MSE) and root mean square error (RMSE) between observed and predicted values of moisture ratios. Among these models, the thin layer drying model developed by Page showed good agreement with the data obtained from experiments for bottom tray. The Midilli et al. model has shown better fit to the experimental data for top tray and open sun than other models.
Copyright © 2013 International Energy and Environment Foundation - All rights reserved.
Keywords: Green peas; Modelling; Solar drying; Rehydration capacity; Sun drying.
1. Introduction
developed for a particular product. Indirect type of solar crop dryers is well recognized and it overcomes the inherent problems of open sun dryers and cabinet dryers [4]. Solar energy has found vast application in solar thermal systems [5-10], solar drying is particularly one of them that used mostly in developing countries [11]. The proper design of solar dryers not only fulfills particular drying needs but also augments energy efficiency. Solar dryers of various types find applicability all over India because of its high insolation and abundant sunshine duration. Drying of agricultural product is one of the important post harvest processes and it has sufficient ability to diminish the post harvest losses to a large extent. Drying can also prevent spoilage of the product in storage significantly. A good drying technique can enhance the quality of the product drastically [12].
The most vital facet of food drying technique is the mathematical modeling of drying processes and apparatus. The purpose of mathematical modelling is to permit designers to opt for the most suitable operating conditions and then dimension the drying apparatus consequently to meet desired operating conditions. The theory of mathematical modelling is based on having a set of mathematical equations that can satisfactorily portray the drying system. All factors used by simulation models are related to the drying conditions directly. The solution of these mathematical equations must permit forecasting of the process parameters as a function of time at any point in the drying system based only on the initial conditions [13]. Simulation models are required in the designs and operations of solar dryers. Several researchers have developed simulation models for natural and forced convection solar drying systems [2, 14-16].
Recently, there have been limited studies on drying of green peas using different drying techniques. Shanmugam and Natarajan [17] investigated the performances of an indirect forced convection and desiccant integrated solar dryer by drying green peas and pineapple slices with and without the reflective mirror. Jadhav et al. [18] carried out study on solar cabinet drying of pretreated green peas and used response surface methodology to optimize the pretreatment prior to solar cabinet drying. The authors also compared solar cabinet drying method with other drying techniques like freeze drying, fluidized bed drying and open sun drying. Doymaz and Kocayigit [19] examined the drying behaviour of pretreated green peas in convection dryer for a temperature range of 55–70°C with a constant air velocity of 2.1m/s. The logarithmic and Page models were best in representing green pea drying. Momenzadeh et al. [20] applied artificial neural network for drying time prediction of green pea in a microwave assisted fluidized bed dryer. There is no information on solar drying of untreated green peas using indirect natural convection solar dryer in literature to the best of the author’s knowledge. Moreover, studies on thin layer drying of green peas are scarce in literature.
The main objectives of this study are to:
1. Study and compare the thin layer drying characteristics of green peas in the new developed solar dryer and under open sun.
2. Develop the mathematical modeling for describing solar and sun drying process of green peas. 3. Compare rehydration capacity of solar dried and open sun dried green peas.
2. Experimental set-up
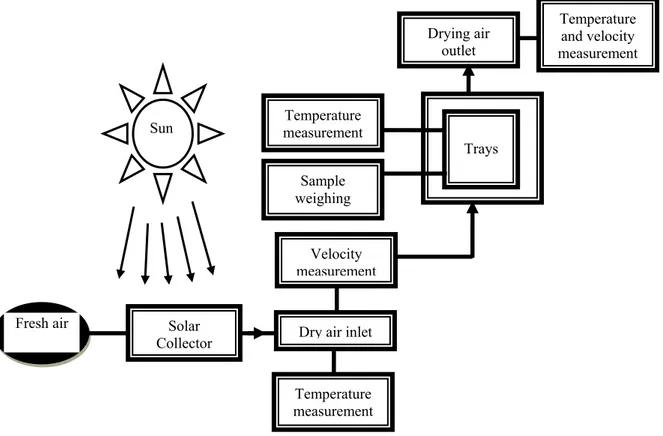
The experimental set-up consists of an indirect natural convection solar dryerwith a flat plate solar air collector, drying chamber and two drying trays. The schematic diagram of the experimental set-up is shown in Figure 1. The details of solar air collector are given in Table 1. A 0.5 mm thick aluminium sheet painted with dull black paint was used as an absorber plate to absorb incident solar radiation. The solar air collector was oriented southward at an angle of 32° with the horizontal. Two clear window glasses having thickness 4 mm were used as a transparent cover for the air collector to prevent the top heat losses. The frame of the collector was made from 19 mm thick plywood. For insulation polystyrene was used below absorber plate and along sides of the collector box.
Figure 1. Schematic diagram of experimental set-up
Table 1. Details of solar collector assembly
S. No. Parameters Value
a Collector Area (Ac) 0.60 m2
b Length 1.2 m
c Width 0.5 m
d Absorber plate 0.5 mm Aluminium Sheet
e Surface treatment Black paint coating
f Glazing Normal window glass of thickness 4mm
g No. of glazing Two
h Back insulation Polystyrene of thickness 4 cm
i Casing Made of plywood
j Collector slope (β) 32° (latitude)
k Airflow area (at inlet and outlet) 0.02 m2 and 0.0038 m2
l Distance between glazing 10 mm
m Distance between cover and absorber plate 40 mm
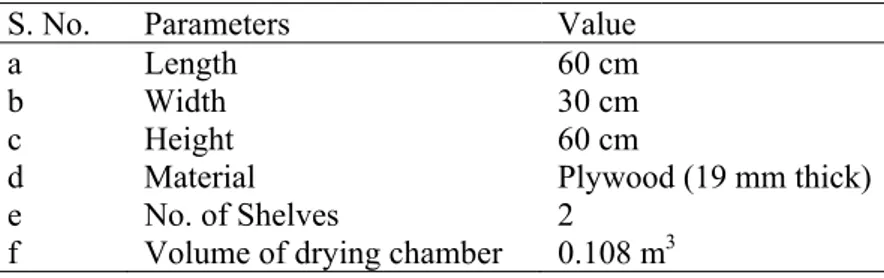
Table 2. Details of drying chamber
S. No. Parameters Value
a Length 60 cm
b Width 30 cm
c Height 60 cm
d Material Plywood (19 mm thick)
e No. of Shelves 2
3. Materials and methods
3.1 Material
The fresh green pea pods were procured from the local market of Hamirpur. The samples were kept at ambient condition for 2 h before experiments so that the green peas reach room temperature. Damaged, undeveloped and dry pods were removed manually by visual inspection. The pods were depodded manually and peas were used for further experiments. About 400 g of green peas were weighed and uniformly spread into two trays (200 g in each tray) and kept inside the dryer. In order to compare with open sun drying, same quantity of green peas was kept in open tray under the sun at the same time. The initial moisture content was determined by vacuum oven method [21] at 70°C for 24 h. No pretreatment was given to the green peas. The initial moisture content of the green peas was found about 73% on wet basis.
3.2 Experimental procedure
An indirect natural convection solar dryer was used in experimentation. The solar drying experiments were performed during the period of March, 2012 at National Institute of Technology Hamirpur, Himachal Pradesh, India. The experiments were carried out outdoors for drying of green peas. The green peas were weighed before keeping inside the drying chamber. Three samples were prepared each weighing 200 g. The peas from two samples were spread evenly in thin layers on both the drying trays (i.e. bottom tray and top tray). The third sample was spread under open sun in open tray in order to compare solar drying with natural sun drying. The air entered into the drying chamber from the bottom and escaped from the duct provided at the rear side near top of the drying chamber after taking the moisture from the product kept inside the drying chamber. Each experiment started at 10:00 a.m. and continued until 5:00 p.m. Before starting the experiment all the instruments were properly checked for their proper functioning. After that the system was run for at least half an hour to reach steady state conditions for the operation temperatures. The weight of the samples was taken every hour in order to determine moisture loss. Drying was continued until no further changes in their mass were observed. The trays were exchanged from bottom to top and vice versa after 2-3 hours of drying to achieve uniformity in drying. The flow chart of the drying process has been shown in Figure 2.
Figure 2. Flow chart of drying process
Dry air inlet
Temperature measurement Velocity measurement
Fresh air Solar
Collector
Sample weighing Temperature measurement
Trays Drying air
outlet
Temperature and velocity measurement
3.3 Instruments used
The ambient and drying air temperatures inside the drying chamber, at the inlet and outlet of the solar air collector and the mean plate temperature of the absorber plate were measured with the help of calibrated copper-constantan thermocouples connected to a digital multimeter through a 30 channel selector switch with an accuracy of ± 1%.
The incident solar radiation was measured by using a pyranometer Kipp and Zonen Solys 2. Pyranometer is an instrument which measures either global or diffuse radiation falling on a horizontal surface over a hemispherical field of view. This device is composed of one thermopile and a numerical integrator allowing the reading of instantaneous fluxes by digital display. The relative error measurement is about ± 2%.
The air velocity was measured by using a portable digital thermo anemometer Model KM-909. It is capable of measuring air velocities up to 30 m/s. The rotor blades were simply put in the direction of air flow and corresponding velocity was indicated by the indicator directly in m/s. The range of thermo anemometer for measuring air velocity is from 0.0 to 30.0 m/s with a resolution of 0.01 m/s.
The relative humidity of ambient air and drying air has been measured periodically by thermo hygrometer (ebro make, model TFH 620, accuracy ±2%). It has a range of 0 to 100% of relative humidity and corresponding provision of measuring temperature in the range of 0-60 °C.
The moisture content in the dried materials has been determined using the weight loss method. For measuring the weight loss of the sample, digital display electronic balance has been used. The capacity of the electronic balance is 210 g and accuracy is 0.0001 g.
4. Mathematical modelling of drying behavior
The moisture ratio during drying experiments was obtained by using the following equation:
e i
e t
M M
M M MR
− − =
(1)
However, the moisture ratio (MR) was simplified to Mt/Mi instead of (Mt - Me) / (Mi - Me) because of the relative humidity of the drying air continuously fluctuated during open sun and solar drying processes [16]. Hence, moisture ratio was calculated as:
i t
M M MR=
(2)
The drying rate (DR) of the products during drying experiments was calculated using the following equation:
dt M M
DR= t− t+dt
(3)
Rehydration capacity of dried peas was calculated in distilled water at 25±1°C by submerging about 2±0.3 g dried products in glass beakers containing water in the ratio 1:50 (w/w) [19]. The weight of the sample was measured every hour for 8 h. The rehydration capacity (RC) was calculated as follows:
W W RC
d r =
(4)
and lower the values of the SSE, MSE and RMSE, the better the goodness of the fit [23-25]. These parameters can be calculated as following:
Table 3. Mathematical models applied to drying curves
Model No. Model name Model equation References
1 Newton MR=exp(−kt) Sarsavadia et al. [26]
2 Page MR=exp(−ktn) Diamante and Munro [22]
3 Modified Page MR=exp[(−kt)n] Yaldiz et al. [27]
4 Henderson and Pabis MR=aexp(−kt) Chninman [28]
5 Logaritmic MR=aexp(−kt)+c Yaldiz and Ertekin [29]
6 Wang and Singh 2
0 at bt
a
MR= + + Wang and Singh [30]
7 Verma et al. MR=aexp(−kt)+(1−a)exp(−gt) Togrul and Pehlivan [31]
8 Midilli et al. MR =aexp( −ktn)+bt Midilli et al. [32]
4.1 Correlation coefficient (R2)
The correlation coefficient, R2 can be used to test the linear relation between measured and estimated values, which can be calculated from the equation given below:
] ) MR MR ( [ ] ) MR MR ( [ MR MR ( ) MR MR ( R 2 i exp, i N 1 i 2 i , pre i N 1 i ) i exp, i N 1 i i , pre i N 1 i 2 − ∑ × − ∑ − ∑ × − ∑ = = = = = (5)
where R2 is called the coefficient of determination, MRi is the ith moisture ratio, MRexp,i stands for the experimental moisture ratio found in any measurement, MRpre,i is the predicted moisture ratio for this measurement and N is the total number of observations.
4.2 Sum of squares error (SSE)
The sum of squares error may be calculated as:
z N ) MR MR ( SSE 2 i, pre i exp, N 1 i − − ∑ = = (6)
where, z is the number of constants. The lower the values of SSE, better is the goodness of fit [33].
4.3 Mean squared error (MSE)
The mean square error is given as:
2 i exp, i , pre N 1
i (MR MR )
N 1
MSE= ∑= −
(7)
The MSE calculates the average of the squares of the errors. The MSE is the second moment (about the origin) of the error, and thus includes both the variance of the estimator and its bias [34]. Smaller the MSE better the model result. The ideal value of MSE is zero.
4.4 Root mean square error (RMSE)
The root mean square error may be computed from the following equation:
2 / 1 2 i exp, i , pre N 1
i (MR MR ) ]
N 1 [
RMSE= ∑= −
which provides information on the short term performance. The value of RMSE is always positive, represented as zero in the ideal case. It provides a measure of squared deviations. The error occurs because of randomness.
5. Results and discussion
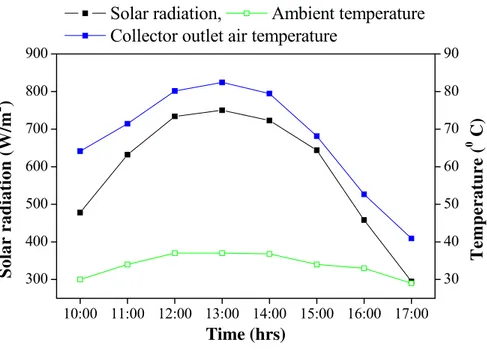
The variation of solar radiation, ambient temperature and collector outlet air temperature during the day for experimental run is shown in Figure 3. The solar intensity during drying was in the range of 295-750 W/m2. The ambient temperature and relative humidity of air were 29-38°C and 22-32 % respectively. The drying air temperature at collector outlet varied from 40.93 to 82°C during the day (March month). Air temperature increased during morning to noon and decreased during afternoon corresponding to increase or decrease in the solar intensity. The solar intensity was maximum at noon and minimum at evening in the day of experiment.
10:00 11:00 12:00 13:00 14:00 15:00 16:00 17:00 300
400 500 600 700 800 900
Solar radiation,
Ambient temperature
Collector outlet air temperature
Time (hrs)
So
lar radiat
ion (W
/m
2
)
30 40 50 60 70 80 90
Tempera
ture (
0
C)
Figure 3. Variation of solar radiation, ambient temperature and collector outlet air temperature with time of day (March month) for experimental run during drying of green peas
The initial moisture content of fresh green peas was about 73% (wb). The green peas in solar dryer were dried to final moisture content in 8-9 h while it took 14 h in open sun drying for the same weight (200 g). The drying in solar dryer was faster as compared to open sun because the temperatures of drying air inside the drying chamber were higher as compared to ambient temperature. The moisture content of the dried green peas was in the range of 1.1 – 4.3% (wb). The variation of moisture content of green peas in both drying trays and under open sun with drying time is shown in Figure 4.
From Figure 4, it can be seen that the moisture content of the green peas decreases exponentially with drying time. The drying of green peas occurs only in the falling rate period and the rate of moisture removal is limited by the diffusion in the product. At the start of drying process, the rate of moisture removal is very high and decreases as the drying proceeds. This is in conformity with the trend obtained by earlier researchers [17, 35]. The reduction in moisture content in bottom tray was faster as compared to top tray. This is because the hot air entered from the bottom of the drying chamber which came in contact with the bottom tray first and then with the top tray.
0 5 10 15 20 25 30 35 0
20 40 60 80
Moi
st
u
re
co
nt
en
t (
w
b
) (
%
)
Time (hrs)
Top tray Bottom tray Open sun
Figure 4. Variation of moisture content with drying time for green peas under different drying conditions
0 5 10 15 20 25 30 0.0
0.1 0.2 0.3 0.4 0.5 0.6 0.7
Dr
y
ing
r
a
te
(g
wa
te
r
/g
wet m
a
tter
.m
in)
Time (hrs)
Top tray Bottom tray Open sun
Figure 5. Variation of drying rate with drying time in top tray, bottom tray and under open sun for green peas
5.1 Rehydration attributes
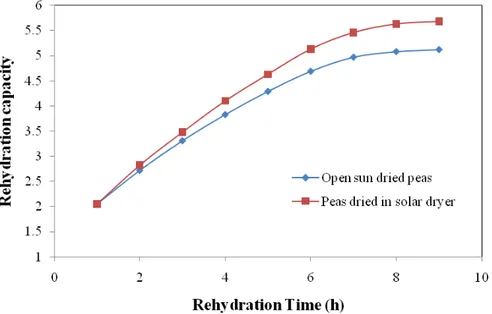
The rehydration capacity of dried green peas was calculated by using Eq. (4). Rehydration is one of the important properties used to assess the quality of dried food products. It can also be considered as a measure of the harm caused by drying. The internal structure of the product will crumple due to poor rehydration capacity [19]. Figure 6 shows the difference in rehydration capacity of solar dried and open sun dried green peas with rehydration time. It was found that the rehydration capacity of the green peas dried in solar dryer was higher than the peas dried under open sun. This is due to the fact that the rate of moisture removal for solar dried peas is very fast and causes less shrinkage of the dried peas. The solar dried green peas regained their shape in less time as compared to open sun dried green peas.
5.2 Mathematical modelling of solar and open sun drying curves
computer program to obtain the values of drying constants and coefficients of these thin layer drying models. Page model [22] was the best explanatory model for bottom tray inside the solar dryer while for top tray inside the solar dryer and open sun drying samples Midilli et al. [32] model was found to give the best fit the drying curves. Variations of experimental and predicted moisture ratio values with drying time have been shown in Figure 7, which shows the moisture ratio values predicted by Page model [22] and Midilli et al. [32] model compared with the experimentally obtained moisture ratio values. It is observed that moisture ratio decreases continuously with drying time. These results are in conformity with the observations available in literature [19]. Figure 7 shows good agreement between experimental and predicted values of moisture ratio.
Figure 6. Rehydration capacity of green peas
Figure 7. Variation of experimental and predicted moisture ratio (for bottom tray by Page [22] and for top and open sun by Midilli et al. [32]) with time during drying of green peas
The results of statistical analysis carried out on these eight thin layer drying models are given in Tables 4-6.
7. Based on the regression analysis, the accepted model constants and coefficients were bolded in Tables 4-6.
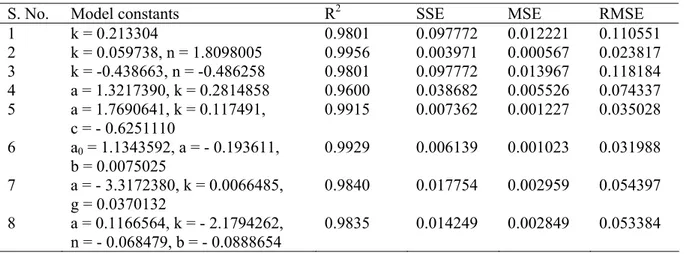
Table 4. The values of model constants and statistical parameters during drying of green peas in solar dryer in bottom tray
S. No. Model constants R2 SSE MSE RMSE
1 k = 0.213304 0.9801 0.097772 0.012221 0.110551
2 k = 0.059738, n = 1.8098005 0.9956 0.003971 0.000567 0.023817
3 k = -0.438663, n = -0.486258 0.9801 0.097772 0.013967 0.118184
4 a = 1.3217390, k = 0.2814858 0.9600 0.038682 0.005526 0.074337
5 a = 1.7690641, k = 0.117491,
c = - 0.6251110
0.9915 0.007362 0.001227 0.035028
6 a0 = 1.1343592, a = - 0.193611, b = 0.0075025
0.9929 0.006139 0.001023 0.031988
7 a = - 3.3172380, k = 0.0066485,
g = 0.0370132
0.9840 0.017754 0.002959 0.054397
8 a = 0.1166564, k = - 2.1794262,
n = - 0.068479, b = - 0.0888654
0.9835 0.014249 0.002849 0.053384
Table 5. The values of model constants and statistical parameters during drying of green peas in solar dryer in top tray
S. No. Model constants R2 SSE MSE RMSE
1 k = 0.1586828 0.9296 0.165599 0.020699 0.1438745
2 k = 0.0192923, n = 2.217551 0.9811 0.019161 0.002737 0.0523204
3 k = 0.6043623, n = 0.262562 0.9296 0.165599 0.023657 0.153808
4 a = 1.295241, k = 0.2129358 0.8984 0.096712 0.013816 0.1175416
5 a = 16.815150, k = 0.007471,
c = - 15.6964629
0.9864 0.012101 0.002016 0.0449096
6 a0 = 1.035063, a = - 0.079699, b = - 0.0041544
0.9937 0.0055592 0.000926 0.0304392
7 a = - 0.294987, k = 143.7380,
g = 0.2128411
0.8985 0.0967123 0.016118 0.1269595
8 a = 0.758041, k = - 0.423143,
n = 0.372939, b = - 0.221461
0.9950 0.0043852 0.000877 0.0296149
Table 6. The values of model constants and statistical parameters during drying of green peas under open sun
S. No. Model constants R2 SSE MSE RMSE
1 k = 0.132719 0.9663 0.174919 0.013455 0.1159972
2 k = 0.0203964, n = 1.9315353 0.9946 0.008305 0.000692 0.0263080
3 k = 0.535244, n = 0.247959 0.9663 0.174919 0.014576 0.1207338
4 a = 1.283989, k = 0.1715691 0.9473 0.082471 0.006872 0.0829014
5 a = 1.814398, k = 0.072113,
c = - 0.6678412
0.9785 0.030973 0.002815 0.0530637
6 a0 = 1.150090, a = - 0.127221, b = 0.0032809
0.9816 0.026527 0.002411 0.0491083
7 a = - 14.886007, k = 0.335610,
g = 0.3097002
0.9844 0.023846 0.002167 0.0465601
8 a = 0.9471659, k = 0.0103862,
n = 2.2737278, b = 0.0029089
Table 7. Values of statistical parameters for Page Diamante and Munro [22] and Midilli et al. [32] model
Model name R2 SSE MSE RMSE
Page model [22] (Bottom tray) 0.9956 0.0039710 0.0005672 0.0238178
Midilli et al. [32] model (Top Tray) 0.9950 0.0043852 0.0008770 0.02961497
Midilli et al. model [32] (Open Sun) 0.9962 0.0054375 0.0005437 0.0233186
5.3 Validation of the accepted models
Validation of the accepted models was carried out by evaluating the experimental moisture ratio values with the predicted moisture ratio values. The performance of the models for bottom tray, top tray and open sun is illustrated in Figures 8-10. This can be seen that, both the models were in good agreement with the experimental results. The established models gave the excellent fit to drying curves.
These figures show that the experimental data generally band around the straight line representing predicted data, which demonstrates the appropriateness of Page [22] and Midilli et al. [32] mathematical models in describing drying behaviour of green peas. This validates that Page [22] and Midilli et al. [32] model could be used to explain thin layer solar or sun drying behaviour of green peas.
Figure 8. Comparison of experimental and predicted moisture ratio (Page Model [22]) of green peas in bottom tray
Figure 10. Comparison of experimental and predicted moisture ratio (Midilli et al. [32] model) of green peas under open sun
6. Conclusions
In the present study the thin drying behaviour of green peas was investigated. The drying process of green peas occurred in falling rate period, starting from initial moisture content to final moisture content. The drying time was reduced by solar drying as compared to open sun drying. The solar dryer was found to be more efficient than open sun drying and resulted in saving to an extent of about 35.7% of drying time. In addition, the samples inside solar dryer were completely protected from insects, birds and dusts. The rehydration capacity of green peas dried in solar dryer was found higher than open sun dried peas. Of all the eight models tested, the Page model and Midilli et al. [32] model gave an excellent fit to the experimental data. For the experimental data from bottom tray, the Page model was the best to describe the drying behaviour of green peas with higher value of R2 and lower values of SSE, MSE and RMSE. For the experimental data from top tray and open sun drying Midilli et al. [32] model showed the best fit to the drying curves with higher values of R2 and lower values of SSE, MSE and RMSE. Thus, Page model and Midilli et al. [32] model could be used to predict the moisture ratio values and drying time of green peas.
Acknowledgements
The authors are very grateful to the authorities of National Institute of Technology, Hamirpur for providing the financial support.
References
[1] Ayensu A. Dehydration of food crops using a solar dryer with convective heat flow. Solar Energy 1997, 59(4-6), 121-126.
[2] Ratti C., Mujumdar A.S. Solar drying of foods: modelling and numerical simulation. Solar Energy 1997, 60, 151–157.
[3] Madhlopa A., Ngwalo G. Solar dryer with thermal storage and biomass-backup heater. Solar Energy 2007, 81, 449–462.
[4] Tiwari G.N., Bhatia P.S., Singh A.K., Goyal R.K. Analytical studies of crop drying cum water heating system. Energy Conversion and Management 1997, 38, 751-759.
[5] Sharma N., Varun, Siddhartha, Stochastic techniques used for optimization in solar systems: A review. Renewable and Sustainable Energy Reviews 2012, 16, 1399–1411.
[6] Varun, Sharma N., Bhat I.K., Grover D., Optimization of a smooth flat plate solar air heater using stochastic iterative perturbation technique. Solar Energy 2011, 85, 2331–2337.
[7] Siddhartha, Sharma N., Varun, A particle swarm optimization algorithm for optimization of thermal performance of a smooth flat plate solar air heater. Energy 2012, 38, 406-413.
[9] Sharma M., Varun, Performance estimation of artificially roughened solar air heater duct provided with continuous ribs. International Journal of Energy and Environment 2010, 1 (5), 897–910. [10] Sethi M., Sharma M., Varun, Effective efficiency prediction for discrete type of ribs used in solar
air heaters. International Journal of Energy and Environment 2010, 1 (2), 333–342.
[11] Kumar A., Kandpal T.C. Solar drying and CO2 emissions mitigation: potential for selected cash crops in India. Solar Energy 2005, 78, 321–329.
[12] Fargali H.M., Nafeh A.A., Fahmy F.H., Hassan M.A. Medicinal herb drying using a photovoltaic array and a solar thermal system. Solar Energy 2008, 82, 1154–1160.
[13] Strumillo C., Kudra T. Drying: principles, applications and design. New York, USA: Gordon and Breach, 1986.
[14] Zaman M.A., Bala B.K. Thin layer solar drying of rough rice. Solar Energy 1989, 42, 167–171. [15] Bala B.K., Woods J.L. Simulation of the indirect natural convection solar drying of rice. Solar
Energy 1994, 53, 259–266.
[16] Menges H.O., Ertekin C. Mathematical modelling of thin layer drying of golden apples. J. of Food Engineering 2006, 77, 119-125.
[17] Shanmugam V., Natarajan E. Experimental study of regenerative desiccant integrated solar dryer with and without reflective mirror. Applied Thermal Engineering 2007, 27, 1543–1551.
[18] Jadhav D.B., Visavale G.L., Sutar N., Annapure U.S., Thorat B.N. Studies on Solar Cabinet Drying of Green Peas (Pisum sativum). Drying Technology 2010, 28, 600–607.
[19] Doymaz I., Kocayigit F. Drying and rehydration behaviours of convection drying of green peas. Drying Technology 2011, 29, 1273–1282.
[20] Momenzadeh L., Zomorodian A., Mowla D. Applying artificial neural network for drying time prediction of green pea in a microwave assisted fluidized bed dryer. J. Agr. Sci. Tech. 2012, 14, 513-522.
[21] AOAC. Official methods of analysis. No. 934-06. Washington, DC: Association of Official Chemists 1990.
[22] Diamante L.M., Munro P.A. Mathematical modelling of thin layer solar drying of sweet potato slices. Solar Energy 1993, 51(4), 271-276.
[23] Gunhan T., Demir V., Hancioglu E., Hepbasli A. Mathematical modelling of drying of bay leaves. Energy Conversion and Management 2005, 46, 1667–1679.
[24] Akpinar E.K. Mathematical modelling and experimental investigation on sun and solar drying of white mulberry. J. of Mech. Sci. and Tech. 2008, 22, 1544-1553.
[25] Taheri-Garavand A., Rafiee S., Keyhani A. Mathematical modeling of thin layer drying kinetics of tomato influence of air dryer conditions. Int. Trans. J. of Engineering, Management, & Applied Sciences and Technologies 2011, 2(2), 147-160.
[26] Sarsavadia P.N., Sawhney R.L., Pangavhane D.R., Singh S.P. Drying behaviour of brined onion slices. J. of Food Engineering 1999, 40, 219–226.
[27] Yaldiz O., Ertekin C., Uzun H.I. Mathematical modeling of thin layer solar drying of Sultana grapes. Energy 2001, 26, 457–465.
[28] Chninman M.S. Evaluation of selected mathematical models for describing thlayer drying of in-shell pecans. Transactions of the ASAE 1984, 27, 610–615.
[29] Yaldız O., Ertekin C. Thin layer solar drying of some vegetables. Drying Technology 2001, 19(3, 4), 583–597.
[30] Wang C.Y., Singh R.P. A single layer drying equation for rough rice. ASAE Paper No: 78-3001, ASAE, St. Joseph, MI, 1978.
[31] Togrul I.T., Pehlivan D. Mathematcal modelling of solar drying of apricots in thin layers. J. of Food Engineering 2002, 55, 209-216.
[32] Midilli A., Kucuk H., Yapar Z. A new model for single layer drying. Drying Technology 2002, 20(7), 1503–1513.
[33] Goyal R.K., Kingsly A.R.P., Manikantan M.R., Ilyas S.M. Thin-layer drying kinetics of raw mango slices. Biosystems Engineering 2006, 1, 43–49.
[34] Lehmann E.L., Casella G. Theory of point estimation (2nd edition). New York: Springer, 1998. [35] Sharma S., Sharma V.K., Jha R., Ray R.A. Evaluation of the performance of a cabinet type solar
Sunil has graduated in Mechanical Engineering in 2008 and after that completed his M. Tech in 2012 from NIT Hamirpur (India) in Thermal Engineering specialization with Computational Fluid Dynamics and Heat Transfer. He is currently working as Assistant Professor in Mechanical Engineering Department at BRCM CET Bahal, (Haryana) India. His areas of interest are Heat Transfer, Fluid Mechanics, Thermal Engg., and Solar Energy. He has published more than 3 papers in International / National Conferences.
E-mail address: suniludmi@gmail.com
Varun,Mechanical Engineer, graduated from Rohilkhand University in 2002 and Post graduated from IIT Roorkee in 2004 and completed his Doctorate in 2010. He is teaching for more than 8 years and currently working as Assistant Professor in the Department of Mechanical Engineering at NIT Hamirpur. He has published more than 60 papers in various International/National Journals and Conferences. He is Recipient of Hari Om Ashram Prerit Research award on Renewable Energy for the year 2010 and Institution of Engineers (India) young scientist award in the area of Mechanical Engineering for the year 2011. His areas of interest include Turbo-machines, Renewable Energy, Heat Transfer, Life cycle Assessment.
E-mail address: varun7go@gmail.com
Naveen Sharma has been graduated in Mechanical Engineering in 2009 and after that completed his M.Tech in 2011 from NIT Hamirpur (India) in Thermal Engineering specialization with Computational Fluid Dynamics and Heat Transfer. He is currently doing his Ph.D. with specialization in Thermal Engineering from Mechanical and Industrial Engineering Department of IIT Roorkee, (U.K.) India. His area of interest is CFD, Heat Transfer, Experimental Fluid Mechanics, Thermal Engineering, IC engine, Optimization and Solar Energy. He has been published more than 8 papers in International / National Journals and Conferences.
E-mail address: sharma.naveen28@yahoo.com


![Figure 8. Comparison of experimental and predicted moisture ratio (Page Model [22]) of green peas in bottom tray](https://thumb-eu.123doks.com/thumbv2/123dok_br/18347654.352694/11.892.202.696.434.733/figure-comparison-experimental-predicted-moisture-ratio-page-model.webp)
![Figure 10. Comparison of experimental and predicted moisture ratio (Midilli et al. [32] model) of green peas under open sun](https://thumb-eu.123doks.com/thumbv2/123dok_br/18347654.352694/12.892.197.697.96.396/figure-comparison-experimental-predicted-moisture-ratio-midilli-model.webp)
