FORSCells: 40-days fixed prepared reagent for detection of anti-Forssman in humans
Sofia Ferreira, Cristiana Mourato, Alyssa Corpuz, Sofia Galvão, Camilla Hesse, Clara Rocha, Carlos Jesus, Fernando Mendes
PII: S0022-1759(19)30135-8
DOI: https://doi.org/10.1016/j.jim.2019.112722
Reference: JIM 112722
To appear in: Journal of Immunological Methods
Received date: 1 April 2019
Revised date: 27 November 2019
Accepted date: 5 December 2019
Please cite this article as: S. Ferreira, C. Mourato, A. Corpuz, et al., FORSCells: 40-days fixed prepared reagent for detection of anti-Forssman in humans, Journal of Immunological Methods (2019),https://doi.org/10.1016/j.jim.2019.112722
This is a PDF file of an article that has undergone enhancements after acceptance, such as the addition of a cover page and metadata, and formatting for readability, but it is not yet the definitive version of record. This version will undergo additional copyediting, typesetting and review before it is published in its final form, but we are providing this version to give early visibility of the article. Please note that, during the production process, errors may be discovered which could affect the content, and all legal disclaimers that apply to the journal pertain.
FORSCells: 40-days fixed prepared reagent for detection
of anti-Forssman in humans
Sofia Ferreira1†, Cristiana Mourato1†, Alyssa Corpuz2, Sofia Galvão1, Camilla Hesse3 Clara Rocha4,5, Carlos Jesus1, Fernando Mendes1,6,7,8,9
1 Department Biomedical Laboratory Sciences, ESTESC- Coimbra Health School, Polytechnic Institute of
Coimbra, Coimbra, Portugal
2 School of Biological Sciences, Dublin Institute of Technology, Kevin St, Dublin 8, Ireland 3 Institutionen för biomedicin, Sahlgrenska Akademin vid, Göteborgs Universitet
4 Department Complementary Sciences, ESTeSC-Coimbra Health School, Polytechnic Institute of Coimbra,
Coimbra, Portugal;
5 Institute for Systems Engineering and Computers at Coimbra, Coimbra, Portugal;
6 Biophysics Institute-CNC.IBILI, Faculty of Medicine, University of Coimbra, Coimbra, Portugal
7 Center of Investigation in Environment, Genetics and Oncobiology (CIMAGO), Faculty of Medicine,
University of Coimbra, Coimbra, Portugal
8 Coimbra Institute for Clinical and Biomedical Research (iCBR) / Instituto de Investigação Clínica e
Biomédica de Coimbra, University of Coimbra, Coimbra, Portugal.
9 CNC.IBILI, Faculty of Medicine, University of Coimbra.Coimbra, Portugal.
† - These authors contributed equally to the paper.
Contact Details:
Fernando Mendes
Biomedical Laboratory Science Departament ESTeSC-Coimbra Health School
Rua 5 de Outubro, SM Bispo, Apart 7006 3046-854 Coimbra
Portugal
fjmendes@estescoimbra.pt
Abstract
In 2012, the FORS system was accepted by the International Society of Blood Transfusion as the 31st blood group system. Forssman (Fs) antigen (Ag) expression is most
commonly found on sheep red blood cells (RBC) but rare in human RBC. Anti-Fs antibodies (Ab) are naturally occurring in human sera and are predominantly IgM but they can also be IgG. To this day, the global prevalence of the FORS system is unknown. Currently, there is a lack of natural FORS1-positive RBC available to use for anti-Fs screening in large populations. This study was designed to produce FORS1-positive cells viable for 40 days use in the anti-Fs screening.
Three to five percent FORS1-positive cells were produced using sheep’s blood and CellStab stabilizer solution. The quality of the FORS1-positive cells was investigated in more than three independent experiments of ABO titration, osmotic fragility test and supernatant haemolysis. For each batch of FORS1-positive cells produced, an extended antibody panel was performed. To demonstrate that the FORS1-positive cells can be used for up to 40 days, anti-Fs screening and classification were carried out in a patient and donor population.
Antigenic expression and membrane integrity of FORS1-positive cells remained stable for 40 days. Good FORS1 Ag preservation was established, and minimal haemolysis was observed.
In conclusion, a novel and easy-to-produce reagent has been developed and submitted to a patent with stable FORS1 Ag expression. With this FORS1-positive cell suspension, it is now possible to screen and classify anti-Fs Abs in large populations.
Keywords: Forssman antigen; antibodies; screening.
Introduction
Human blood group antigens (Ag) and antibodies (Ab) are of major importance in science transfusion in terms of allogeneic blood transfusions, haemolytic transfusion reactions and foetal-maternal blood group incompatibility. In addition, the human blood group systems and their Ag also play an integral part in organ transplantation and are useful markers in genetic linkage analysis. Likewise, blood groups, Ab have the ability to mediate red blood cells (RBC) haemolysis. Such adverse events vary from acute, delayed, intravascular and extravascular haemolysis depending on the nature of the Ab. Moreover, if the Ab are capable of crossing the placental barrier between mother and foetus, life-threatening disease known as haemolytic disease of the foetus, and newborn (HDFN) may occur.(1)
Presently, there are 36 blood group systems recognized by the International Society of Blood Transfusion (ISBT). These systems represent over 300 blood group Ag, all successfully cloned and sequenced to date. Amongst the 36 blood group systems Ag, there are 17 Ag whose functional importance and clinical significance in transfusion medicine remain undetermined. This includes the recently accepted histo-blood group system: FORS.(2)
The Forssman (Fs) Ag was first described in 1911 when John Forssman injected a kidney tissue suspension from a guinea pig into rabbits. This resulted in the production of Ab, which haemolysed sheep RBC. He found that injecting the kidney tissue suspension into other species, e.g. cows, did not produce the same Ab capable of sheep RBC haemolysis. This Ag expressed on the surface of sheep erythrocytes was later named the Forssman Ag.(3,4)
Later, in 1987, individuals from three unrelated English families were reported to belong to a rare A subgroup, named Apae. RBC from Apae individuals demonstrated unusual
Ab reaction patterns, strongly reacting with Helix pomatia lectin, weakly reacting with polyclonal anti-A reagent and non-reactive to a monoclonal anti-A Ab. Genetic and biochemical investigations by Svensson et al. showed that the Fs glycolipid, most commonly found only in the RBC of non-primate animals, was strongly expressed on RBC of Apae individuals, hence the discovery of Fs glycolipid expression on human RBC.(5)
Once the findings by Svensson et al. fulfilled the ISBT criteria to define a new blood group, it resulted in the abolishment of the Apae subgroup and acceptance of FORS as
the 31st blood group system in 2012.(5) The FORS system, therefore, consists of a single low-prevalence allele which expresses the FORS1 Ag.(6)
The human Fs gene, GBGT1, composed of 7 exons and located on chromosome 9 of the human genome(7), encodes for the Fs glycolipid synthase, a glycosyltransferase enzyme that catalyses Fs Ag synthesis. Humans and primates normally lack Fs synthase activity and are therefore considered Fs Ag-negative species.(6) The rare expression of the FORS1 Ag on human RBC is as a result of an enzyme activating amino acid substitution occurring from a missense mutation in the GBGT1 gene.(7) There are two mutations that result in the restoration of Fs synthase activity in humans, 688A>G and 887G>A. However, it was shown that the missense mutation, 887G>A, is present in all Apae
individuals.(8) The SNP, 887G>A, results in glutamine to arginine substitution at position 296 (Arg296Gln). Due to this substitution, the inactive human Fs synthase becomes enzymatically active. Fs synthase activity is restored, thus enabling the synthesis of the Fs Ag.(4–7) Inheritance of Arg296Gln is therefore linked to Fs Ag expression and phenotype in Apae individuals.(5)
The expression of the FORS1 Ag on RBC varies among species which may be divided into Fs-positive and Fs-negative. Fs-positive species include sheep, dogs (i.e. canines), guinea pigs, hamsters and horses, while Fs-negative species include rabbits and pigs. There are also other species, for example, chickens and now also humans who express the FORS1 Ag on both RBC and tissue.(3,4) This is due to the varied activity of the Fs synthase enzyme depending on the animal species. Its activity is usually inactive in humans. In sheep, Fs synthase activity is restricted to erythroid tissue only. In cows, rats and primates, the enzyme is completely inactive due to point mutations or exon loss. In contrast, in a number of species including dogs, mice, chickens, turtles and carp, the enzyme Fs synthase is active in most tissues.(8) Interestingly, the level of FORS1 Ag expression on canine RBC is serologically equal to human FORS1-positive RBC. Nevertheless, sheep RBC still possess the highest level of FORS1 Ag expression.(9)
Presently, there is a lack of natural FORS1-positive RBC commercially available in the market.(9) Until today, studies on the FORS blood group system have been conducted using red cell units collected from the known Apae individuals, as performed by Svensson et
al.. Canine RBC known to have similar levels of FORS1 Ag expression as Fs human RBC have been used in the study of monoclonal anti-A reagent activity against the FORS1 Ag. Alternatively, a modification tool known as Kode Technology has been applied in the synthesis of RBC to express rare antigens, e.g. the FORS1 Ag. (9) FORS kodecytes have been produced using synthetic pentasaccharide Forssman FSL constructs – FORS1-kodecytes, and disaccharide Forssman FSL constructs – Fsdi-kodecytes.
The human FORS1 Ag glycolipid is structurally identical to FSL-FORS1 construct, differing by approx. 2-nm only due to the spacer component and possessing a different lipid tail once the natural FORS1 glycolipid is a pentasaccharide linked to a ceramide lipid tail while the FSL-FORS1 has identical Ag (pentasaccharide) structure but with dioleoylphosphatidylethanolamine as the lipid tail. Kode technology enabled Barr et al. to synthesize FORS1 and Fsdi-kodecytes and investigate its activity against monoclonal ABO
reagents showing that anti-A reagents do not agglutinate FORS1 Ag-positive RBC, also allowing the attachment of FORS1 and Fsdi antigens to solid surfaces for immunoassays
(Figure 1).(9)
Despite the many applications and simplicity in technique to create kodecytes using FSL constructs, limitations to Kode Technology still remain. Firstly, the increased cost of Forssman FSL constructs from KODE Biotech Materials is a limiting factor to its widespread use. Following this, the optimisation of technique for attachment of Forssman FSL builds to RBC is challenging. A working FSL construct stock solution is needed, that is different for each construct. (10) The typical working concentrations of FSL constructs is 10 – 100 µg/mL but specific concentrations for each FSL glycan must first be determined experimentally.
Another substantial hindrance in its use to further study the FORS blood group is the fact that FSL modification of cells is only temporary. RBC can only retain the FSL constructs on its cell surface when stored in a lipid-free media. (10) When kodecytes are exposed to a lipid-containing medium, for example, plasma/serum, the FSL constructs gradually elute from the RBC surface.(11) In general, within 24 hours of kodecyte production, the level of FSL constructs present on the cell surface will have decreased dramatically. Moreover, after three days, the FSL constructs are completely lost from the kodecyte surface and are undetectable.(10)
Therefore, despite the robust nature of kodecytes, the surface modification tool is non-permanent. Due to this limitation, the screening of plasma samples for anti-Fs in a large population using FORS kodecytes is restricted. (10,12)
Anti-Fs Ab are naturally occurring in human sera predominantly of IgM class but may also be IgG.(4) Thus anti-Fs Ab may have significant implications in transfusion practice, particularly in pregnancy and organ transplantation with its ability to induce intravascular haemolysis of RBC with FORS1 Ag expression.(7) Furthermore, as anti-Fs antibodies are naturally occurring, its prevalence is high in humans.(4)
Currently, the worldwide incidence of the FORS blood group system is unknown, and its implications in transfusion medicine have not yet been fully determined; in order to screen for the presence of anti-Fs Ab in large populations, readily available, easy to produce and cost-effective FORS1-positive cells are required. The absence of such cells is a significant limiting factor in determining the worldwide prevalence of FORS. Our aim was to produce FORS1-positive cells from sheep’s blood ready to use, with viability of up to 40 days.
Materials and Methods
To prepare FORS1-positive cells and conduct anti-Fs screening and classification, sheep’s blood was obtained from the School of Agriculture of Coimbra (ESAC). According to the literature, sheep species are included amongst the known Fs-positive species. (4) The high expression of the FORS1 Ag on the surface of sheep erythrocytes renders sheep’s blood suitable for use as FORS1-positive cells.
Sheep Blood Collection
A veterinarian collected sheep’s blood from the jugular vein into several 6.0 mL BD Vacutainer EDTA tubes (BD Vacutainer, Plymouth, UK). Once the sheep blood was collected at different days and from different animals, an immediate ABO group and screen was performed on-site for each batch of FORS1-positive cells, using anti-A, anti-B and anti-AB anti-sera. This is to allow the collection of sheep’s blood lacking ABO antigenic expression.
FORSCells production
The preparation of a 3-5% FORS1-positive cell suspension first required the washing of the collected sheep’s blood. One mL of whole sheep’s blood was added to a 12 x 75 mm plastic tube. NaCl 0.9% (B. Braun Ecoflac, Lisboa, Portugal) was added and filled to the top of the tube. Tubes were centrifuged at 1000g for five minutes. The supernatant was decanted, and the above steps were repeated four times. After the washing step, 250µl of washed sheep’s RBC was added to 10mL of CellStab - Glycine buffered saline solution (Diamed ID-Cellstab) stabiliser solution (Bio-Rad Diamed, Cressier Fr, Switzerland) creating a 3-5% FORS1-positive cell suspension which was stored at 4ºC. Once these cells were prepared to do the Fs screening by golden standard technique (tube), the RBC concentration selected was 3-5% as well as associated with the smaller size of sheep’s RBC. (13,14) Plasma from an Apae individual and monoclonal anti-Fs antibody
(M1/22.25.8HL cell line supernatant) was used as negative and positive control, respectively.
For each batch of FORS1-positive cells collected and prepared in this study, an extended Ab panel investigation was performed in which each reagent was used according to the guidelines of the commercial house, saline at RT, saline at 37ºC or in AGH. This was done to determine the antigenic expression on the sheep RBC that would cause potential interferences in the anti-Fs screening of patients and donor plasma. The Ab panel consisted of the major human blood group antigens from ABO, Rh, Kell, Duffy, Kidd, MNS, Lutheran, P1PK and Lewis systems tested by tube technique using the 3-5%
FORS1-positive cell suspension. Anti-H lectin (Ulex europeus) and Anti-A1 lectin
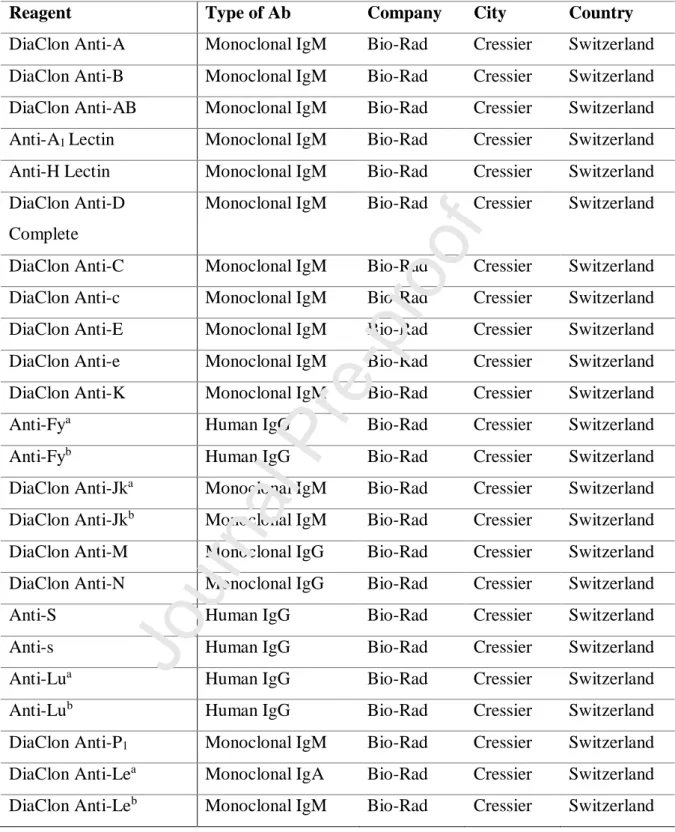
(Dolichos biflorus) anti-sera were also included in the extended antibody panel. The reagents used are identified in Table 1. The standard tube technique was employed as opposed to the gel column agglutination technique with LISS/Coombs ID-Gelcards (Bio-Rad Diamed, Cressier Fr, Switzerland) once sheep RBC is smaller in diameter in comparison to human RBC. The width of sheep RBC is approximately 5-6 µm,(13) while human RBC is about 7.5 to 8.7 µm in diameter.(14) Due to this significant difference in size, false-negative results could be obtained if the gel card system was used. Standard tube technique methodology, therefore, decreased the chances of any false-negative results. Each anti-sera was tested according to the manufacturer’s instructions against the 3-5% FORS1-positive cells. The antibody panel was performed for each batch of sheep’s blood collection (Table 2).
For all the experiments, each batch of FORS1 positive cells was tested three times unless otherwise specified.
FORSCells antigen stability test
For a period of 40 days, an Ab titration between FORS1-positive cells and plasma from four ABO donors was conducted. Donor plasma samples were stored in small fractions for single-use and stored at -80 ºC, during the study time. The purpose of this titration was to determine whether there is a change in the strength of reaction between anti-Fs in donor plasma and FORS1-positive cells; this way, RBC stability was possible to evaluate. This, in turn, determines the preservation of FORS1 Ag expression on the FORS1-positive cells. A total of four donor plasma samples were obtained from Hospital and University Center of Coimbra each obtained from a Group A, B, AB and O donor. Three independent replicates of the Ab titration were performed,
The titration for each ABO plasma was conducted under two separate conditions: in sodium chloride (NaCl) at RT and 37⁰C with AHG. Six successive plasma dilutions were prepared, i.e. 1/2, 1/4, 1/8, 1/16, 1/32, 1/64. Two hundred µl of saline was added to each tube, and then 200µl of donor’s plasma was added to the first tube (1/2 dilution). The solution was mixed, and 200µl were transferred from the 1st tube to the 2nd tube. This process was repeated until the last tube in the dilution series was reached. From this set of tubes, 100µl of each dilution was transferred to a new tube each correctly labelled and identified. 50µl of FORS1-positive cells were added to all tubes. One set of dilution series was incubated at RT and the other at 37⁰C for one hour. After incubation, one drop of AHG reagent (Anti-Human Globulin Anti-IgG and Anti-C3d polyspecific, Bio-Rad,
Cressier, Switzerland) was added to the dilution series, mixed and centrifuged at 1000g for one minute. All tubes were investigated for an agglutination reaction macroscopically using an agglutinoscope. Any weak or negative reactions were confirmed microscopically. This procedure was performed daily over 40 days, except on weekends (27 measurements), using the same plasma from the four ABO donors against the same FORS1-positive cells.(15)
FORSCells membrane resistance test
When the osmotic resistance is reduced, intravascular haemolysis occurs, leading to a reduced RBC lifespan. Hence the osmotic fragility test (OFT) is used in the diagnosis of various haematological disorders, for example, hereditary spherocytosis, elliptocytosis, haemolytic anaemia, glucose-6-phosphate dehydrogenase deficiency and sickle cell anaemia. The test is conventionally performed by exposing RBC to a hypotonic solution and measuring the intensity of light at 540 nm transmitted through the haemoglobin solution produced due to cell lysis. (16)
Seven dilution series of saline and distilled water (H2O) were prepared in the
following concentrations: 100% 80%; 70%; 50%; 30%; 20% and 0% with a total volume of 1000µl per test tube. From each dilution, 150µl of the solution was transferred to a microtube. To the microtube, 50µl of FORS1-positive cells were added. This was repeated three times. Contents of the microtubes were homogenised by inversion, incubated for 10 minutes at RT and centrifuged at 1000g for 3 minutes. Subsequently, 200µl of the supernatant was transferred to a 96-well plate and read in the spectrophotometer (Shenzhen Midray Bio-Medical Electronics CO, Hamburg, Germany) for absorbance.
The wavelength used to measure the absorbance of the supernatant was 492/630 nm. The OFT of FORS1-positive cells was measured once every second day (except weekends) over a period of 40 days (reaching a total of 16 measurements). This was done to elucidate the viability of the cells for that duration. Three independent replicates of the measurements were carried out (Figure 3).
FORSCells haemolysis test
The level of haemolysis from the supernatant of the FORS1-positive cells solution was measured at the same time as the OFT, i.e. once every second day for 40 days. This was performed in order to assess the degradation of the FORS1-positive cells over a period of 40 days. A volume of FORS1-positive cells was kept in the fridge at 4ºC in a test tube allowing the RBC to deposit. Two days later, 200µl of the supernatant was transferred to a 96-well plate, and absorbance was measured in the spectrophotometer (Shenzhen Midray
Bio-Medical Electronics CO, Hamburg, Germany). The wavelength used for absorbance of the supernatant was 492/630 nm. Similarly, three replicates of supernatant haemolysis were performed.
After the FORS1-positive cells were proven to remain intact for 40 days from the three experiments, the FORS1-positive cells were ready for use to screen patient and donor plasma samples for the presence of anti-Fs Ab.
Statistical analysis
The statistical programme IBM SPSS 246 v.19 was applied for the statistical analysis of results. The evaluation of the normal distribution of quantitative variables was done according to the Shapiro-Wilk test. To evaluate the computation of the haemolysis values in the osmotic fragility test over the 40 days between the three experiments it was used the one way ANOVA test (in the case of normality of underlying distribution and homogeneity of variances) or Kruskal-Wallis test (otherwise). Multiple comparisons (between the three replicates) were performed according to the Bonferroni correction. In the supernatant spectrophotometry study, Pearson's correlation coefficient was used, and the student's t-test for one sample was also performed. Kruskal-Wallis test was also used to evaluate differences between all plasma samples in each condition (NaCl and AHG) and then Mann-Whitney U was used to compare each two plasma samples at a time.
Ethics issues
This study respected the principles of the Declaration of Helsinki.
Results
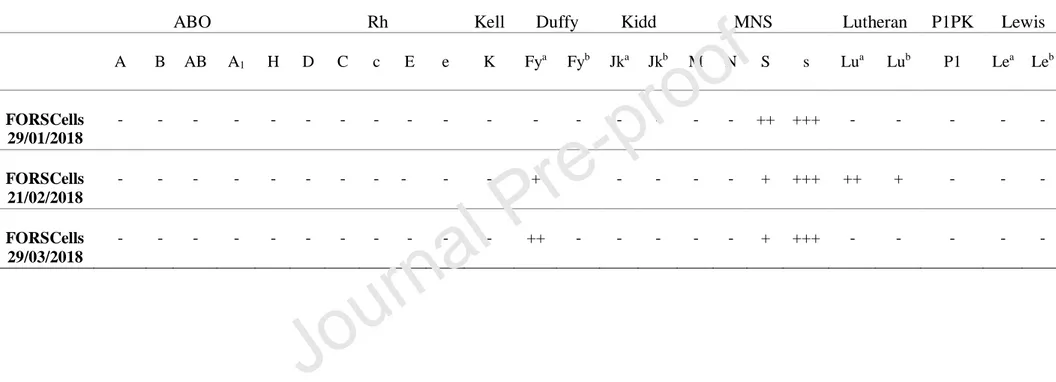
An extended Ab panel was performed three times for each batch of FORS1-positive cell suspension prepared. The results are displayed in Table 2. The three FORS1-cell suspensions lacked ABO antigenic expression with an occasional agglutination reaction to anti-Fya, anti-Lua and anti-Lub. A consistently strong 3+ reaction was observed with the
anti-s reagent. Also, agglutination with anti-S was registered against the three batches, although the reaction pattern was variable; these are new findings once these blood groups were never tested for sheep or published.
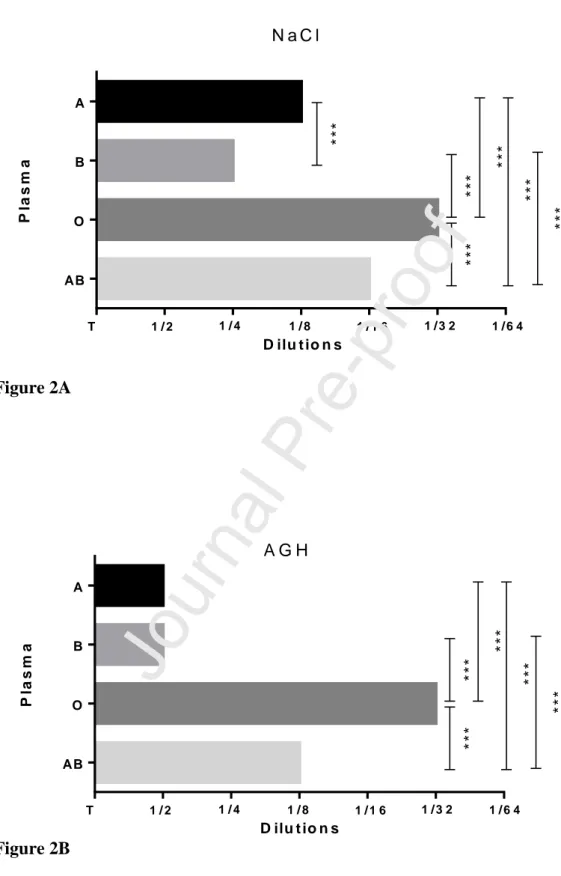
An Ab titration was performed at three separate times using three different sheep’s blood against the same ABO plasma donors. Figure 2 below portrays similar reaction patterns in each of the three experiments performed. The mean measurements recorded over 40 days for the three independent replicates resulted in being 57.30%, 81.70%, 73.20%, and 97.60% at NaCl and 63.4%, 63.4%, 51.2% and 54.3% at AHG respectively for Group A, B, AB and O donors. By applying the Kruskal Wallis test, there are statistically significant differences between the titration results of all plasma samples (p <0.001) for either NaCl or AGH. The Mann-Whitney U test also revealed that there are statistically significant differences between all pairs of plasmas: A/B, A/O, A/AB, B/O all with significance values (p <0.001) for NaCl (Figure 2A) and the same for AGH except for the pair A/B (Figure 2B). These results were obtained using the lowest and more common titration observed for each plasma donors.
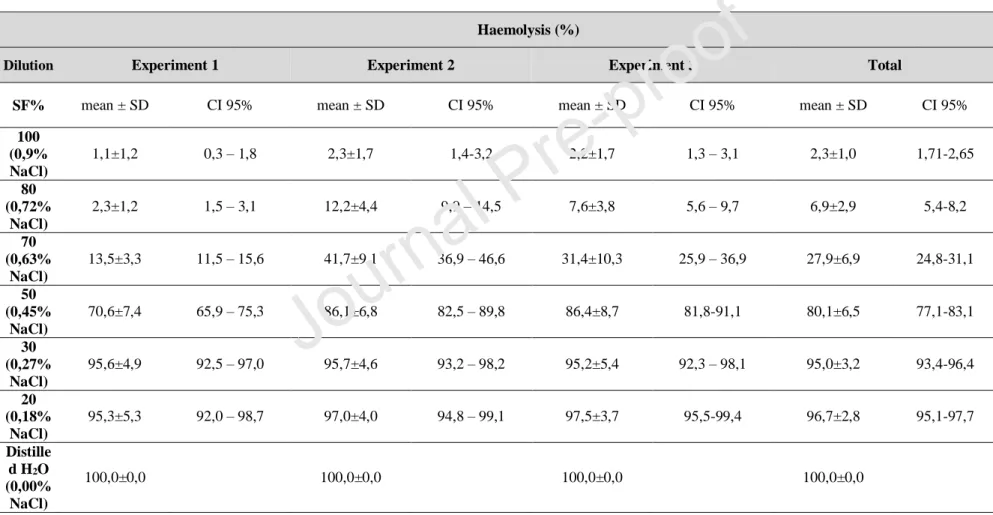
The osmotic fragility of the FORS1-positive cells remained uniform for each concentration of saline solution prepared. While changes were observed, these changes remained consistent in the three replicates performed. The value of the absorbance measured in the 0% saline solution (distilled water only) was the value used to calculate the haemolysis value, assuming that in this condition, there is 100% haemolysis. It was found that the mean haemolysis value for the 100% saline solution was 2.3 ± 1 (95% CI 1.71 – 2.65), for 80% solution was 6.9 ± 2.9 (95% CI 5.4 – 8.2), for 70% was 27.9 ± 6.9 (95% CI 24.8 – 31.1), for 50% was 80.1 ± 6.5 (95% CI 77.1 – 83.1), for 30% was 95.0 ± 3.2 (95% CI 93.4 – 96.4) and lastly for the 20% solution was 96.7 ± 2.8 (95% CI 95.1 – 97.7). Also, the results obtained in each experience are described in Table 3.
Measurement of the supernatant haemolysis was performed in order to assess the degradation of FORS1-positive cells in CellStab stabilizer solution over 40 days. Similarly, to the OFT, measurements were recorded once every second day, and three independent replicates of the test were carried out. The absorbance of the supernatant was measured at a
wavelength of 492/630 nm. There were no changes in the haemolysis levels, and the percentage haemolysis remained constant at 0% for all three replicates of supernatant absorbance.
Discussion
After the abolishment of the Apae subgroup and acceptance of FORS as an
independent blood group system in 2012 by the ISBT, new questions about the FORS system have surfaced and remained undetermined. Such items include its global incidence, implications in transfusion medicine, transplantation and role in cancer. It is known that the FORS1 Ag is of low prevalence, but its real impact in transfusion medicine remains to be uncovered. As for anti-Fs Ab, they are naturally occurring Ab that have the ability to cause haemolysis of FORS1-positive RBC.(4) Thereby, and there might be severe consequences if an Fs-positive donor unit is administered to an individual positive for anti-Fs.
Studies on the FORS system are hindered due to the rarity of the FORS system in humans. Only three unrelated English families are known to express the Fs glycolipid. (5) Furthermore, there is the absence of natural RBC with FORS1 Ag expression, thus inhibiting extensive population studies on the FORS system.(9) Kodecyte technology is the only product commercially available in the market that enables the synthesis of RBC with Fs glycolipid expression. However, there are significant limitations in using this surface modification tool. Such barriers include its cost and 24 hours RBC production. This hinders the use of FORS kodecytes in mass population screening for anti-Fs.
Through this work, an RBC suspension with stable FORS1 Ag expression has been developed and submitted to patent. The FORS1-positive cells produced from sheep’s blood are shown to be viable for 40 days, where its antigenic stability and membrane integrity is preserved. The quality and stability of the FORS1-positive cells are verified through Ab titration, OFT and supernatant haemolysis investigations.
The results from the Ab titration against ABO plasma donors revealed that the reaction patterns to the anti-Fs Ab are very similar between the three performed replicates. Reactions remained consistent in the three independent experiments, and NaCl condition revealed higher anti-Fs titre than AHG condition which may be due to the fact that anti-Fs Ab are mostly IgM which reacts preferentially at room temperature while the IgG fraction preferably reacts at 37ºC and its reaction is enhanced at AGH medium . In addition it was observed that the plasma sample with most anti-Fs is from O blood group and the anti-Fs always reacted to the previous titre in the dilution series. These results, therefore, indicate FORS1 Ag stability on the FORS1-positive cells. As the titration was performed daily (except weekends – 27 measurements) during 40 days, it is possible to conclude that the FORS1-positive cell suspension in stabilizer solution (CellStab) can maintain its antigenic
stability for at least 40 days. This enables the detection of anti-Fs in human sera with the use of FORS1-positive cells.
Once every second day, an OFT was performed. This evaluated the resistance of the FORS1-positive cells to haemolysis when exposed to descending concentrations of saline (100%, 80%, 70%, 50%, 30%, 20% and 0%). The osmotic fragility of the FORS1-positive cells remained uniform for each concentration of the saline solution. From this it can be concluded that the FORS1-positive cells maintain a similar pattern of resistance to haemolysis.
The absorbance of the supernatant was measured once every second day for 40 days to assess the degradation of the FORS1-positive cells in CellStab stabilizer solution. Over time, the values decrease, approaching zero, with a strong and statistically significant association (r =-0.76, p=0.001). It was also verified that the values did not deviate significantly from the null value (p>0.05) which means that there are no significant changes in haemolysis where it has remained constant at 0%. This confirms that the sheep RBC in stabilizer solution did not degrade over the 40 days.
From the results of the three experiments carried out, it is proven that the FORS1-positive cell suspension produced have antigenic stability and membrane integrity of at least 40 days. Good Ag preservation is shown through the Ab titration performed for 40 days daily. Similar reaction patterns from the OFT is indicative of the adequate resistance of the FORS1-positive cells to haemolysis. Lastly the supernatant haemolysis observed at 0% haemolysis over 40 days confirms the preservation of the FORS1-positive cells in stabilizer solution. Altogether, an easy-to-produce novel reagent with FORS1 Ag expression has been developed which is a reliable product for anti-Fs screening in a large population.
Beyond this, an extended antibody panel was performed in order to determine the antigenic expression of sheep RBC. Results from the enlarged group indicate that sheep RBC frequently expresses the s Ag and occasionally Duffy, Lutheran and S Ag. Such antigenic expression does not interfere with the screening of plasma samples for anti-Fs as all donors and patients used in the study had a negative antibody screen. Although, the anti-sera used for antigen phenotyping of sheep RBC are developed for human RBC and thus a negative result may probably also indicate that the anti-sera is not cross-reacting with sheep RBC. One of the FORS1-positive cell batches collected reacted with anti-A and anti-A1 anti-sera; hence the blood collected was from Group A sheep’s blood. As a
consequence of using Group A sheep RBC, samples containing anti-A in their plasma, i.e.
Group O and Group B donors and patients, will lead to a false-positive result for the anti-Fs screen. Due to this, this suspension of sheep RBC was discarded and not used in the screening and hereafter we opted to perform an immediate ABO type on-site during sheep’s blood collection with anti-A, anti-B anti-AB anti-sera. Lately, we confirmed that the A sample was from a species of sheep (Mondegueira - with representation ancestor the Ovis aries studery and also Ovis aries iberica)(17) different from all the others (Ovelha Bordaleira da Serra – a specie with very remote origins, as these sheep evolved from wild forms from the species Ovis aries palustris, Ovis musimon, and Ovis aries orientalis).(18)
On the other hand, we propose that in case of dubious results, KodeTechnology should be used to clarify and to avoid unexpected reactions observed.
Conclusion
To conclude, a suspension of natural FORS1-positive cells has been developed that can be used in mass population screening for anti-Fs Ab. In this way, the worldwide prevalence of the FORS system can be determined using this novel reagent. Presently, there is a patent submitted and accepted for the commercial use of FORS1-positive cells. This novel development by the research group in Coimbra Health School enables further studies on FORS system using a cheap, easy-to-produce and reliable reagent. The FORS1-positive cells can be used in routine transfusion practice in a hospital blood bank for anti-Fs screening in patients as well as in research.
Bibliography
1. Daniels G, Reid ME. 5 0 TH A N N I V E R S A R Y A R T I C L E Blood groups : the past 50 years. Transfusion. 2010;50(2):281–9.
2. Mitra R, Mishra N, Rath GP. Blood groups systems. Indian J Anaesth. 2014;58(5):524–8.
3. Forssman J. The production of high-quality specific sheep’s hemolysin without the use of sheep’s blood. Contribute to the teaching of heterologous antibody formation. Biochem Z 1911; 37: 78-115. [In German.]. Biochem Z. 1911;37:78–115.
4. Jesus C, Hesse C, Rocha C, Osório N, Valado A, Caseiro A, et al. Prevalence of antibodies to a new histo-blood system: the FORS system. Blood Transfus [Internet]. 2018 Feb;16(2):178–83. Available from:
http://www.ncbi.nlm.nih.gov/pubmed/27893352
5. Svensson L, Hult AK, Stamps R, Angstrom J, Teneberg S, Storry JR, et al.
Forssman expression on human erythrocytes: biochemical and genetic evidence of a new histo-blood group system. Blood [Internet]. 2013 Feb 21 [cited 2018 Jun 25];121(8):1459–68. Available from:
http://bloodjournal.hematologylibrary.org/content/121/8/1459.short
6. Yamamoto M, Cid E, Yamamoto F. Crosstalk between ABO and Forssman (FORS) blood group systems: FORS1 antigen synthesis by ABO gene-encoded
glycosyltransferases. Sci Rep [Internet]. 2017 Jan 30;7(September 2016):41632. Available from:
http://dx.doi.org/10.1038/srep41632%5Cnhttp://www.nature.com/articles/srep41632 %5Cnhttp://www.ncbi.nlm.nih.gov/pubmed/28134301%5Cnhttp://www.pubmedcen tral.nih.gov/articlerender.fcgi?artid=PMC5278553
7. Brito S, Hesse C, Mendes F. FORS, a new histo-blood group: A current review. Med Res Innov [Internet]. 2017;1(1):1–5. Available from: http://oatext.com/FORS-a-new-histo-blood-group-A-current-review.php
8. Kaczmarek R, Buczkowska A, Mikołajewicz K, Krotkiewski H, Czerwinski M. P1PK, GLOB, and FORS Blood Group Systems and GLOB Collection:
Biochemical and Clinical Aspects. Do We Understand It All Yet? Transfus Med Rev [Internet]. 2014 Jul;28(3):126–36. Available from:
http://linkinghub.elsevier.com/retrieve/pii/S0887796314000455
9. Barr K, Korchagina E, Popova I, Bovin N, Henry S. Monoclonal anti-A activity against the FORS1 (Forssman) antigen. Transfusion [Internet]. 2015 Jan;55(1):129– 36. Available from: http://doi.wiley.com/10.1111/trf.12773
10. Korchagina EY, Henry SM. Synthetic glycolipid-like constructs as tools for glycobiology research, diagnostics, and as potential therapeutics. Biochem [Internet]. 2015 Jul 16;80(7):857–71. Available from:
http://link.springer.com/10.1134/S0006297915070068
11. Blake DA, Bovin N V, Bess D, Henry SM, Fsl S. FSL Constructs: A Simple Method for Modifying Cell/Virion Surfaces with a Range of Biological Markers Without Affecting their Viability Constructs: A Simple Method for Modifying Cell/Virion Surfaces with a Range of Biological Markers Without Affecting the. J
Vis Exp [Internet]. 2011;(54):3289. Available from:
https://www.ncbi.nlm.nih.gov/pmc/articles/PMC3211133/pdf/jove-54-3289.pdf 12. Henry S, Perry H, Bovin N. Applications for kodecytes in immunohaematology.
ISBT Sci Ser [Internet]. 2017 Dec 11 [cited 2018 Jul 4]; Available from: http://doi.wiley.com/10.1111/voxs.12403
13. Adili N, Melizi M, Belabbas H. Species determination using the red blood cells morphometry in domestic animals. Vet World [Internet]. 2016 Sep;9(9):960–3. Available from: www.veterinaryworld.org/Vol.9/September-2016/7.pdf
14. Diez-Silva M, Dao M, Han J, Lim C-T, Suresh S. Shape and Biomechanical Characteristics of Human Red Blood Cells in Health and Disease. MRS Bull [Internet]. 2010;35(5):382–8. Available from:
https://www.ncbi.nlm.nih.gov/pmc/articles/PMC2998922/pdf/nihms205981.pdf 15. Advancing_Transfusion_and_celular_therapies_Worldwide_AABB. Use of
Antibody Titration, Alloantibody Identification, and the Rare Donor File. Tech Man Standars. 2002;643–53.
16. Walski T, Chludzińska L, Komorowska M, Witkiewicz W. Individual osmotic fragility distribution: A new parameter for determination of the osmotic properties of human red blood cells. Biomed Res Int. 2014;2014(December 2015):162102. 17. Dinis R. Mondegueira [Internet]. [cited 2019 Nov 25]. Available from:
https://anidop.iniav.pt/
18. Dinis R. Serra da Estrela [Internet]. [cited 2019 Nov 25]. Available from: http://ancose.com/
Figure 1
Figure 2A Figure 2B AB O B A P la s m a T 1 / 2 1 / 4 1 / 8 1 / 1 6 1 / 3 2 1 / 6 4 D ilu t io n s N a C l * ** * ** * ** * ** * ** * ** AB O B A P la s m a T 1 / 2 1 / 4 1 / 8 1 / 1 6 1 / 3 2 1 / 6 4 D ilu t io n s A G H * ** * ** * ** * ** * **
Journal Pre-proof
2 4 6 8 1 0 1 2 1 4 1 6 1 8 2 0 2 2 2 4 2 6 2 8 3 0 0 2 0 4 0 6 0 8 0 1 0 0 M e a s u r e m e n t s ( D a y s ) H e a m o ly s is ( % ) S F 1 0 0 S F 8 0 S F 7 0 S F 5 0 S F 3 0 S F 2 0 S F 0 Figure 3
Journal Pre-proof
Table 1: Identification of reagents used in the extended antibody panel
Reagent Type of Ab Company City Country
DiaClon Anti-A Monoclonal IgM Bio-Rad Cressier Switzerland
DiaClon Anti-B Monoclonal IgM Bio-Rad Cressier Switzerland
DiaClon Anti-AB Monoclonal IgM Bio-Rad Cressier Switzerland
Anti-A1 Lectin Monoclonal IgM Bio-Rad Cressier Switzerland
Anti-H Lectin Monoclonal IgM Bio-Rad Cressier Switzerland
DiaClon Anti-D Complete
Monoclonal IgM Bio-Rad Cressier Switzerland
DiaClon Anti-C Monoclonal IgM Bio-Rad Cressier Switzerland
DiaClon Anti-c Monoclonal IgM Bio-Rad Cressier Switzerland
DiaClon Anti-E Monoclonal IgM Bio-Rad Cressier Switzerland
DiaClon Anti-e Monoclonal IgM Bio-Rad Cressier Switzerland
DiaClon Anti-K Monoclonal IgM Bio-Rad Cressier Switzerland
Anti-Fya Human IgG Bio-Rad Cressier Switzerland
Anti-Fyb Human IgG Bio-Rad Cressier Switzerland
DiaClon Anti-Jka Monoclonal IgM Bio-Rad Cressier Switzerland
DiaClon Anti-Jkb Monoclonal IgM Bio-Rad Cressier Switzerland
DiaClon Anti-M Monoclonal IgG Bio-Rad Cressier Switzerland
DiaClon Anti-N Monoclonal IgG Bio-Rad Cressier Switzerland
Anti-S Human IgG Bio-Rad Cressier Switzerland
Anti-s Human IgG Bio-Rad Cressier Switzerland
Anti-Lua Human IgG Bio-Rad Cressier Switzerland
Anti-Lub Human IgG Bio-Rad Cressier Switzerland
DiaClon Anti-P1 Monoclonal IgM Bio-Rad Cressier Switzerland
DiaClon Anti-Lea Monoclonal IgA Bio-Rad Cressier Switzerland
DiaClon Anti-Leb Monoclonal IgM Bio-Rad Cressier Switzerland
Table 2 Extended Antibody Panel Results
ABO Rh Kell Duffy Kidd MNS Lutheran P1PK Lewis
A B AB A1 H D C c E e K Fya Fyb Jka Jkb M N S s Lua Lub P1 Lea Leb FORSCells 29/01/2018 - - - ++ +++ - - - - - FORSCells 21/02/2018 - - - + - - - + +++ ++ + - - - FORSCells 29/03/2018 - - - ++ - - - + +++ - - - - -
Journal Pre-proof
Table 3: Mean values (mean ± standard deviation), representative of three independent experiments (with three replicates each) and respective confidence intervals (CI) at 95% of concentrations over 40 days for haemolysis at 0% (distilled water) , 20%, 30%, 50%, 70%, 80% and 100%.
Haemolysis (%)
Dilution Experiment 1 Experiment 2 Experiment 3 Total
SF% mean ± SD CI 95% mean ± SD CI 95% mean ± SD CI 95% mean ± SD CI 95%
100 (0,9% NaCl) 1,1±1,2 0,3 – 1,8 2,3±1,7 1,4-3,2 2,2±1,7 1,3 – 3,1 2,3±1,0 1,71-2,65 80 (0,72% NaCl) 2,3±1,2 1,5 – 3,1 12,2±4,4 9,9 – 14,5 7,6±3,8 5,6 – 9,7 6,9±2,9 5,4-8,2 70 (0,63% NaCl) 13,5±3,3 11,5 – 15,6 41,7±9,1 36,9 – 46,6 31,4±10,3 25,9 – 36,9 27,9±6,9 24,8-31,1 50 (0,45% NaCl) 70,6±7,4 65,9 – 75,3 86,1±6,8 82,5 – 89,8 86,4±8,7 81,8-91,1 80,1±6,5 77,1-83,1 30 (0,27% NaCl) 95,6±4,9 92,5 – 97,0 95,7±4,6 93,2 – 98,2 95,2±5,4 92,3 – 98,1 95,0±3,2 93,4-96,4 20 (0,18% NaCl) 95,3±5,3 92,0 – 98,7 97,0±4,0 94,8 – 99,1 97,5±3,7 95,5-99,4 96,7±2,8 95,1-97,7 Distille d H2O (0,00% NaCl) 100,0±0,0 100,0±0,0 100,0±0,0 100,0±0,0
Journal Pre-proof
Figure Legend
Figure 1: Diagram of natural Fs antigen glycolipid, synthetic Forssman pentasaccharide kodecyte (FSL-FORS1) and Forssman disaccharide kodecyte (FSL-Fsdi). Figure taken from Barr et al, 2015
Figure 2: Mean percentage of the 27 measurements recorded over 40 days (except weekends) for the three independent replicates of Anti-Fs titre for each ABO plasma donor. Significant differences between the titration results of all plasma samples (p <0.001) for either NaCl or AGH were revealed when the Kruskal Wallis test was applied. Figure 2A: Differences between each plasma samples at NaCl (57.30% for Gro up A, 81.70% for Group B, 73.20% for Group AB and 97.60% for Grupo O). There are statistically significant differences (Mann-Whitney U test) between all pairs of plasmas: A/B, A/O, A/AB, B/O all with significance values (p <0.001) Figure 2B: Differences between each plasma samp les at AHG (63.4%, 63.4%, 51.2% and 54.3% respectively for Group A, B, AB and O donors). Mann-Whitney U test also revealed statistically significant differences (p <0.001) between all pairs of plasmas except for the pair A/B.
Figure 3: Osmotic fragility test was done in triplicate during 40 days and the measurements were made every second day except weekends (16 measurements). The results exhibit the mean of the haemolysis measurements for the three independent experiments performed in replicate of the osmotic fragility test along this period, being the summary of Table 3 (Total column). These were obtained by the evaluation of the computation of the haemolysis values between the three experiments (one way ANOVA test - in the case of normality of underlying distribution and
homogeneity of variances - or Kruskal-Wallis test – otherwise). Also, multiple comparisons (between the three replicates) were performed according to the Bonferroni correction.