Mariana Ramos Velez
Licenciatura em Biologia Celular e Molecular
Generation of new transgenic zebrafish
lines for studying neuronal circuits
underlying behavior in zebrafish
Dissertação para obtenção do Grau de Mestre em
Genética Molecular e Biomedicina
Orientador: Doutora Ana Catarina Certal, Champalimaud
Centre for the Unknown
Co-orientador: Doutora Ana Raquel Tomás,
Champalimaud Centre for the Unknown
Júri:
Presidente: Professor Doutor José Paulo Nunes de Sousa Sampaio Arguente: Doutor Aaron Daniel Ostrovsky
Faculdade de Ciências e Tecnologia da Universidade Nova de Lisboa
Mariana Ramos Velez
Licenciatura em Biologia Celular e Molecular
Generation of new transgenic zebrafish lines
for studying neuronal circuits underlying
behavior in zebrafish
Dissertação para obtenção do Grau de Mestre em
Genética Molecular e Biomedicina
Orientador: Doutora Ana Catarina Certal, Champalimaud
Centre for the Unknown
Co-orientador: Doutora Ana Raquel Tomás,
Champalimaud Centre for the Unknown
Júri:
Presidente: Professor Doutor José Paulo Nunes de Sousa Sampaio Arguente: Doutor Aaron Daniel Ostrovsky
Generation of new transgenic zebrafish lines for studying neuronal circuits underlying behavior in zebrafish
Copyright Mariana Ramos Velez, FCT/UNL, UNL.
Acknowledgments
Working at the Champalimaud Centre for the Unknown has been an incredible journey. Accomplishing this project was definitely challenging and rewarding, since it made me leave my comfort zone every day and made me grow professionally and personally. I would like to thank all the people who contributed for the final result.
First, I would like to thank Catarina Certal for the opportunity, supervision and guidance through the whole year. Thank you for all the time, trust and encouragement. It was a pleasure learning with you.
Someone without whom this would not be possible is Raquel Tomás. Thank you for the incredible mentorship, the patience and time for teaching me and making me understand how and why things are done. Thank you for all the advices, relaxing times and conversations. Thank you for helping me, supporting me and encouraging me. You are the best!
I also would like to thank Michael Orger for giving me the opportunity to develop this project and for all the orientation. Another person, that I would like to thank is Ruth Diez del Corral. Thank you Ruth for teaching me and explained me the difficult techniques and all your patience. At the Fish Platform, all members were incredible, but I have also to thank Joana Monteiro for teaching me, helping me and supporting me. I would also like to thank Carolina Cabrera and Rita Almeida. Thank you girls for the moments and the amazing friendship.
I would like to thank Pedro Durão for the support, patience and crazy moments every day. Catarina Costa, Denise Camacho, Carmo Soares, Sara Júlio, Isaak, João Martins, Ana Queirós, Miguel Pinto, Patrícia Correia, Sara Mateus, Mariana Santos, Ana Cunha, Natacha Leonardo and Catarina Craveiro thank you for the relaxing times and for making me feel like home! You are amazing!
On a personal note, I want to express my profound gratitude to my family. I would like to thank my sister Sofia and my mother for always believing in me and my capabilities. I also would like to thank my dad for the encouragement, my baby sister Eva and my grandparents for having faith in me. Last, but not least I want to thank you my boyfriend, Gonçalo Andrade, for providing me unfailing support and encouragement. Thank you for never doubting that I would be able to conclude this journey.
Finally, I want to thank my friends: Rita Mateus, Rita Caneco, Fábio Vieira, Fábio Coelho, Bruno Rosa, Henrique Duarte, Patrícia Valentim, Catarina Abreu and Andreia Duarte. Without you it would definitely not be the same.
“Once you stop learning, you start dying”
Resumo
Um dos objetivos centrais da Neurociência é entender como é que o cérebro processa estímulos sensoriais e gera respostas comportamentais. Para atingir este objetivo é crucial monitorizar e manipular a atividade neuronal em tempo real, bem como estudar os circuitos neuronais e as suas conexões ao longo de todo o cérebro. Para facilitar esta tarefa é importante usar um organismo modelo geneticamente manipulável e com um sistema nervoso relativamente simples, mas com comportamento robusto. O peixe-zebra tem-se tornado um promissor organismo modelo no estudo do sistema nervoso. A acessibilidade e a transparência ótica dos embriões e larvas tornam possível a expressão e a visualização de repórteres fluorescentes geneticamente codificados, através de técnicas transgénicas. Neste trabalho foi usado um conjunto recente de repórteres fluorescentes geneticamente codificados (LSSmOrange, mScarlet e GCaMP6fEF05) para estabelecer novas linhas transgénicas, através do sistema de transposão Tol2. Estas linhas serão usadas para estudar a comunicação entre diferentes populações de neurónios e registar a atividade neuronal durante respostas comportamentais. A geração de novas ferramentas genéticas aliadas ao desenvolvimento de técnicas sofisticadas de imagem tem aberto a possibilidade de mapear todo o cérebro do peixe-zebra com elevada resolução e precisão temporal. Nos próximos anos, o desafio será combinar as metodologias desenvolvidas e correntemente usadas em peixe-zebra para entender os comportamentos gerados em vertebrados mais complexos.
Abstract
A central goal of Neuroscience is to understand how the brain processes sensory stimuli and generates behavioral responses. To achieve this goal, it is crucial to monitor and manipulate the neuronal activity of single cells in real time, as well as to study the neuronal circuits and their connections throughout the whole-brain in a behaving animal. Thus, it is important to use a genetically tractable model organism with a relatively simple nervous system but with robust behavior. Zebrafish has become a promising model organism in the study of nervous system. The accessibility and optical transparency of embryos and larvae make possible the expression and visualization of genetically encoded fluorescent reporters, through transgenic techniques. In this work, recent genetically encoded fluorescent reporters (LSSmOrange, mScarlet and GCaMP6fEF05) were used for establishing new transgenic zebrafish lines, through the Tol2 transposon system. These lines will be used to study the communication between different populations of neurons and to record neural activity during behavioral responses. The generation of new genetic tools allied to the development of sophisticated imaging techniques has opened up the possibility of whole-brain imaging with single-cell resolution and high temporal precision. In the coming years, the challenge will be to combine the approaches developed and currently used in zebrafish to understand how behaviors are generated in higher vertebrates.
Contents
Acknowledgments ... v
Resumo ... vii
Abstract ... ix
Index of Figures ... xiii
Index of Tables ... xv
Abbreviations... xvii
I. Introduction ... 1
1.The challenge of Neuroscience ... 1
2.Zebrafish as a model organism ... 1
3.Neuronal circuits underlying behaviors ... 2
4.Transgenesis ... 4
4.1. Tol2 transposon system ... 4
4.2. Gal4-UAS transactivation system ... 6
5.Genetically encoded fluorescent reporters and subcellular localization tags ... 7
5.1. Genetically encoded calcium ion indicators ... 7
5.2. LSSmOrange ... 9
5.3. mScarlet ... 10
5.4. Subcellular localization tags... 10
6.Aims... 11
II. Material and Methods ... 13
1.Molecular cloning ... 13
1.1. Expanding plasmid DNA from Addgene ... 13
1.2. Plasmid DNA isolation ... 13
1.3. DNA quantification ... 13
1.4. Polymerase Chain Reaction (PCR) ... 14
1.5. Agarose gel electrophoresis ... 15
1.6. DNA extraction from agarose gel ... 15
1.7. Restriction digestion ... 15
1.8. DNA purification ... 15
1.9. DNA ligation ... 16
1.10. Transformation of competent cells ... 16
1.12. Gateway cloning technology - LR recombination reaction ... 17
1.13. Gibson Assembly ... 17
1.14. Adding 3’-A overhangs ... 17
1.15. TA Cloning ... 17
2.Transgenesis ... 17
2.1. Animal handling and welfare ... 17
2.3. Microinjection in one-cell stage zebrafish embryos ... 18
2.4. Screening for transient expression ... 20
2.5. Screening for stable expression ... 20
2.6. Lipophilic dye labeling ... 20
2.7. Confocal microscopy and image analysis ... 21
3. Solutions ... 22
III. Results ... 23
1.Construction of UAS expression clones ... 23
1.1. Strategy used for the construction of pDestTol2-LSSmOrange and pDestTol2-mScarlet vectors ... 24
1.2. Strategy used for the construction of LSSmOrange and pTol2-10xUAS-mScarlet expression clones ... 26
2.Construction of alpha-1-Tubulin expression clones ... 27
2.1. Strategy used for the construction of alpha1Tubulin-LSSmOrange and pTol2-alpha1Tubulin-mScarlet expression clones ... 28
3.Generation and characterization of transgenic zebrafish lines ... 33
3.1. Transient expression of the fluorescent reporter genes ... 33
3.2. Stable expression of the fluorescent reporter genes and characterization of zebrafish lines ... 34
IV. Discussion ... 39
V. Conclusion ... 45
VI. References ... 47
VII. Supplements ... 53
Supplement A... 53
Index of Figures
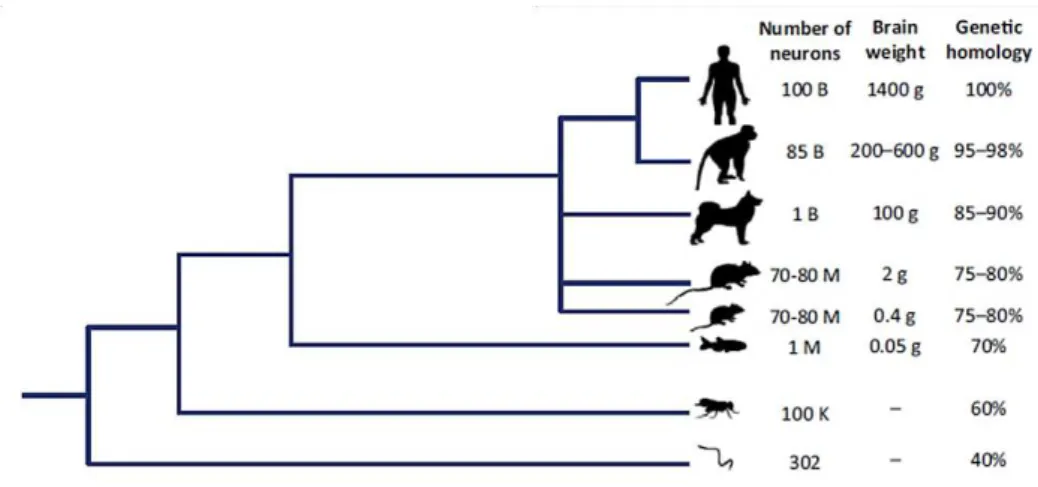
Figure I.1 –Phylogenetic tree of major model species………...1
Figure I.2 – Visuomotor behaviors: optomotor response and optokinetic response…………...3
Figure I.3 –Structure of the Tol2transposable element……….4
Figure I.4 – Scheme of transposition of a Tol2 construct in zebrafish………..5
Figure I.5 – Gal4-UAS transactivation system in zebrafish………...7
Figure I.6 –Genetically encoded calcium ion indicator GCaMP………...8
Figure I.7 –LSSmOrange fluorescence absorbance and emission spectra………...9
Figure I.8 – mScarlet fluorescence absorbance and emission spectra……….10
Figure II.1 – Microinjection in one-cell stage zebrafish embryos……….………...19
Figure II.2 – Schematic representation of the lipophilic dye labeling..………21
Figure III.1 – Gateway recombinant system…..………23
Figure III.2 – General cloning strategy for the construction of the destination vectors……...…….24
Figure III.3 – Restriction profiles on agarose gel and sequencing results of the destination vectors...25
Figure III.4 – General cloning strategy for the construction of the 10xUAS expression clones………26
Figure III.5 – Restriction profiles on agarose gel and sequencing results of the 10xUAS expression clones………27
Figure III.6 – Molecular cloning methods………...28
Figure III.7 – General cloning strategy for the construction of the intermediate vectors………….29
Figure III.8 – Restriction profiles on agarose gel and sequencing results of the pCR2.1-TOPO intermediate vectors………30
Figure III.9 – Restriction digestions for the construction of pTol2-alpha1Tubulin-LSSmOrane and pTol2-alpha1Tubulin-mScarlet expression clones……….31
Figure III.10 – Restriction profiles on agarose and sequencing results of the alpha-1-Tubulin expression clones………32 Figure III.11 – Expression pattern of the Tg (Isl3:Gal4+/+)driver line
…
………...……..33Figure III.12 – Transient expression of the microinjected constructs’ fluorescent reporter genes into one-cell stage Isl3:Gal4+/+ and nacre+/- zebrafish embryos………34
Figure III.13 –Isl3:Gal4 10xUAS:rSyp-mCherry zebrafish transgenic line…….………..36
Figure III.14 –Isl3:Gal4 10xUAS:rSyp-GCaMP6fEF05 zebrafish transgenic line………37
Figure III.15 –Isl3:Gal4 10xUAS-mScarlet zebrafish transgenic line………38
Index of Tables
Table II.1 – Original plasmids with genetically encoded fluorescent reporters, antibiotic resistance and bacteria growth temperature………..13 Table II.2 – Primers used for the amplification of DNA fragments, corresponding sequences and
melting temperature……..………..14 Table II.3 – Restriction endonucleases used in restriction digestions and corresponding
buffers………...15
Table II.4 – Primers used for the DNA sequencing, corresponding sequence and melting
temperature………..16
Table II.5 – Zebrafish strains used for the microinjection of the expression vectors………....19 Table II.6 – Summary of the compositions of solutions used in this work………..22 Table III.1 – Primers used for the amplification and subsequent cloning of LSSmOrange and
mScarlet genes into a Tol2 Gateway destination vector………24 Table III.2 – Primers used for the amplification of alpha-1-Tubulin, LSSmOrange and mScarlet
Abbreviations
BFP - blue fluorescent protein bp - base pairs
CaM - calmodulin
cDNA - complementary DNA CFP - cyan fluorescent protein
CRISPR - clustered regularly interspaced short palindromic repeats DiI - 1,1′-Dioctadecyl-3,3,3′,3′-tetramethylindocarbocyanine perchlorate DiO - 3,3′-Dioctadecyloxacarbocyanine perchlorate
DNA - deoxyribonucleic acid dpf - days post fertilization
E.coli - Escherichia coli
E3 - embryo medium
FRET - fluorescence resonance energy transfer GECI - genetically encoded calcium ion indicators GFP - green fluorescent protein
H2B - histone 2B
hpf - hours post fertilization Isl3 - islet3
kb - kilobases kz - Kozak sequence LB - Luria-Bertani
mRFP - monomeric red fluorescent protein mRNA - messenger RNA
ng - nanograms
OKR - optokinetic response OMR - optomotor response PBS - phosphate-buffered saline PCR - polymerase chain reaction PFA - paraformaldehyde
Ta - annealing temperature TAE - tris-acetate-EDTA
TALENs - transcription activator-like effector nuclease TE - tris-EDTA
Tg - transgenic
TILLING - transcription activator-like effector nuclease Tm - melting temperature
Tricaine - 3-amino benzoic acidethylester TU - Tuebingen
I. Introduction
1. The challenge of Neuroscience
The central goal of Neuroscience is understanding how neuronal networks process sensory information in the brain and generate appropriate behaviors. However, this goal is particularly challenging, since it requires an understanding of neuronal networks from the biophysical properties of neurons to their interactions (Feierstein et al. 2015; Friedrich et al. 2013; Orger 2016). To accomplish this goal, it is essential to use a multidisciplinary approach involving several scientific fields, such as: genetics, molecular biology, optics, neurobiology and mathematical modelling, and the study of a model organism with a relatively simple nervous system but with robust behavior. Zebrafish is a promising model organism to address this challenge, as it allows to visualize and manipulate activity in neuronal circuits throughout the brain (Sumbre & de Polavieja 2014).
2. Zebrafish as a model organism
Zebrafish, Danio rerio, is a small shoaling tropical water fish native to rivers of south Asia, which belongs to teleostei infraclass (Orger 2016; Sumbre & de Polavieja 2014). Traditionally, zebrafish is used as model organism in genetic studies of embryonic development and organogenesis (Langheinrich 2003). However, it has become a popular model organism in biomedical research and neuroscience (Kalueff et al. 2014; Stewart et al. 2014). Although phylogenetically distant from humans, zebrafish has a nervous system organized like all vertebrates and shares a high genetic similarity to humans. Its genome has approximately 70% of homology with the human genome (Figure I.1) (Stewart et al. 2014) and 82% of orthologous human disease-related genes (Gutiérrez-Lovera et al. 2017; Santoriello & Zon 2012).
Figure I.1 – Phylogenetic tree of major model species. Adapted from Stewart et al. 2014.
Comparing with other in vivo models, zebrafish offers many advantages. Zebrafish has high fecundity and produces 200-300 embryos per mating pair and week. The embryos develop
non-invasive assessment of their internal structures, morphogenetic tissue movements, organogenesis, cellular interaction and subcellular dynamics in real time (Giannaccini et al. 2014; Gutiérrez-Lovera et al. 2017; Santoriello & Zon 2012). Furthermore, the optical clarity of zebrafish embryos is also an advantage for in vivo neuronal network analysis and neuronal activity monitoring (Stewart et al. 2014).
Zebrafish as a powerful model organism is also very cost-efficient, easy to raise and maintain and can be housed in large numbers in a minimal facility space (Ablain & Zon 2014; Kalueff et al.
2014). Moreover, it exhibits a very rapid embryonic development and a short generation time (two to three months). The major organs systems are formed 24 hours post fertilization (hpf) and the first behavioral responses appear at 3 days post fertilization (dpf). At 5 dpf, the larvae are able to swim, hunt for food, avoid predators and stabilize their position in moving water, which proves the existence of well-developed neuronal circuits (Feierstein et al. 2015; Giannaccini et al. 2014; Gutiérrez-Lovera et al. 2017; Renninger et al. 2011; Santoriello & Zon 2012).
Another strength of this model organism is that it is genetically tractable. The genetic approaches validated and currently used include generation of random mutations and subsequent gene or enhancer-trap screens (Patton & Zon 2011), morpholino knock-down (Bill et al. 2009; Lan et al.
2011), transcription activator-like effector nuclease (TALENs) system (Cermak et al. 2011; Joung & Sander 2012), targeting induced local lesions in genomes (TILLING) system (Moens et al.
2008), clustered regularly interspaced short palindromic repeats (CRISPR) technology (Chang et al. 2013; Hwang et al. 2013) and transgenesis using the Tol2 transposon system (Kikuta & Kawakami 2009). The use of all these genetic approaches has allowed the generation of several transgenic and mutant zebrafish lines, which are particularly important in identifying human neural diseases (Stewart et al. 2014) and studying the development and function of the nervous system (Higashijima 2008; Sumbre & de Polavieja 2014).
3. Neuronal circuits underlying behaviors
In order to determine the organization and function of neuronal circuits underlying behavioral responses, sophisticated imaging techniques have been developed. These techniques have opened up the possibility to identify and label specific neurons, as well as to monitor and manipulate neuronal activity of single cells and entire circuits with high resolution (Friedrich et al.
2013; Renninger & Orger 2013; Sumbre & de Polavieja 2014). The combination of these imaging
techniques, optogenetic tools and the larvae’s small size and transparent skin enables the
One of the most studied behaviors is zebrafish is the visuomotor behavior (Portugues & Engert 2009). In early stages, vision is crucial for survival, since it allows larvae to hunt for food, avoid predators and navigate. Therefore, this strong evolutionary pressure leads to a rapid development of the visual system and a repertoire of visuomotor behaviors: startle response, optomotor response (Figure I.2A), optokinetic response (Figure I.2B) and prey capture. These behaviors can be elicited through visual stimuli in an artificial environment with larvae swimming freely or larvae partially restrained in low-melting agarose (Fleisch & Neuhauss 2006; Orger 2016; Renninger et al. 2011; Sumbre & de Polavieja 2014).
Figure I.2 – Visuomotor behaviors: optomotor response (A) and optokinetic response (B). (A) The optomotor response (OMR) is the ability of the larva to swim in the direction of a perceived motion evoked by a translational whole-field motion. The OMR divides in orienting turns, which serve to bring motion into a tail to head direction (right), and forward swims when the fish position is according to motion (left). (B) The optokinetic response (OKR) is a reflexive eye movement evoked by a whole-field rotational motion. During a rotational motion, fish adjust the direction of their eyes, alternating between slow eye movements to rapid saccades (pink traces, bottom box). Sinusoidal rotating stimulus (pink arrows) results in a consistent slow tracking movement (top box). The direction of motion is indicated by blue arrows. Adapted from Orger 2016.
Thus, to understand how neuronal circuits generate robust and complex behaviors, it is crucial to identify and characterize the neuronal populations involved in specific circuits and to delineate different areas involved in sensory processing and motor generation (Feierstein et al. 2015; Orger 2016). Moreover, it is also important to develop neuronal activity maps and put that activity in a context of neuroanatomy.
4. Transgenesis
Transgenesis is a powerful methodology for studying the function of genes and genomes in model plants and animals, and consisting of the introduction of an engineered DNA fragment into the genome of an organism (Kikuta & Kawakami 2009; Mosimann & Zon 2011). In zebrafish, the transgenesis is mainly achieved by integration of the gene of interest in its genome, through plasmid DNA microinjection in one-cell stage embryos. Traditionally, the non-Tol2-DNA microinjection method (Stuart et al. 1998) and the I-SceI-mediated method (Thermes et al. 2002) were used, but their limitations led to the development of other methodologies with high transgene integration efficiency. These methodologies include the Sleeping Beauty transposon system (Ivics
et al. 1997) and Tol2 transposon system (Kawakami et al. 2004). Taking advantage of the Tol2
transposon system, the Gal4-UAS transactivation system, which will be explained later on, has been widely used to generate a large number of transgenic zebrafish lines.
4.1. Tol2 transposon system
The Tol2 transposable element was identified from the genome of the Japanese medaka fish (Oryzias latipes) and belongs to the hAT family of transposons (Koga et al. 1996). Although the vertebrate genome contains a large number of transposons, the Tol2 element is the only autonomous transposable element identified in a vertebrate genome (Kawakami et al. 2000; Urasaki et al. 2006).
The Tol2 transposable element is about of 4.7 kilobases (kb) in length and encodes a fully functional transposase protein capable of catalyzing transposition (Kawakami et al. 1998; Kawakami & Shima 1999).For that, the presence of minimal Tol2cis-sequences (Tol2 arms), that are recognized by the transposase (Figure I.3), is necessary. Theoretically, any DNA fragment can be cloned between Tol2cis-sequences. It has been described that a Tol2 construct can carry 11 kb DNA without reducing the transposition activity (Kawakami 2007; Urasaki et al. 2006).
Figure I.3 – Structure of the Tol2 transposable element. Tol2 transposableelement encodes a mRNA for the transposase protein. Lines and dotted lines indicate the exons and introns, respectively. Black boxes represent coding regions and grey boxes represent untranslated regions. The terminals (L and R) correspond to the minimal Tol2cis-sequences necessary for transposition. The minimal Tol2cis-sequences are DNA sequences with 200 base pairs (bp) from the left end (L) and 150 bp from the right end (R) of the Tol2 transposable element. Adapted from Kawakami 2007.
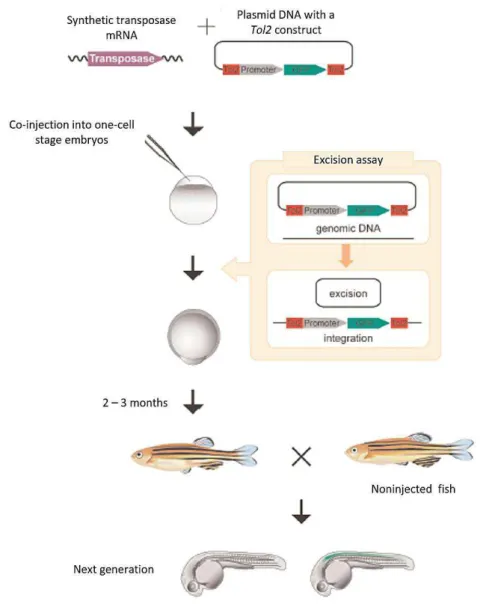
consists of two components: plasmid DNA carrying a non-autonomous Tol2 construct and transposase mRNA synthesized in vitro by using the transposase cDNA as a template.
In zebrafish, stable transposition is achieved when a plasmid DNA and the transposase mRNA are co-injected into one-cell stage zebrafish embryos. The transposase protein is translated from the mRNA and catalyzes the excision of the non-autonomous Tol2 construct from the plasmid, which is randomly integrated into the genome during early stages of embryonic development. Some Tol2 constructs will be integrated in germ cells and transmitted to the offspring (Figure I.4). When the mRNA and transposase protein are degraded, the transposase activity ends, and the insertions become stable (Abe et al. 2011; Kawakami 2004; Kawakami 2007). The Tol2 constructs are integrated in the genome through the cut-and-paste mechanism and the only modification observed is an 8 bp duplication at the integration site (Kawakami 2007; Kawakami et al. 2000).
4.2. Gal4-UAS transactivation system
Although the Gal4-UAS transactivation system has been extensively used in genetic studies in
Drosophila melanogaster, it was not applied to genetic studies in vertebrates for a long period of time, mainly due to the lack of an efficient transposon system. However, this situation was revolutionized when the Tol2 transposon system was developed in zebrafish (Asakawa & Kawakami 2008).
The Gal4-UAS transactivation system is a powerful genetic method that includes two components: the Gal4 protein and an Upstream Activating Sequence (UAS). The Gal4 protein is a yeast transcriptional activator that contains two domains: the DNA-binding domain and the transcription activation domain. The Gal4 protein binds to specific sites of the upstream activating sequence and activates the transcription of a target gene (Figure I.5) through the transcription activation domain (Asakawa & Kawakami 2008; Giniger & Ptashne 1987; Keegan et al. 1986; Ma & Ptashne 1987), which recruits the general transcriptional machinery to the promoter region (Traven et al. 2006).
To induce a strong expression of a target gene, the Gal4 protein can be modified. The Gal4-VP16 protein contains the DNA-binding domain from Gal4 and the transcriptional activation domain from the herpes simplex virus VP16 protein (Asakawa & Kawakami 2008; Sadowski et al. 1988). The Gal4FF (or GFF) protein contains the DNA-binding domain from Gal4 and two short transcriptional activation motifs from VP16 (Asakawa & Kawakami 2008; Seipel et al. 1992). Although Gal4FF shows a weaker transcriptional activity than Gal4-VP16, it is better tolerated in vertebrate cells, since high levels of expression of Gal4-VP16 inhibit the transcription of the target gene (Asakawa & Kawakami 2008).
The binary nature of the Gal4-UAS transactivation system enables the creation of several driver and reporter lines that can be combined in different ways, in order to generate a large number of transgenic zebrafish lines. These transgenic lines can be used to study the anatomy and connectivity of the nervous system and to identify neuronal circuits that regulate specific behavioral responses (Halpern et al. 2008; Scheer & Campos-Ortega 1999; Scott 2009).
Figure I.5 – Gal4-UAS transactivation system in zebrafish. When a driver line with a specific promoter upstream of the gal4 gene is crossed with a reporter line that carries a gene of interest (GOI) under the control of the UAS, the result is a double transgenic progeny. The gene of interest is expressed in Gal4-expressing cells. Adapted from Asakawa & Kawakami 2008.
5. Genetically encoded fluorescent reporters and subcellular localization
tags
Transgenic techniques and optical transparency of zebrafish embryos and larvae make the zebrafish an ideal organism for studying neuronal connectivity, tracking neurons and monitoring neuronal activity in real time, through genetically encoded fluorescent reporters (Halpern et al.
2008; Renninger et al. 2011). After the discovery of green fluorescent protein (GFP) (Prasher et al. 1992), multiple genetically encoded fluorescent reporters have been developed to expand the color palette and improve the fluorophores characteristics, such as: folding speed, brightness, maturation, photostability, sensitivity and Stokes shift, i.e. the spectral distance between absorption and emission peaks of a fluorophore (Chudakov et al. 2010; Weber & Koster 2013). Furthermore, in order to visualize and study specific events, genetically encoded fluorescent reporters can be fused to subcellular localization tags (Weber & Koster 2013).
5.1. Genetically encoded calcium ion indicators
Neuronal activity can be recorded by changes in intracellular calcium concentration. Calcium ions (Ca2+) are transported into neurons during action potential firing and synaptic input and, therefore,
changes in intracellular calcium concentration are a good readout of ongoing neuronal activity (Akerboom et al. 2012; Akerboom et al. 2013; Ni et al. 2017; Renninger & Orger 2013).
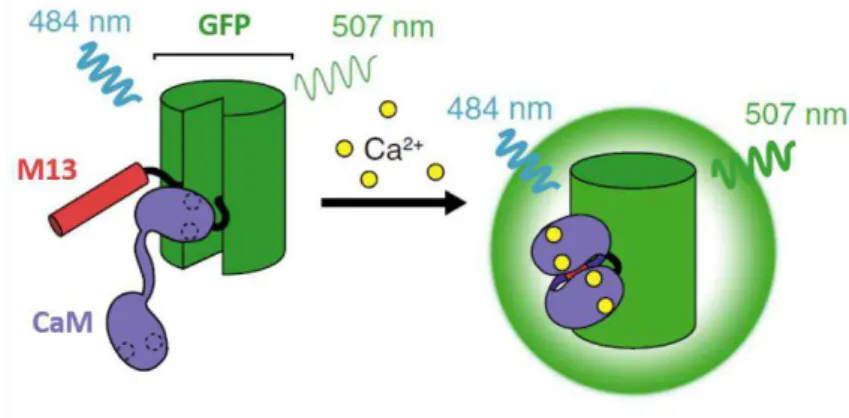
The most optimized GECIs are single-wavelength green indicators based on the original genetically encoded calcium sensor, GCaMP. In the GCaMP sensor, GFP is fused to Calmodulin (CaM) and M13 peptide from the myosin light chain kinase. When Ca2+ is present, calmodulin
binds to the M13 peptide, producing a conformational change in CaM-M13 interaction, which causes an increase of fluorescence intensity. GCaMP exhibits an excitation and emission maxima of ~484 nm and ~507 nm, respectively (Figure I.6) (Chudakov et al. 2005; Nagai et al. 2001; Ni
et al. 2017; Renninger & Orger 2013).
Figure I.6 – Genetically encoded calcium ion indicator GCaMP. In the presence of Ca2+, calmodulin (CaM) binds to the M13 peptide, causing a conformational change in CaM-M13 interaction, which leads to an increase of brightness. Adapted from Ni et al. 2017.
The high levels of fluorescence and the high sensitivity of GCaMPs, in terms of signal-to-noise ratio and kinetics response, are the most important parameters to a successful detection of neuronal activity. The first version of GCaMP was not sensitive enough to reliably detect the fast calcium dynamics associated with neuronal activity in vivo, thus a high number of GCaMP variants have been produced, in order to increase its brightness and sensitivity. The GCaMPs that exhibit the best performance belong to the GCaMP6 family (Chen et al. 2013; Ni et al. 2017; Renninger & Orger 2013). This family is able to detect single action potential and includes three ultrasensitive GCaMP6 sensors: GCaMP6s, GCaMP6m and GCaMP6f, that show slow, medium and fast kinetics, respectively (Chen et al. 2013).
Another favorable feature of GCaMPs is the possibility to modulate the color of the fluorescent protein. Direct mutations in the GFP chromophore result in fluorescent proteins with different excitation/emission properties (BFP, CFP, YFP, RFP – blue, cyan, yellow, red fluorescent proteins). These proteins can be fused with biosensors to obtain GECIs. For imaging, red-shifted indicators are preferable, since longer wavelengths reduce the tissue scattering, autofluorescence and phototoxicity. Moreover, non-green sensors offer the possibility to use animals that express GFP (Akerboom et al. 2013).
5.2. LSSmOrange
Multicolor imaging based on genetically encoded fluorescent proteins is a powerful tool to study dynamic processes in living cells. One of the most recently developed genetically encoded fluorescent proteins is LSSmOrange (Shcherbakova et al. 2012).
LSSmOrange is a monomeric orange fluorescent protein (mOrange) with a large energy gap between the excitation and emission peaks, currently designed by Light-induced Spectral Shift (LSS) (Fron et al. 2015). LSSmOrange exhibits an excitation and emission maxima of 437 nm and 572 nm, respectively (Figure I.7), and a highest brightness than red LSS fluorescent proteins (Shcherbakova et al. 2012). Moreover, it also exhibits a photoconvertible process, which can be characterized by a shift of the excitation maximum from 437 to 553 nm without changing the emission spectrum (Bergeler et al. 2016; Fron et al. 2015).
Figure I.7 – LSSmOrange fluorescence absorbance (blue) and emission (orange) spectra. LSSmOrange has an excitation maximum of 437 nm and an emission maximum of 572 nm. Adapted from FPbase (https://www.fpbase.org/, consulted on 29/08/2018).
5.3. mScarlet
The wide expansion of the fluorescent proteins occurred after discovery of red fluorescent proteins (RFPs). RPFs usually form tetramers, which interfere with function and localization of the RPF-fusion proteins. In order to solve this limitation, various monomeric proteins have been created, but the monomerization leads to a significant deterioration of brightness. One of the main goals of fluorescent protein engineering has been to develop bright monomeric fluorescent reporters with a complete maturation (Bindels et al. 2017; Rodriguez et al. 2017). mScarlet is the latest brighter monomeric red fluorescent protein developed (Bindels et al. 2017).
mScarlet was generated from a synthetic template through improved screening techniques, and it exhibits an excitation and emission maxima of 569 nm and 594 nm, respectively (Figure I.8). Comparing with other RPFs, mScarlet offers many features that make it a powerful monomeric RFP (mRFPs). mScarlet shows the highest fluorescence lifetime (3.9 ns) and the highest quantum yield (0.7) recorded in the mRFPs and exhibits a record brightness (71x103 M-1cm-1) in the mRFP
spectral class. Moreover, mScarlet shows a complete maturation and a high tolerance in acidic environments, since it has a low pKa (5.3) (Bindels et al. 2017).
Figure I.8 – mScarlet fluorescence absorbance (orange) and emission (red) spectra. mScarlet has an excitation maximum of 569 nm and an emission maximum of 594 nm. Adapted from FPbase (https://www.fpbase.org/, consulted on 29/08/2018).
The creation of mScarlet led to the development of two variants with a single amino acid substitution: mScarlet-I and mScarlet-H. Although these variants exhibit a lower fluorescence lifetime and quantum yield than mScarlet, I has an enhanced maturation and mScarlet-H has an improved photostability. None of mScarlets shows problems of cytotoxicity, photochromicity, dimerization or incomplete maturation. Furthermore, mScarlet and their variants are the preferred monomeric RFPs for cellular microscopy and quantitative functional imaging, since they can be used as an RPF fusion tag for labeling various subcellular structures and organelles in live cells, or as a FRET acceptor in radiometric imaging (Bindels et al. 2017).
5.4. Subcellular localization tags
In zebrafish, the histone 2B sequence (H2B tag) is commonly used, since it directs the fluorescent reporter expression to the nucleus (Halpern et al. 2008; Weber & Koster 2013). Another example is the rat synaptophysin sequence (rSyp tag), that directs the fluorescent reporter expression to presynaptic vesicles (Meyer & Smith 2006). Thus, any cellular compartments and structure can be highlighted as long as there is a specific protein to direct the fluorescent reporter expression to those compartments and structures.
6. Aims
The central aim of this project is to generate new transgenic zebrafish expressing recent genetically encoded fluorescent reporters, as these fluorescent reporters offer unique advantages in fluorescence microscopy imaging of the whole-brain neuronal activity, quantitative analysis of behaviorand study of neuronal circuits underlying visuomotor behaviors.
The specific aims of this project are:
• To clone new genetically encoded fluorescent reporter genes (LSSmOrange and mScarlet), into zebrafish expression vectors;
• To generate stable transgenic zebrafish lines by injecting expression clones into one-cell stage zebrafish embryos, using the Tol2 transposon system;
II. Material and Methods
1. Molecular cloning
1.1. Expanding plasmid DNA from Addgene
Plasmids encoding the fluorescent reporter genes (LSSmOrange and mScarlet) were obtained from Addgene (https://www.addgene.org/) (Table II.1), and further cloned into a Tol2 Gateway
destination vector (Supplement A.1), constructed by Michael Orger’s Laboratory (Champalimaud
Centre for the Unknown).
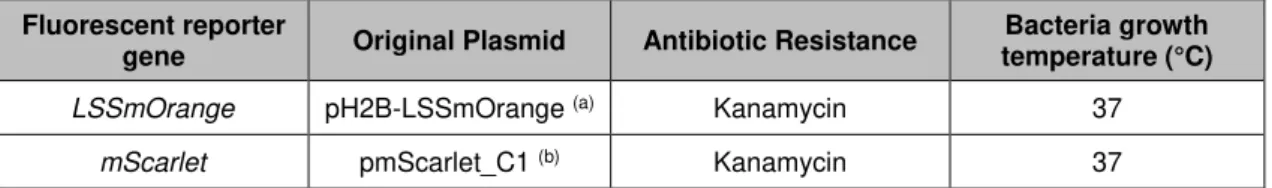
Table II.1 – Original plasmids with genetically encoded fluorescent reporter genes, antibiotic resistance and bacteria growth temperature.
Fluorescent reporter
gene Original Plasmid Antibiotic Resistance
Bacteria growth temperature (°C)
LSSmOrange pH2B-LSSmOrange (a) Kanamycin 37
mScarlet pmScarlet_C1 (b) Kanamycin 37
(a) pH2B-LSSmOrange was a gift from Vladislav Verkhusha (Addgene plasmid #37133).Map in supplement A.2A. (b) pmScarlet_C1 was a gift from Dorus Gadella (Addgene plasmid #85042). Map in supplement A.2B.
In order to isolate a single colony, bacterial cultures were spread on Luria-Bertani (LB)broth agar plates (composition in table II.6) supplemented with kanamycin 50 µg/ml (Sigma #060615) and incubated overnight at 37°C.
1.2. Plasmid DNA isolation
Single colonies were inoculated into 4 ml of LB broth (composition in table II.6) supplemented with appropriate antibiotic and incubated overnight at 37°C with shaking. Plasmid DNA was
obtained using the QIAprep Spin Miniprep Kit (QIAGEN #27106), according to the manufacturer’s
instructions. Unless otherwise specified, DNA was eluted in 5 mM of Tris HCl, pH 8.0.Antibiotics were used at the following concentrations: 100 µg/ml ampicillin (Sigma #A9518) and 50 µg/ml kanamycin (Sigma #060615).
Plasmid DNA was preserved in glycerol stocks. Under aseptic conditions, 800 µL of the bacterial culture were added to 800 µL of 100% (v/v) glycerol (Sigma #G2015). Glycerol stock tube was stored at - 80°C.
1.3. DNA quantification
1.4. Polymerase Chain Reaction (PCR)
DNA fragments used in the cloning procedures were amplified by PCR. For each DNA fragment, sequence-specific primers were designed (Table II.2). PCR reactions were performed according to the recommended protocol for each DNA polymerase: Phusion High-Fidelity DNA Polymerase (NEB #M0530S) and Platinum SuperFi DNA Polymerase (Invitrogen#12351-010), using a C1000 Touch Thermal Cycler (BioRad).
For Phusion High-Fidelity DNA Polymerase, reaction mixes were prepared in volumes that ranged between 50 to 200 µL, depending on the application, using < 250 ng of template DNA, 10 mM of deoxynucleotide (dNTP) mix, 0.5 µM of each primer, 5X Phusion HF Buffer (1x) and 1U of Phusion DNA polymerase per 50 µL of reaction. DNA was amplified under the following thermocycling conditions: an initial melting step of 98°C for 3 minutes followed by 34 cycles of amplification, composed of denaturation at 98°C for 10 seconds, annealing at the appropriate temperature for 20 seconds and extension at 72°C for 30 seconds/kb. A final extension step was performed at 72°C for 10 minutes.
For the Platinum SuperFi DNA Polymerase, reaction mixes were prepared in volumes that ranged between 50 to 200 µL, depending on the application, using 100 ng of template DNA per 50 µL of reaction, 0.2 mM of dNTP mix, 0.5 µM of each primer, 5X SuperFi Buffer (1x) and 0.02 U/µL of Platinum SuperFi DNA Polymerase. DNA was amplified under the following thermocycling conditions: an initial melting step of 98°C for 30 seconds followed by 34 cycles of amplification, composed of denaturation at 98°C for 10 seconds, annealing at the appropriate temperaturefor 10 seconds and extension at 72°C for 30 seconds/kb. A final extension step was performed at 72°C for 5 minutes.
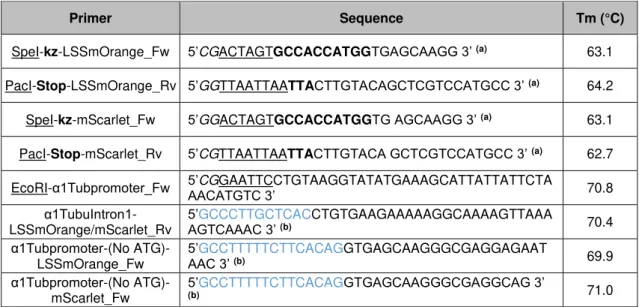
Table II.2 - Primers used for the amplification of DNA fragments, corresponding sequences and melting temperature (Tm).
(a) Restriction sites are underlined in primers’ sequence. Kozak sequence (kz) and stop sequence are in bold. Extra nucleotides to ensure the cleavage by restriction endonucleases are in italic.
Primer Sequence Tm (°C)
SpeI-kz-LSSmOrange_Fw 5’CGACTAGTGCCACCATGGTGAGCAAGG 3’ (a) 63.1
PacI-Stop-LSSmOrange_Rv 5’GGTTAATTAATTACTTGTACAGCTCGTCCATGCC 3’ (a) 64.2
SpeI-kz-mScarlet_Fw 5’GGACTAGTGCCACCATGGTG AGCAAGG 3’ (a) 63.1
PacI-Stop-mScarlet_Rv 5’CGTTAATTAATTACTTGTACA GCTCGTCCATGCC 3’ (a) 62.7
EcoRI-α1Tubpromoter_Fw 5’CGAACATGTC 3’GAATTCCTGTAAGGTATATGAAAGCATTATTATTCTA 70.8 α1TubuIntron1
-LSSmOrange/mScarlet_Rv
5’GCCCTTGCTCACCTGTGAAGAAAAAGGCAAAAGTTAAA
AGTCAAAC 3’ (b) 70.4
α1Tubpromoter-(No
ATG)-LSSmOrange_Fw
5’GCCTTTTTCTTCACAGGTGAGCAAGGGCGAGGAGAAT
AAC 3’ (b) 69.9
α1Tubpromoter-(No
ATG)-mScarlet_Fw
5’GCCTTTTTCTTCACAGGTGAGCAAGGGCGAGGCAG 3’
1.5. Agarose gel electrophoresis
PCR products or DNA fragments were separated according to size and visualized on agarose
gels stained with GreenSafe Premium (nzytech #18011), according to the manufacturer’s
instructions. Gels were prepared using 1% (w/v) agarose (Fisher BioReagents #BP160-500) in 1x Tris-acetate-EDTA (TAE) (composition in table II.6) and the DNA samples were mixed with the Gel Loading Dye Purple (6x) (NEB #B7024S), prior to loading on wells. Fragment size was estimated by comparison with linear DNA standards of known molecular weight (GeneRuler 1 Kb DNA ladder, Thermo Scientific #SM0311, Supplement A.3).Electrophoresis was performed at 80-100V in 1x TAE buffer.
1.6. DNA extraction from agarose gel
DNA fragments were carefully excised from the gel and recovered with QIAquick Gel Extraction Kit (QIAGEN #28706), according to the manufacturer’s instructions. Unless otherwise specified, DNA was eluted in 5 mM of Tris HCl, pH 8.0.
1.7. Restriction digestion
Restriction digestions of plasmids DNA or PCR products were prepared in a total volume of 20
μL, using the appropriate restriction endonucleases (NEB) and corresponding buffers (NEB) (Table II.3), according to the manufacturer’s instructions. In the case of double digestion with different buffers, the buffer that provided the maximal activity for both enzymes was selected. Restriction digestions were incubated for 1 to 2 hours at 37°C.
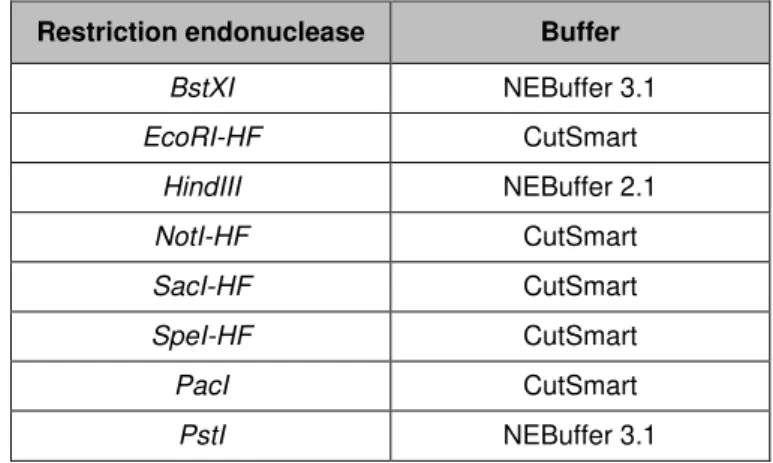
Table II.3 – Restriction endonucleases used in restriction digestions and corresponding buffers.
Restriction endonuclease Buffer
BstXI NEBuffer 3.1
EcoRI-HF CutSmart
HindIII NEBuffer 2.1
NotI-HF CutSmart
SacI-HF CutSmart
SpeI-HF CutSmart
PacI CutSmart
PstI NEBuffer 3.1
1.8. DNA purification
DNA fragments were purified with QIAquick PCR Purification Kit (QIAGEN #28106), according to
1.9. DNA ligation
Digested DNA fragments (inserts) and vectors were ligated using T4 DNA ligase (NEB #M0202S). Approximately 50 ng of vector DNA was ligated with 3-fold excess of insert in a 20 µL reaction (made up in sterile Milli-Q water), containing 1x T4 ligase reaction buffer (NEB #B0202S) with 10 mM ATP (NEB #B0202S) and 1U of T4 DNA ligase. Ligation was performed from 30 minutes at room temperature to overnight at 4°C.
The amount of DNA insert (in ng) used in each reaction was calculated with the following formula:
ng insert = 50 ng vector × kb insertkb vector × 3
1.10. Transformation of competent cells
Escherichia coli chemically competent cells were transformed by heat shock method, according to Froger & Hall 2007. All competent cells used were stored at - 80°C. The thawing process was performed on ice for 5 minutes. Then, the aliquots were incubated on ice for 30 minutes with 3 to 10 µL of ligation mix. The DNA-cells mix was then heat shocked for 30 seconds at 37°C, followed by 2 minutes on ice. Under aseptic conditions, 500 µL of LB medium were added to the mix and incubated for 1 hour at 37°C with shaking. Cells were plated on LB broth agar plates containing the appropriate antibiotic and incubated overnight at 37°C. Ampicillin was used at 100 µg/ml and kanamycin at 50 µg/ml. In this work, TOP10 chemically competent E.coli and ccdB Survival 2 competent cells were used, whenever appropriate.
1.11. DNA sequencing
Plasmid DNA integrity was confirmed by sequencing. DNA was sequenced at STAB VIDA according to the Sanger method, using specific or general primers (Table II.4). DNA sequences were analyzed and compared with the desired DNA sequences using SnapGene (sequence analysis software that allows for planning, visualization and documentation of molecular biology procedures) (http://www.snapgene.com/). Sequencing samples were prepared in a total volume of 10 µL (made up in sterile Milli-Q water), containing 100 ng of plasmid DNA and 3 µL at 10 µM of sequencing primer.
Table II.4 – Primers used for the DNA sequencing, corresponding sequence and melting temperature (Tm).
Primer Sequence Tm (°C)
SV40_Rv 5’ACTGCATTCTAGTTGTGGTTTGTCC 3’ 63.0
M13_Fw 5’GTAAAACGACGGCCAGT 3’ 56.3
M13_Rv 5’CAGGAAACAGCTATGAC 3’ 50.7
α1Tub225_Fw 5’GTTGGGCCTGCTCCTCATTC 3’ 62.7
α1Tub450_Fw 5’GATGCGACTGGATGTTGAGG 3’ 60.1
1.12. Gateway cloning technology - LR recombination reaction
The LR recombination reaction was performed using the Gateway LR Clonase II Enzyme Mix Kit (Invitrogen #11791-020), according to the manufacturer's instructions. The reaction containing 150 ng of destination vector, 150 ng of entry clone and 2 µL ofGateway LR Clonase II Enzyme
Mix was prepared in a total volume of 10 μL (made up in Tris-EDTA (TE) buffer, composition in table II.6) and incubated for 3 hours at 25°C. Then, 1 µL of Proteinase K was added and the LR reaction was incubated for 10 minutes at 37°C. The 10xUAS Entry Clone (Supplement A.4) was constructed by Michael Orger’s Laboratory (Champalimaud Centre for the Unknown).
1.13. Gibson Assembly
Gibson Assembly was performed using the Gibson Assembly Master Mix Kit (NEB #E2611L), according to the manufacturer's instructions. The reaction containing 10 μL of 2x Gibson
Assembly Master Mix was incubated with 2 fragments (0.5 pmol each) in a total volume of 20 μL
for 1 hour at 50°C. The alpha-1-Tubulin fragment was obtained from a pT-alpha1Tubulin-GCaMP vector (Supplement A.5), constructed by Michael Orger’s Laboratory (Champalimaud Centre for the Unknown). This fragment contains the promoter, first exon and first intron of the alpha-1-Tubulin gene.
1.14. Adding 3’-A overhangs
PCR product was incubated with 100mM of ATP (Thermo Scientific #R1441) and 1U of Taq Polymerase (NEB #M0273S) in Standard Buffer Taq Polymerase (1x) for 10 minutes at 72°C to
add 3’ deoxyadenosine (A) overhangs.
1.15. TA Cloning
PCR product was cloned into a pCR2.1-TOPO vector (Supplement A.6) using the TOPO TA Cloning Kit (Invitrogen #45-0641), according to the manufacturer's instructions. Then, 4 µL of PCR product with 3’-A overhangs was added to 1 µL of the pCR2.1-TOPO vector along with 1 µL of high salt solution. Ligation was performed from 30 minutes at room temperature to overnight at 4°C.
2. Transgenesis
2.1. Animal handling and welfare
Adult zebrafish were maintained at 28ºC in a holding room with 14 hours light/10 hours dark cycle, using 200-300 lux ambient light intensity. They were kept in 3.5L tanks with running water and a maximum population of 10 fish per Iiter. Moreover, adult zebrafish were fed twice a day, in the morning they were fed living aquatic crustaceans Artemia nauplii and in the afternoon they were fed a nutritive dry powder, Zebrafeed 400-600 (sparos). Physical and chemical parameters of the fish water - temperature, pH, conductivity, dissolved gases, nitrates, nitrites and ammonia - were kept within physiological values (Martins et al. 2016).
2.2. Zebrafish strains
In this work, three different zebrafish strains were used: Tuebingen (TU), nacre-/- and Tg
(Isl3:Gal4+/+). TU is a popular wild-type strain. nacre -/- is a recessive mutant strain, where the
homozygous mutants have a complete lack of melanophores throughout all life stages due to a single-base mutation in the microphthalmia-associated transcription factor a (mitfa) gene, which is required for melanophores’ development. Nevertheless, these fish have a normal development of the pigmented epithelium of the retina (Lister et al. 1999). Last, but not least, Tg (Isl3:Gal4+/+)
is a driver line that activates Gal4 expression under the control of the Isl3 promoter. This Tg (Isl3:Gal4+/+) line has a heart-specific GFP marker (Huang et al. 2003).
2.3. Microinjection in one-cell stage zebrafish embryos
Microinjection is a method used for generating transgenic fish through the introduction of genetic material into fertilized zebrafish embryos. Microinjection was performed into one-cell stage embryos, according to Kikuta & Kawakami 2009.
2.3.1. Crossing adult zebrafish
Zebrafish embryos used in the microinjection experiments were obtained by crossing adult zebrafish in breeding tanks. Breeding tanks have a grid that allows the eggs to fall and protects the embryos from being eaten by adults. The night prior to the microinjection, zebrafish were transferred into breeding tanks with a plastic barrier to separate males and females. The ratio used was three males to five females. In the following morning, the plastic barriers were removed to enable mating. Approximately 20 minutes after the mating time, fertilized eggs were harvested and transferred into petri dishes with 1x embryo medium (E3) (composition in table II.6). In the end, the zebrafish adults were transferred back to the fish facility’s main system.
Isl3:Gal4+/+ transgenic embryos were used in case of the UAS constructs (Table II.5) and nacre
+/-embryos were used in case of the alpha-1-Tubulin construct (Table II.5). The nacre+/- embryos
Table II.5 – Zebrafish strains used for the microinjection of the expression vectors. Expression vector Zebrafish strain pTol2-10xUAS:rSyp-mCherry (a) (b) Tg (Isl3:Gal4+/+) pTol2-10xUAS:rSyp-GCaMP6fEF05 (a) (c) Tg (Isl3:Gal4+/+) pTol2-10xUAS-mScarlet Tg (Isl3:Gal4+/+) pTol2-alpha1Tubulin-mScarlet nacre
+/-(a) Expression vector constructed by Michael Orger’s Laboratory (Champalimaud Centre for the Unknown). (b)
Map in supplement A.7A. (c) Map in supplement A.7B.
2.3.2. Preparation of the injection mixture and needles
Prior to microinjection, an injection mixture with a total volume of 10 µL (made up in E3-Phenol Red, composition in table II.6), containing 18 ng/µL of expression vector (Table II.5) and 100 ng/µL of Tol2 transposase mRNA,was prepared on ice. The injection mixture remained on ice until it was loaded into the microinjection needle. Microinjection needles were previously made from glass capillaries (World Precision Instruments Inc.),using a Laser-Based Micropipette Puller (Sutter Instrument P-2000) with the following settings: heat = 400, filament = 4, velocity = 45, delay = 200 and pull = 100.
2.3.3. Injection
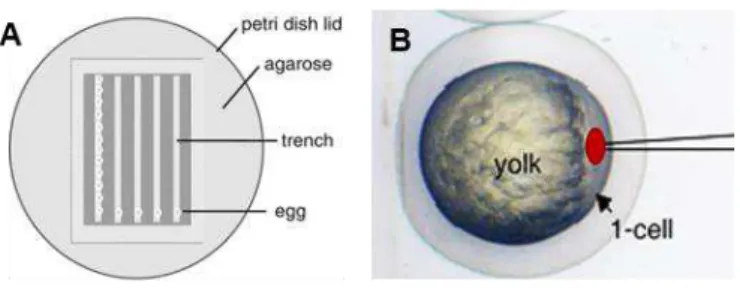
Zebrafish embryos were aligned in the trenches of the injection plate (1% (w/v) agarose in 1x E3) (Figure II.1A) and the surplus water was removed. A needle was loaded with 3 µL of injection mixture and attached to the Pneumatic PicoPump PV 820 (World Precision Instruments Inc.). The tip of the needle was broken using forceps.
Under a stereoscope (Zeiss SteREO Discovery.V8), the injection mixture was microinjected into the cell of each zebrafish embryo (Figure II.B). When all embryos were injected, they were carefully harvested into a petri dish with 1x E3 and incubated at 28°C. In the following day, they were bleached, according to Martins et al.2016 and raised in the fish facility’s main holding room.
2.4. Screening for transient expression
Injected embryos were pre-screened for transient expression of the fluorescent reporter genes between 2-3 dpf, by fluorescence microscopy (Zeiss StrREO Discovery.V8 equipped with PentaFluar). Embryos injected with pTol2-10xUAS:rSyp-GCaMP6fEF05 were screen with a blue filter with a spectrum range from 400-460 nm. Embryos injected with pTol2-10xUAS:rSyp-mCherry, pTol2-10xUAS-mScarlet or pTol2-alpha1Tubulin-mScarlet were screened with a green filter with a spectrum range from 545-606 nm.
Based on fluorescence intensity and expression patterns, positive injected embryos were selected to be raised into adulthood. Embryos were selected for the Isl3(isl3 promoter) and pan-neuronal (alpha-1-Tubulin promoter) expression pattern.
2.5. Screening for stable expression
When the positive injected fish (generation F-1) reached sexual maturity (two to three months), a cross with the same zebrafish strains used for the microinjection was performed. The progeny was screened for stable expression, between 2-3 dpf, by fluorescence microscopy. Positive embryos (F0 generation or founders) were selected to be raised into adulthood, based on fluorescence intensity, expression patterns and percentage of stable transgene integration. Stable transgenic lines were established from selected founders.
2.6. Lipophilic dye labeling
Lipophilic dye labeling is a method that uses lipophilic dyes, such as DiI and DiO, to label the entire retinotectal projection in fixed zebrafish larvae. This technique was used in Isl3:Gal4 10xUAS:rSyp-GCaMP6fEF05 and Isl3:Gal4 10xUAS:rSyp-mCherry fixed larvae. Lipophilic dye labeling was performed according to Hutson et al. 2004.
2.6.1. Preparation
Zebrafish larvae at 6 dpf were euthanized using 300 mg/L 3-amino benzoic acidethylester (tricaine) (composition in table II.6) and fixed overnight at 4°C with 4% paraformaldehyde (PFA). In the following day, the PFA solution was removed and the fixed larvae were washed with 1x Phosphate-Buffered Saline (PBS) (composition in table II.6).
Prior to injection, lipophilic dye solutions were prepared (1% (w/v) DiI (Sigma #42364) or DiO (Sigma #04292) in chloroform (Sigma #77619)) and injection needles were made with the same settings as the microinjection needles (Material and Methods, section 2.3.2).
2.6.2. Labeling
(Invitrogen #16520-050) in 1x PBS). Then, larvae were covered with 1x PBS. An injection needle was loaded with 2 µL of lipophilic dye solution and attached to the Pneumatic PicoPump PV 820. The pipette holder was held in a micromanipulator (Narishige, MN-153). The tip was broken using forceps.
Under a stereoscope, the lipophilic dye solution was injected in the gap between retina and lens (Figure II.2). The injected larvae were washed with 1x PBS and stored in the fridge until imaging.
Figure II.2 – Schematic representation of the lipophilic dye labeling. Dorsal view of the head of a zebrafish larva, showing the injection of the lipophilic dye solution in the gap between retina and lens. Lipophilic dye labels the retinal ganglion cells which projecting in the optic tectum. TeO: optic tectum. A: anterior; P: posterior. Adapted from Poulain et al. 2010.
2.7. Confocal microscopy and image analysis
All zebrafish larvae used were firstly fixed in a PFA solution (Material and Methods, section 2.6.1). Fixed zebrafish larvae were mounted directly on a microscope slide (Menzel-Gläser, 76 x 26 mm), using 1.5% (w/v) low-melting agarose dissolved in 1x PBS. They were positioned as straight as possible in dorsal orientation. After the slide was surrounded by high vacuum grease (Dow corning) and filled with 1x PBS, a coverslip (Menzel-Gläser, 22 x 50 mm) was added. Zebrafish larvae injected with lipophilic dye solution were removed from the agarose plate in order to be mounted in the slide for imaging.
The images were obtained with the Zeiss LSM 710 fluorescence confocal microscope. For imaging, a 25x multi-immersion objective (N.A. 0.8) was used, as well as two lasers: 488 nm and 561 nm. Each slide was placed on the microscope stage and a drop of water was used as the immersion medium. Using the ZEN 2010 software, focal planes were selected and the acquisition parameters (gain, digital gain, digital offset and laser power) were optimized. The zebrafish larva brain was imaged in a stack format. All images were analyzed and treated in the open source software Fiji. For presentation purposes, Z-stack planes were selected, and maximum intensity projection was performed.
Lens Retina
3. Solutions
Table II.6 – Summary of the composition of solutions used in this work. The solutions were prepared at Fish Platform or Glass Wash and Media Preparation Platform.
Working Solutions Total volume and solvent Composition
LB broth
(Sterilized) 500 mL Milli-Q water
1.0% Bactotritone; 0.5% Yeast extract;
0.5% NaCl;
pH 7.0 (adjusted with NaOH 5M) LB broth agar plates
(Sterilized) 500 mL LB broth 1.5% Bacto-agar
50x TAE
(Stock Solution) Fill to 1 L with Milli-Q water
242 g Trizma; 55.1 mL Acetic acid glacial 100 mL EDTA 0.5M (pH 8.0) 1x TAE Fill to 500 mL with Milli-Q water 10mL 50x TAE
pH 8.0 1x TE Fill to 100 mL with Milli-Q water
1 mL 1 M Tris base (pH 8.0) 0.2 mL EDTA 0.5M
pH 8.0 50x E3
(Stock Solution) 2 L Milli-Q water
29.38 g NaCl; 1.26 g KCl; 4.86 g CaCl2.2H2O; 8,14 g MgSO4.7H2O
1x E3 Fill to 20 L with system water
400 mL 50x E3; 60 mL 0.01% Methylene Blue Solution (0.05 g Methylene Blue powder in 500 mL Milli-Q water) E3-PhenolRed
(Filtered) 15 mL 1x E3 0.0025% Phenol Red
25x Tricaine (Stock solution and
Euthanasia)
10 mL 1 M Tris
(1M Tris: 121.14 g Trizma base in 1 L reverse osmosis water; pH 9.0)
2 g tricaine powder; 500 mL reverse osmosis water;
pH 7.0
1x PBS 1 L Milli-Q water
1.44 g Na2HPO4; 0.24 g KH2PO4;
III. Results
A key question in Neuroscience is to understand how the brain integrates sensory inputs and computes a behavioral output. The small size and transparency of zebrafish larvae in combination with the use of genetically encoded fluorescent reporters allow the non-invasive imaging of whole-brain neuronal activity and the study of neuronal circuits and their connectivity. In order to generate transgenic lines expressing genetically encoded fluorescent reporters, fluorescent reporter genes are cloned in plasmid DNA vectors, which are posteriorly injected into one-cell stage zebrafish embryos.
In this work, we constructed two types of expression clones: UASexpression clones, harboring a 10xUAS regulatory sequence, and alpha-1-Tubulin expression clones, harboring the alpha-1-Tubulin putative promoter. Both were generated with two different genetically encoded fluorescent reporter genes: LSSmOrange and mScarlet. The expression clones were then injected into one-cell stage Isl3:Gal4+/+ transgenic or nacre+/- zebrafish embryos to create stable transgenic lines.
1. Construction of UAS expression clones
In order to generate 10xUAS expression clones, we used the Gateway cloning technology (Figure III.1), since it provides a rapid and highly efficient way to transfer one or more DNA fragments into multiple vectors, maintaining the orientation and reading frame (Hartley et al. 2000).
Through LR recombination reaction an entry clone containing 10 repetitions of the UAS sequence (10xUAS) was recombined with a destination vector. Destination vectors were constructed by cloning of LSSmOrange and mScarlet genes into an empty Tol2 Gateway destination vector, that contained Tol2 arms required for transposition in zebrafish embryos, upon microinjection.
1.1. Strategy used for the construction of LSSmOrange and pDestTol2-mScarlet vectors
In order to construct the destination vectors: pDestTol2-LSSmOrange (Supplement A.8A) and pDestTol2-mScarlet (Supplement A.8B), fluorescent reporter genes were isolated by PCR from two commercial vectors: pH2B-LSSmOrangeand pmScarlet_C1. LSSmOrange and mScarlet
genes were amplified using primers (Table II.2 and Table III.1) with specific restriction sites and a functional Kozak sequence upstream of the ATG of the gene of interest. PCR products were separated through agarose gel electrophoresis and posteriorly extracted from agarose gel. PCR fragments and Tol2 Gateway destination vector (backbone) were digested with appropriate restriction endonucleases (Table II.3), creating compatible cohesive ends for ligation of the backbone with PCR-digested products (Figure III.2).
Table III.1 – Primers used for the amplification and subsequent cloning of LSSmOrange and mScarlet genes into a Tol2 Gateway destination vector.
(a) Working annealing temperature (Ta): Annealing temperature – 0.5°C.
Figure III.2 – General cloning strategy for the construction of the destination vectors. Fluorescent reporter genes were isolated from original plasmid by PCR with primers designed to have SpeI and PacI restriction sites flanking the PCR product. PCR fragments were cloned into a Tol2 Gateway destination vector containing the same restriction sites. Cloning strategy of LSSmOrange (A) and
pDestTol2-Primer Template Target Ta (°C) (a) DNA Polymerase
DNA fragment size (bp) SpeI-kz-LSSmOrange_Fw
pH2B-LSSmOrange LSSmOrange 68.3
Phusion DNA
Polymerase 735 PacI-Stop-LSSmOrange_Rv
SpeI-kz-mScarlet_Fw
pmScarlet_C1 mScarlet 67.2 Phusion DNA
To confirm successful cloning, pDestTol2-LSSmOrange and pDestTol2-mScarlet vectors were digested with restriction endonucleases (BstXI and NotI, respectively). Restriction profiles were analyzed on agarose gel (Figure III.3A-B) and correct sequence was confirmed by sequencing.
pDestTol2-LSSmOrange vector was expected to be cut 3 times by BstXI restriction endonuclease, originating 3 bands in the agarose gel with 724 bp, 1455 bp and 3758 bp. As shown in the figure III.3A, only clone #1 has the expected size and number of fragments. pDestTol2-mScarlet vector was expected to be cut twice by NotI restriction endonuclease, originating 2 bands in the agarose gel with 2104 bp and 3821 bp. As shown in the figure III.3B, only the clones #1 and #4 are positive for the presence of the insert.
Positive clones were sequenced, and the resulting sequences were compared against the expected ones, using SnapGene (Figure III.3C-D). Figure III.3C-Dconfirms the presence of the
LSSmOrange and mScarlet genes into the Tol2 Gateway destination vector and the absence of mutations in these genes, potentially introduced by the DNA Polymerase in the PCR.
1.2. Strategy used for the construction of 10xUAS-LSSmOrange and pTol2-10xUAS-mScarlet expression clones
In order to generate LSSmOrange (Supplement A.9A) and pTol2-10xUAS-mScarlet (Supplement A.9B) expression clones, a LR recombination reaction was performed between the destination vectors constructed and a preexistent 10xUAS entry clone (Figure III.4).
Figure III.4 – General cloning strategy for the construction of the 10xUAS expression clones. Recombination between the destination vectors previously constructed and an entry clone with the 10xUAS regulatory sequence, through LR recombination reaction. Cloning strategy of the pTol2-10xUAS-LSSmOrange(A) and pTol2-10xUAS-mScarlet (B) expression clones.
To confirm successful cloning, pTol2-10xUAS-LSSmOrange and pTol2-10xUAS-mScarlet vectors were digested with SacI-HF restriction endonuclease. Restriction profiles were analyzed on agarose gel (Figure III.5A-A’) and correct sequence was confirmed by sequencing.
Both vectors were expected to have 2 sites of recognition by SacI-HF restriction endonuclease, originating 2 bands in agarose gel. That way, bands of 809 bp and 3838 bp were expected for pTol2-10xUAS-LSSmOrange and bands of 797 bp and 3838 bp for pTol2-10xUAS-mScarlet. As shown in figure III.5A-A’, all clones have the expected size and number of fragments.
Only one clone of each expression clone was selected to be sequenced. The resulting sequences were compared against the expected ones, using SnapGene (Figure III.5B-C). The sequencing confirms the absence of mutations in LSSmOrange and mScarlet genes. Upon confirmation of the correct sequence, the expression vectors were purified for posterior injection in Isl3:Gal4+/+
Figure III.5 – Restriction profiles on agarose gel and sequencing results of the 10xUAS expression clones. (A-A’) Restriction profile of the digested pTol2-10xUAS-LSSmOrange and pTol2-10xUAS-mScarlet expression clones with SacI-HF restriction endonuclease. The dashed box represents the low molecular weight faint bands. Although the molecular weight ladder is not visible, it was used GeneRuler 1 Kb DNA ladder (Supplement A.3). Photo of the restriction profile with low (A) and high (A’) exposure for better visualization of faint bands. (B-C) Comparison of sequencing results (top red arrows) of pTol2-10xUAS-LSSmOrange clone #3 (B) and pTol2-10xUAS-mScarlet clone #3 (C) against the expected sequence, using SnapGene. In both cases, SV40_Rv primer (Table II.4) was used for sequencing.
2. Construction of
alpha-1-Tubulin
expression clones
In order to generate alpha-1-Tubulin expression clones we performed Gibson Assembly to seamlessly join two fragments: alpha-1-Tubulin putative promotor and fluorescent reporter gene. Gibson Assembly is an efficient and robust cloning procedure that allows assembling multiple overlapping DNA fragments (Figure III.6A), regardless of fragment length or end compatibility (Gibson et al. 2009).