Pancreas Histological Images for Glucose Intolerance
Identification
Tathagata Bandyopadhyay1, Shyamali Mitra2, Sreetama Mitra1, Nibaran Das4, Luis Miguel Rato3
, and Mrinal Kanti Naskar2
1School of Computer Engineering, KIIT University, Bhubaneswar, India
2 Department of Electronics and Telecommunication Engineering, Jadavpur University, India 3Department of Informatics, University of Evora, Portugal
4 Department of Computer Science and Engineering, Jadavpur University, India
Abstract. This paper describes a novel fast algorithm for automatic segmentation
of islets of Langerhans and β-cell region from pancreas histological images for automatic identification of glucose intolerance. Here LUV color space and con-nected component analysis are used on 134 images among which 56 are of nor-mal and rest 78 are of pre-diabetic type. The paper also talks about a supervised learning approach for classifying the images based on their morphological fea-tures. In the present work we have introduced a modern classifier weighted ELM (Extreme Learning Machine) for Prediabetes identification. Performances of weighted ELM are comparable with all the present day’s robust classifiers such as Support Vector Machines (SVM), Multilayer Perceptron (MLP) etc. We have also compared the result with traditional ELM and observed better performance in the present skewed dataset with substantial improvement in training time.
Keywords: Automatic Segmentation, Histological image, Islets of Langerhans,
β-cell, Diabetes, Computerized Diagnostic System,Extreme Learning Machine.
1
Introduction
In present days, diabetes is prevalent among most of the people in the world [1]. If not controlled at the right time it can lead to multi-organ failure and eventually death. Ge-netic factors coupled with environmental influences, rising living standards, lifestyle changes are the causes of diabetes. Mortality due to diabetes and its potential compli-cations are enormous. Therefore, it is commonly known as silent killer. So proper iden-tification and treatment at early stage is very important. Generally, diabetes refers to body’s inability to produce insulin hormone with consequent abnormal metabolism of carbohydrate and an elevated level of glucose in blood. Glucose intolerant condition also refers to increased level of glucose in blood but here the amount of glucose is less than that of diabetic condition [2]. In other words, it can be said that glucose intolerant
is a precondition of diabetes and thus by detecting this we can detect the subjects prone to diabetes. In glucose intolerant rats, an auto immune β-cell destruction happens in pancreas [3], which leads to morphological changes in the pancreas histological images and thus opens the way of image based computerized pre-diabetic diagnostic system.
Computerized and image based diabetes diagnostic system has its foundation on three pillars: a) Segmentation of islets of Langerhans area and insulin positive β-cell area [4], b) Feature extraction from those segmented regions c) Classification of the images based on extracted features. Segmentation refers to the process of separating out the islets of Langerhans and β-cell region from the microscopic slide image. Rato et al. described a manual segmentation method using ImageJ [5]. Although manual segmentation is very precise, it is tiresome and time taking process and due to its requirement of human intervention it incurs dependency on expertise and experience level of the analyst. This motivated the researchers to develop and use fully automated segmentation algorithms to solve the said segmentation problem. In [6–8]. different colour based segmentation approaches were proposed for automated separation and quantification of insulin stained β-cell regions respectively. Colour based segmentation approach works very well in segmenting the β-cell region as it significantly differs in colour stain from the surrounding regions. But, segmentation of the Islets of Langerhans region is much more challenging due to its colour similarity with the background and thus only colour based segmentation method is not capable enough in this case. Hongyu et al. [9] proposed connected component analysis and active contour model for automatically segment out the islets area. Corrine et al. also used active contour model but with level set method for initialization of the contour [10]. Active contour model does not work well in case of noisy images [11] and also this algorithm is computationally complex. Bandyopadhyay et al. in [3] proposed wavelet decomposition based segmentation methodology, but its huge processing time per image limits its applicability in real life. In the present work, we have introduced an huge improvement with respect of time over the approach [3] by using LUV colour space transform instead of wavelet decomposition used there.
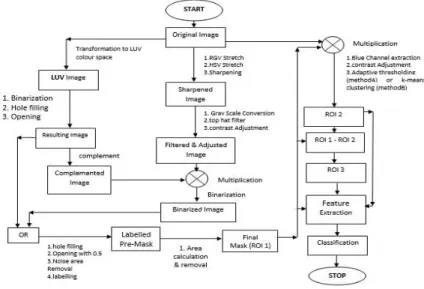
In this paper, we propose a much simpler and fast segmentation method for both the β-cell and islets of Langerhans regions, based on colour space transform and connected component analysis. After segmentation we extracted morphological features and used classifier like Extreme Learning Machine (ELM), Support Vector Machine (SVM) etc to classify the images as normal and pre-diabetic (i.e. it is a binary classification problem). Input RGB image is transformed to LUV colour space for segmenting out the β-cell regions. Again, colour stretching and thresholding are used to identify the islets of Langerhans regions. Finally connected component analysis is done to segment out the islets including the β-cell regions. Based on the algorithm used for β-cell segmentation we differentiate in methods namely method A and method B which will be discussed in details in the Image Segmentation subsection of the Proposed Methodology section. Total six features are used in various combinations and will be discussed in details in the Feature Extraction subsection of the Proposed Methodology section. For classification our focus is on the relatively new classifier ELM. As our dataset is imbalanced we have used weighted regularized ELM. Results is compared with basic ELM and wildly used classifiers like SVM and MLP.
This paper is organized in five sections including this introduction as the first section. Experimental setup like data set description, hardware and software configuration etc. are described in section two. Section three sheds light on the proposed approach. Results and discussion are there in section four. Finally, we conclude in the section five.
2
Experimental Setup
In this work, an image dataset of pancreas histological images of Wister Rats has been used. The data set is collected from Department of Biology, University of Evora, Por-tugal and it contains 134 colour (RGB) pancreas histological images of Wister Rats, among which 56 are of Normal rats and rest 78 are of pre-diabetic or diabetic prone rats. Each of the image is of size 1280x960 pixels with both horizontal and vertical resolution 72 dpi and bit depth 24. Matlab 2014Ra is used for image segmentation, feature extraction, ELM and WELM. For SVM and MLP Weka 3.8 is used.
2.1 Proposed Methodology
As mentioned earlier, our approach consists of three phases which are: i) Image Seg-mentation, ii) Feature Extraction and iii) Classification. Among these, we have mostly contributed in first two phases.
2.2 Image Segmentation
Here, in our study, there are three regions of interest which are: i) the region which covers total islets of Langerhans including insulin positive β-cell areas (roi1), ii) the region which includes only the insulin positive β-cell areas (roi2) and iii) region con-taining the islets of Langerhans excluding the insulin positive β-cell areas (roi3). Seg-mentation process of roi1, roi2 and roi3 are discussed below:
ROI 1 Segmentation
In this study we have used colour space transform and connected component analysis to do this segmentation. First, the original RGB image (I) is transformed to LUV colour space using matlab inbuilt function. LUV transformation is done because it can clearly distinguish the bluish background and the reddish brown β-cell region. Then LUV im-age is then converted to Binary. Hole filling and opening is done to remove spurious areas. The resulting image is named I1. Then complement of I1 is taken and it is named I1’.
The blue shade in both the region in the original image(I) (islets of Langerhans and background) makes the task of separation difficult using colour segmentation. So, RGB stretching, HSV stretching and Sharpening are done on image I to enhance the fine shade difference between the regions. Resulting image is called I2. Top hat filtering is done on the grayscale converted image of I2 to remove an approximate background. Adjusting contrast of the resulting image we obtain image I3.
Image I3 is multiplied with image I1’ to mask out the β-cell region and concentrate only on the surrounding Islets of Langerhans region. Resulting image is converted to binary to obtain I4. Logical OR operation is done on I1 and I4 to merge both the regions namely Islets of Langerhans region and β-cell region. After hole filling and opening (done to remove thin connection) and noise area (very small regions) removal resulting image is labelled to name each of its connected components with numbers. Thus we obtain labelled premask (Ipremask). Now final mask or ROI 1 is generated keeping the largest connected area in Ipremask. This is done under the assumption, which is made based on the images of our data set, that this region of interest will occupy larger area than the different noise areas in the background.
Fig. 1. Flowchart of the Proposed Method ROI 2 and ROI 3 Segmentation.
ROI 2 refers to only the insulin positive reddish brown β-cell region excluding the rest of the islets of Langerhans both inside and outside. Though LUV colour space trans-form approximately identifies the β-cell regions, it fails to exclude non β-cell portions of islets inside the β-cell portions. To address this issue we have used two different approaches namely i) Method A and ii) Method B. Method A uses median filtering based adaptive thresholding to separate out the β-cells from the inside non β-cells, whereas Method B uses k-means clustering to cluster the different colour shades and thus making the separation task very easy just by using the cluster indices.
IROI1 is multiplied with original image I. This is followed by blue channel extrac-tion, contrast adjustment. Then the resulting image is processed with Method A and Method B as discussed above to do the segmentation. We report the results for both Method A and Method B in the results section.
After segmentation of ROI 1 and ROI 2, ROI 3 can be easily obtained by subtracting ROI 2 from ROI 1.
2.3 Feature Extraction
We have used six features each of length one in different combinations. The features are: i) β-cell area to islets area ratio (F1), ii) α-cell area to islets area ratio (F2), iii) perimeter per area (ppa) ratio (F3), chi-square distances of the histograms of red (iv), green (v) and blue (vi) channel between β-cell and α-cell regions and are denoted by F4, F5 and F6 respectively. Three combinations of the features namely C1, C2 and C3 are used with taking {F1, F2, F3}, {F4, F5, F6} and {F1, F2, F3, F4, F5, F6} respec-tively.
To extract the features F1, F2 and F3 first, area (number of ON pixel in the region) of ROI 1, ROI 2 and ROI 3 have been calculated and these are named as A1, A 2 and A3 respectively. Also the perimeter of ROI 1 is calculated and its value is denoted by P. Now features are calculated as per the following formulae:
𝐹1=𝐴3 𝐴1, 𝐹2= 𝐴2 𝐴1, 𝐹3= 𝑃 𝐴1
Where 𝐹1, 𝐹2 and 𝐹3 are three feature values.
Calculation of the last three features is much more straight forward. For all three (Red, Green, Blue) channels of the β-cell and α-cell regions histograms are calculated. Then channel wise chi-squared distance is calculated between the histograms of these two regions and thus F4, F5 and F6 features are formed.
2.4 Classification
Classification refers to the task of categorizing the data in some categories or classes. In this study, our task is to classify the images into two classes namely Normal and Pre-diabetic which corresponds to normal and Pre-diabetic prone rats respectively. To address this binary classification problem, we have used SVM, MLP, ELM and Regularized ELM [12] classifiers. For MLP and SVM we have used Weka 3.8 tool. MLP is used with default Weka 3.8 configuration. For SVM we have used nu-SVC with linear kernel keeping other parameter as Weka 3.8 default. ELM and Regularized ELM (WELM) are done in Matlab. For ELM we have empirically used 11 hidden nodes and for WELM we have empirically used NxN version with 300 hidden nodes and with a C value equals to 227. For each of the classifiers 80% of the data is used for training and rest 20% is used for testing.
3
Results and Discussion
As our present work involves two major stages namely segmentation and classifica-tion, our results are also of two folds. Fig. 2 shows some segmented images along with its original one to compare our segmentation performance with the previous works. It clearly shows that our segmentation result is closely in line with the ground truth pro-duced by Rato et al. in [5].
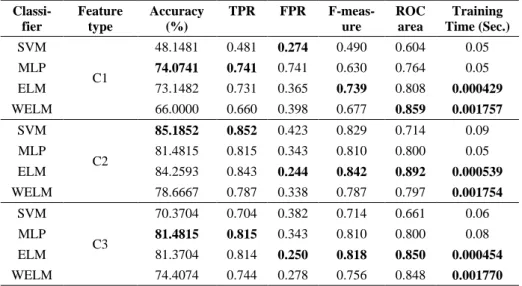
Table 1. Classification results for method A. The bold indicates the maximum in respective areas Classi-fier Feature Type Accuracy (%) TPR FPR
F-meas-ure ROC area
Training Time (Sec.) SVM C1 74.0741 0.741 0.462 0.734 0.639 0.07 MLP 77.7778 0.778 0.078 0.792 0.836 0.05 ELM 76.8519 0.769 0.169 0.782 0.845 0.000547 WELM 74.0741 0.741 0.186 0.756 0.845 0.00182 SVM C2 40.7407 0.407 0.579 0.441 0.414 0.08 MLP 77.7778 0.778 0.635 0.709 0.614 0.05 ELM 72.4815 0.725 0.572 0.697 0.564 0.000964 WELM 69.2593 0.693 0.600 0.670 0.465 0.001813 SVM C3 77.7778 0.778 0.171 0.790 0.804 0.11 MLP 70.3704 0.704 0.197 0.722 0.907 0.08 ELM 75.5556 0.756 0.297 0.764 0.819 0.000467 WELM 81.1111 0.811 0.161 0.820 0.879 0.001755
As stated earlier, we have used three different types feature combinations on the segmented images using method A and B by the proposed algorithm. To compare the performance, we have used four different classifiers namely SVM, MLP, ELM, WELM. The results are shown in Table 1 and Table 2. It is observed from Table 1 that weighted ELM performs better than other methods in terms of accuracy for method A. From Table 2, we can see that SVM for feature combination C2 outperforms other methods and achieved a maximum recognition accuracy of 85.1852%, whereas ELM requires least training time for all feature types and classifiers Fig 3. Shows the com-parison between method A and method B for different classifiers in-terms of ROC area.
Fig. 2. Comparison of Segmentation result with previous methods 1) original image, 2)
manual segmentation by Rato et al.[5], 3) Automatic segmentation by Bandyopadhyay et al.[3], 4) Automatic segmentation by proposed method
Fig. 3. ROC area comparison for best feature combination #3
Table 2. Classification results for method B. The bold indicates the maximum in respective areas Classi-fier Feature type Accuracy (%) TPR FPR F-meas-ure ROC area Training Time (Sec.) SVM C1 48.1481 0.481 0.274 0.490 0.604 0.05 MLP 74.0741 0.741 0.741 0.630 0.764 0.05 ELM 73.1482 0.731 0.365 0.739 0.808 0.000429 WELM 66.0000 0.660 0.398 0.677 0.859 0.001757 SVM C2 85.1852 0.852 0.423 0.829 0.714 0.09 MLP 81.4815 0.815 0.343 0.810 0.800 0.05 ELM 84.2593 0.843 0.244 0.842 0.892 0.000539 WELM 78.6667 0.787 0.338 0.787 0.797 0.001754 SVM C3 70.3704 0.704 0.382 0.714 0.661 0.06 MLP 81.4815 0.815 0.343 0.810 0.800 0.08 ELM 81.3704 0.814 0.250 0.818 0.850 0.000454 WELM 74.4074 0.744 0.278 0.756 0.848 0.001770
4
Conclusion
In the present work, we have introduced a fast automatic segmentation of islets of Langerhans and β-cell region from pancreas histological images. The automatic accu-rate segmentation helps to improvise the performance of identification of glucose in-tolerance to distinguish normal and pre-diabetic images. The segmentation is challeng-ing due to havchalleng-ing minute morphological differences between those images of normal and pdiabetic cases. The present method is an improvement over the previously re-ported method in terms of both accuracy and time. The achieved recognition accuracy is 0.85% higher than the accuracy achieved by [4][3]. Also, our earlier method in [4][3], used to take approximately 5400 seconds (90 minutes) for segmenting each image, whereas the present method just takes approximately 30 seconds per image for auto-mated segmentation, producing 99.44% reduction in segmentation time. Thus, present
technique is better and helps to save time for automatic recognition of glucose intoler-ance. Introduction of more robust feature and deep learning may improve the result further.
ACKNOWLEDGMENTS
The authors thank Professor Fernando Capela e Silva, from the Department of Biology and Ana R. Costa and Célia M. Antunes, from the Department of Chemistry, University of Évora, Portugal, for the data set used in this article.
References
1. World Health Organization (WHO) (2004) Disease incidence, prevalence and disability 2. Wondermom, Newbie (2003) HealthBoards message. http://www.healthboards.com /boards
/diabetes/39426-what-differance-between-glucose-intolerant-diabetes.html. Accessed 30 Oct 2017
3. Bandyopadhyay T, Mitra S, Mitra S, et al (2017) Analysis of Pancreas Histological Images for Glucose Intolerance Identification Using Wavelet Decomposition. In: Satapathy SC, Bhateja V, Udgata SK, Pattnaik PK (eds) Proceedings of the 5th International Conference on Frontiers in Intelligent Computing: Theory and Applications : FICTA 2016, Volume 1. Springer Singapore, Singapore, pp 653–661
4. Kakimoto T, Kimata H, Iwasaki S, et al (2012) Automated recognition of pancreatic islets in Zucker diabetic fatty rats treated with exendin-4. J Endocrinol 216:1–24
5. Rato LM, Silva FC e, Costa AR, Antunes CM (2013) Analysis of pancreas histological images for glucose intolerance identification using imagej-preliminary results. In: 4th Eccomas Thematic Conference on Computational Vision and Medical Image Processing (VipIMAGE). CRC Press, pp 319–322
6. Rojo MG, Bueno G, Slodkowska J (2009) Review of imaging solutions for integrated quantitative immunohistochemistry in the Pathology daily practice. Folia Histochem Cytobiol 47:349–354
7. Prasad K, Prabhu GK (2012) Image analysis tools for evaluation of microscopic views of immunohistochemically stained specimen in medical research--a review. J Med Syst 36:2621–2631
8. Isse K, Lesniak A, Grama K, et al (2012) Digital transplantation pathology: combining whole slide imaging, multiplex staining and automated image analysis. Am J Transplant 12:27–37
9. Chen H, Martin B, Cai H, et al (2013) Pancreas++: automated quantification of pancreatic islet cells in microscopy images. Front Physiol 3:482
10. Berclaz C, Goulley J, Villiger M, et al (2012) Diabetes imaging—quantitative assessment of islets of Langerhans distribution in murine pancreas using extended-focus optical coherence microscopy. Biomed Opt Express 3:1365–1380
11. Aswathy MA, Jagannath M (2017) Detection of breast cancer on digital histopathology images: present status and future possibilities. Informatics Med Unlocked 8:74–79. 12. Zong, W., Huang, G. B., & Chen, Y. (2013). Weighted extreme learning machine for
![Fig. 2. Comparison of Segmentation result with previous methods 1) original image, 2) manual segmentation by Rato et al.[5], 3) Automatic segmentation by Bandyopadhyay](https://thumb-eu.123doks.com/thumbv2/123dok_br/15562106.1046938/6.892.187.706.267.540/comparison-segmentation-previous-original-segmentation-automatic-segmentation-bandyopadhyay.webp)