i
UNDERSTANDING THE IMPORTANCE OF TRUST
AND PERCEIVED RISK TO THE ADOPTION OF
AUTOMATED DRIVING SYSTEMS
Madalena de Carvalho Rodrigues
Dissertation presented as partial requirement for obtaining
the Master’s degree in Information Management
ii
NOVA Information Management School
Instituto Superior de Estatística e Gestão de Informação
Universidade Nova de Lisboa
UNDERSTANDING THE IMPORTANCE OF TRUST AND PERCEIVED
RISK TO THE ADOPTION OF AUTOMATED DRIVING SYSTEMS
by
Madalena de Carvalho Rodrigues
Dissertation presented as partial requirement for obtaining the Master’s degree in Information Management, with a specialization in Marketing Intelligence
Advisor: PhD Frederico Jesus Co Advisor: PhD Carlos Tam Vai
iii
ACKNOWLEDGEMENTS
To my advisors PhD Frederico Jesus, PhD Carlos Tam Vai, my sincere thanks for sharing of knowledge, experience and advice. To my mom and dad, who supported me emotionally, and financially, and respected my choices. To my friends, Vicente Cavaleiro Costa and Carolina Costa Marques, my dearest appreciation for incentivizing me and for working alongside with me.
iv
ABSTRACT
Automated Driving Systems (ADS) have piqued interest among researchers over the last few years. Notwithstanding, this technology is very new and therefore people are far from sold on the safety, or benefits of ADS, leading to uncertainty and distrust. This study extends the line of research by conjointly examining trust, risk and adoption theories in the pre-adoption stage of ADS. We developed a study among 311 European consumers using PLS-SEM. Results reveal that perceived behavioral control, performance expectancy and trust are salient antecedents of intention to use ADS, while perceived risk is not. Implications for practice and research are discussed.
KEYWORDS
Automated driving systems; Trust; Perceived risk; Perceived behavioral control; Behavioral intention to use ADS.
v
INDEX
1.
Introduction ... 1
2.
Theoretical Background ... 3
2.1.
Automation in the context of driving ... 3
2.2.
Trust ... 5
2.3.
Perceived Risk and consumer behavior ... 9
2.4.
Technology acceptance ... 9
2.5.
Other relevant theories ... 10
3.
Research Model And Hypothesis ... 11
3.1.
Research Model ... 11
3.2.
Hypotheses ... 11
4.
Methodology ... 14
4.1.
Measurement ... 14
4.2.
Data ... 14
5.
Results ... 15
5.1.
Measurement Model ... 15
5.2.
Structural Model ... 15
6.
Discussion ... 19
6.1.
Theoretical Contributions ... 20
6.2.
Managerial implications ... 21
6.3.
Limitations and future research ... 22
7.
Conclusions ... 23
8.
References ... 24
9.
Appendixes ... 33
vi
LIST OF FIGURES
Figure 1 - Conceptual model ... 11
Figure 2 - Structural model results with path coefficients, r-squares and p-values ... 16
Figure 3- Structural model results for model 1 and model 2 ... 19
vii
LIST OF TABLES
Table 1 -SAE International levels for vehicle automation ... 4
Table 2- Trust definitions based on previous research ... 6
Table 3- A Summary of selected studies in technology innovations and trust - Constructs and
main findings ... 7
Table 4 - PLS loadings and cross-loadings ... 16
Table 5 - Means, standard deviations, correlations, and reliability and validity measures (CR,
CA, and AVE) of latent variables ... 17
Table 6 - Results of hypotheses tests ... 18
viii
LIST OF ABBREVIATIONS AND ACRONYMS
ACC Adaptive Cruise ControlADS Automated Driving Systems
AI Artificial Intelligence
AU Actual Usage
BI Behavioral Intention
BIU Behavioral Intention to Use
DDT Dynamic Driving Task
EPS Electronic Payment Systems
IDT Innovation Diffusion Theory
IS Information Systems
IT Information Technology
LKS Lane-Keeping System
NHTSA National Highway Traffic Safety Administration
NMVCCS National Motor Vehicle Crash Causation Survey
PBC Perceived Behavioral Control
PE Performance Expectancy
PEU Perceived Ease of Use
PLS Partial Least Squares
PR Perceived Risk
PU Perceived Usefulness
SAE Society of Automotive Engineers
SCT Social Cognitive Theory
SE Self-Efficacy
ix
TAM Technology Acceptance Model
TPB Theory of Planned Behavior
TRA Theory of Reasoned Action
TRU Trust
1
1. INTRODUCTION
Automated and connected vehicle technologies are one of the most heavily researched automotive technologies nowadays (Brummelen, Brien, Gruyer, & Najjaran, 2018; Kloostra & Roorda, 2019; Liljamo, Liimatainen, & Pöllänen, 2018; Nordhoff, Winter, & Kyriakidis, 2018; Straub & Schaefer, 2018). Modern vehicles combine several technologies from different disciplines, namely, computer science, engineering, and robotics, that permit the surveillance of the environment, thereby classifying the types of objects that cross their path, making predictions about the change of environment and planning for a course that obeys the rules of the road (Campbell, Egerstedt, How, & Murray, 2010).
Traffic safety and congestion are the main transportation concerns in many regions around the world. In accordance with the National Motor Vehicle Crash Causation Survey (NMVCCS), conducted from 2005 to 2007, 94% of all crashes involving light vehicles were associated with driver-related critical reasons (NHTSA, n.d.), and the increasing number of private vehicles is worsening traffic congestion and environmental pollution. The emergence of Automated Driving Systems (ADS) provides travelers with an alternative, safer and more sustainable transportation mode (Jing, Huang, Ran, Zhan, & Shi, 2019). By 2050, about two-thirds of the world’s population is expected to be living in urban areas, which threatens the sustainability and viability of living in city centers in terms of public space, vehicle ownership, insurance, parking costs, pollution and congestion (Walker & Marchau, 2017). Since 2004 large European capitals, like London (United Kingdom), Paris (France) and Lisbon (Portugal) have been implementing initiatives aimed at discouraging the use of older, more polluting vehicles driving into and within the central and historical centers of the cities to prevent cities reaching their limits in terms of the concentration of fuel gases, traffic and car capacity. With these laws, vehicles that drive within the reduced emission zones of the city need to meet minimum Euro emission standards. If not, they have to pay an additional daily charge or face the possibility of being fined (“Pollution: cars older than 1997 will be banned from Paris,” 2016; “Reduced emission zones,” 2014; “T-Charge and air quality,” 2018). At the same time, trends are changing; people increasingly value technology and spend considerable time on their smartphones (Frey, Xu, & Ilic, 2017; Gausemeier, Seidel, Riedelsheimer, & Seliger, 2015). The use of wireless devices and passenger related distractions are the most frequent causes of driver inattention (Blaschke, Breyer, Färber, Freyer, & Limbacher, 2009). Klauer et al., (2006) show what kind of activities drivers engage in and what the likelihood of accidents for each kind of secondary task is in their research. In almost 80% of crashes and 65% of near-crashes the driver exhibits inattentive behavior. In most of these cases, a non-driving related task abstracted the driver. The debate surrounding vehicle automation fosters expectations that ADS will require little to no human intervention and will create an opportunity for work, leisure, or social time during travels. Besides, ADS have the potential to reduce the cost of travel by endorsing increased vehicle utilization, reduced demand for urban parking, and pollution (with electric vehicles) (Rossi, Zhang, Hindy, & Pavone, 2018), as well as promoting the adoption of car sharing and on-demand mobility services (Wadud, Mackenzie, & Leiby, 2016) and making private vehicle travel accessible to demographic groups such as the elderly, younger or disabled people (Harper, Hendrickson, Mangones, & Samaras, 2016). However the benefits highlighted in previous studies (see, e.g., Brandon & Sivak, 2014; Chan, 2017; Litman, 2015; US Department of Transportation, 2015), implementation is still a question mark, since it is associated with many uncertainties, namely public acceptance. Thus, their full
2 potential may be unreached. Hence, we believe this work presents a significant contribution to the normative information systems (IS) literature and industry, as it develops and empirically tests a research model on the antecedents of ADS adoption. We expect to answer the following research questions:
(1) How do trust and risk perceptions at an individual level influence the acceptance of ADS?; (2) Is perceived risk a barrier in the intention to adopt ADS?; and
(3) What factors most contribute to the intention to adopt ADS?
In answering these questions, this study is organized as follows: Section 2 provides the literature review and theoretical background; Section 3 presents our conceptual model and hypotheses; Section 4 explains the methodology while section 5 details the results. Section 6 contains the conclusion, theoretical contributions, managerial implications and limitations and, finally, we close with a conclusion in section 7.
3
2. THEORETICAL BACKGROUND
2.1.
A
UTOMATION IN THE CONTEXT OF DRIVINGAutomation can be defined as “technology that actively selects data, transforms information, makes decisions, or controls processes” (J. D. Lee & See, 2004). One of the primary values of automation is its ability to perform complex, repetitive tasks quickly minimizing errors (Hoffman, Johnson, Bradshaw, & Underbrink, 2013). Systems that combine both human and machine can be extremely efficient because they give people the freedom to focus attention where it is needed. Today, different automated systems perform countless tasks for which humans once held responsibility.
Nowadays, drivers can purchase cars with different automated driving features, such as Adaptive Cruise Control (ACC) or a Lane Keeping System (LKS), which makes the driving partially automated. They use a combination of advanced sensors, such as stereo cameras, radar, combined with actuators, control units, and integrated software, to enable cars to monitor and respond to their surroundings (Silberg & Wallace, 2012). ACC automatically manages longitudinal control of the vehicle to achieve driver-selected values for speed and following headway as well as bringing the car to a complete stop without driver intervention. We can see full ACC on BMW series 5, 6 and 7 and the Mercedes Benz S and CL-class, (Jamson, Merat, Carsten, & Lai, 2013). Likewise, an LKS provides the driver information about the invasion of road boundaries either by making the steering wheel vibrate or by gently moving it to maintain itself in the lane. Indeed, the driver is assisted, and sometimes substituted, by an electronic system to perform some of the driving tasks. The objective of automated driving features is to support drivers in mastering the driving task. While doing it, they can affect people in both a negative way, when individuals feel they lose the “joy of driving”, removing the feeling of mastering, controlling, being in charge and being one with the car (Eckoldt, Knobel, Hassenzahl, & Schumann, 2012), or in a positive way, when it produces “joy while driving”, allowing the driver to engage in pleasurable activities beyond driving (Silberg & Wallace, 2012).
A distinction must be made between the different levels of automation in driving. Some have what is called partially automated driving and others highly to fully automated driving (see, e.g., Jamson et al., 2013; Payre, Cestac, & Delhomme, 2014). Australia’s National Transport Commission, the UK’s Department for Transport, the US National Highway Traffic Safety Administration (NHTSA), the Government of Ontario, Canada and the European Road Transport Research Advisory Council have adopted the six levels of automation for on-road motor vehicles from the Society of Automotive Engineers (SAE) (Gandia et al., 2019; Taeihagh & Lim, 2018). They are based on a taxonomy for motor vehicle driving automation systems that take part of the dynamic driving task (DDT) and range from no driving automation (level 0) to full driving automation (level 5) (SAE International, 2016). The description is provided in Table 1.
4 Table 1 -SAE International levels for vehicle automation
SAE level
Name Narrative definition Execution of Steering and
Acceleration/Deceleration Monito-ring of Driving Environ-ment Fallback Perfor-mance of Dynamic Driving Task System Capability (Driving Modes)
The human driver monitors the driving environment
0 No
Automation
The full-time performance by the human driver of all aspects of the DDT, even when enhanced by warning or intervention systems.
Human driver Human
driver Human driver n/a 1 Driver Assistance
The driving mode-specific execution by a driver assistance system of either steering or acceleration/deceleration using information about the driving environment and with the
expectation that the human driver performs all remaining aspects of the DDT.
Human driver and system Human
driver Human driver Some driving modes 2 Partial Automation
The driving mode-specific execution by one or more ADS of both steering and acceleration/deceleration using information about the driving environment and with the expectation that the human driver performs all remaining aspects of the DDT. System Human driver Human driver Some driving modes
Automated driving system –ADS, the “system” monitors the driving environment
3 Conditional
Automation
The driving mode-specific
performance by an ADS of all aspects of the DDT with the expectation that the human driver will respond appropriately to a request to intervene.
System System Human
Driver Some driving modes 4 High Automation
The driving mode-specific
performance by an ADS of all aspects of the DDT, even if a human driver does not respond appropriately to a request to intervene.
System System System Some
driving modes
5 Full
Automation
The full-time performance by an ADS of all aspects of the DDT under all roadway and environmental conditions that can be managed by a human driver.
System System System All driving
5 In the new era of automobiles, "autonomous" and "automated," as well as "self-driving" and "driverless," are terms often used (Gandia et al., 2019). Though they are perceived to be the same thing to most people, they present key differences in meaning that need to be clarified. Generally, the difference between automated and autonomous is the degree of human intervention. “Self-driving”, also known as “automated” is Level 4 or below, which means that some of the safety critical control functions (e.g., steering, throttle, or braking) occur without direct driver input (Talebpour & Mahmassani, 2016) but the driver is still responsible for handling all remaining aspects of the DDT. “Driverless” or “or autonomous vehicle” is Level 5 (full automation) and only at this level is the vehicle expected to drive itself under all environmental conditions (Taeihagh & Lim, 2018). Not only can a vehicle at Level 5 fully monitor what is happening around it and react safely, but it can do so without human input. In fact, such cars in the future may not have steering wheels and pedals (Schaefer & Straub, 2016; Straub & Schaefer, 2018). Therefore, the driver can engage in other tasks while inside the vehicle, leading to enhanced individual performance as well as increased in-vehicle performance, especially for long journey commuters.
SAE introduced the concept of “Automated Driving Systems” (ADS) to refer to vehicles with different automation levels and avoid multiple definitions with ambiguous meanings (Gandia et al., 2019). This definition can be used to describe the automation of (1) on-road vehicles; (2) particular systems within those vehicles; and (3) the operation of those vehicles, and it refers exclusively to SAE’s highest three levels of automation (Level 3 “conditional”, Level 4 “high” and Level 5 “full”), in which the DDT is performed entirely by an ADS during a given driving mode or route (SAE International, 2016). These levels are the focus of this work since they represent a greater disruption in society.
2.2. T
RUSTTrust (TRU) is crucial in many relationships, especially those containing an element of risk (Luo, Li, Zhang, & Shim, 2010). Besides the role of mitigating risks, TRU also enhances an individual's expected usefulness or performance of a product or service (Luo et al., 2010). As Lee & See, (2004) professed, “as computer technology grows more pervasive, TRU is also likely to become a critical factor in consumer products, such as home automation, personal robots, and automotive automation.” TRU has been explored and used in literature extensively and defined differently in many studies, as we can observe in Table 2.
6 Table 2- Trust definitions based on previous research
Source Trust Definition
(Rotter, Julian, 1967) Interpersonal TRU is an expectancy held by an individual or a group that the word, promise,
verbal or written statement of another individual or group can be relied upon. (Lewis & Weigert,
1985)
TRU exists in a social system insofar as the members of that system act according to and are secure in the expected futures constituted by the presence of each other or their symbolic representations.
(Mayer, Davis, & Schoorman, 1995)
TRU is the willingness of a party to be vulnerable to the actions of another party based on the expectation that the other will perform a particular action important to the trustor, irrespective of the ability to monitor or control that other party.
(Rousseau, Sitkin, Burt, & Camerer, 1998)
TRU is a psychological state comprising the intention to accept vulnerability based upon positive expectations of the intentions or behavior of another.
(Grandison & Sloman, 2001)
TRU is the firm belief in the competence of an entity to act dependably, securely and reliably within a specified context.
(Mui, Mohtashemi, Square, & Road, 2002)
TRU is a subjective expectation an agent has about another’s future behavior based on the history of their encounters.
(D. Gefen, Karahanna, & Straub, 2003)
TRU is a belief in the integrity, benevolence, ability, and predictability of the e-vendor.
(Corritore, Kracher, & Wiedenbeck, 2003)
Online TRU is an attitude of confident expectation in an online situation of risk that one’s vulnerabilities will not be exploited.
(Komiak & Benbasat, 2004)
Emotional TRU is the extent that a trustor feels secure and comfortable about relying on a trustee.
(Rodgers & Gago, 2006) TRU means reliance on the ability, integrity, predictability, etc. of an individual in other
individuals. (Olmedilla, Rana,
Matthews, & Nejdl, 2006)
TRU of a party A to a party B for a service X is the measurable belief of A in that B behaves dependably for a specified period within a specified context (in relation to service X).
(Jarvenpaa, Tractinsky, & Saarinen, 2006)
TRU is a trustor’s expectations about the motives and behaviors of a trustee.
(Ennew & Sekhon, 2007)
TRU is an individual’s willingness to accept vulnerability on the grounds of positive expectations about the intentions or behavior of another in a situation characterized by interdependence and risk.
(D. J. Kim, Ferrin, & Rao, 2008b)
Internet TRU is a consumer’s subjective belief that the selling party or entity on the Internet will fulfill its transactional obligations as the consumer understands them.
(Schaupp & Carter, 2010)
TRU in e-filers is the citizen’s perception of confidence in the e-filer’s competence and integrity at enabling them to e-file their taxes, while ensuring the security and privacy of their personal information.
7 TRU has been widely incorporated into the technology adoption literature in various contexts such as e-commerce (see, e.g., Chandra, Srivastava, & Theng, 2010; D. Gefen et al., 2003), internet banking (see, e.g., Kesharwani & Bisht, 2012), e-government (see, e.g., Bélanger & Carter, 2008; Gutteling, Horst, & Kuttschreuter, 2007; J. Lee, Kim, & Ahn, 2011) and social networking (see, e.g, Bandiera & Rasul, 2006; Shin, 2010) – please consult Table 3 for further details. Simultaneously, in the literature, TRU was recognized as an inhibitor of technologies like Electronic Payment Systems (EPS) (Schaupp & Carter, 2010; Yang, Pang, Liu, Yen, & Michael Tarn, 2015) or e-commerce (Featherman & Pavlou, 2003; D. J. Kim, Ferrin, & Rao, 2008a).
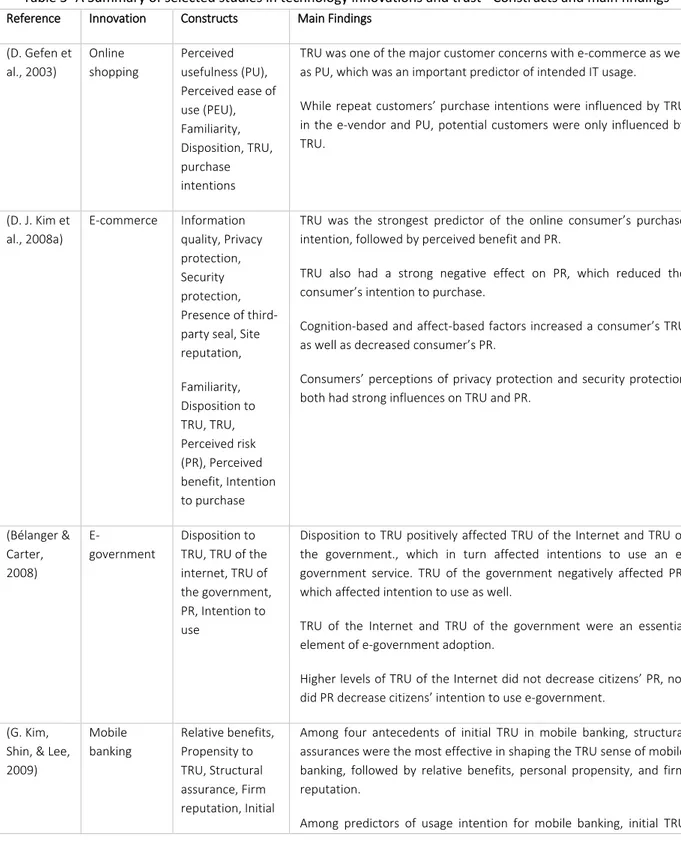
Table 3- A Summary of selected studies in technology innovations and trust - Constructs and main findings
Reference Innovation Constructs Main Findings
(D. Gefen et al., 2003) Online shopping Perceived usefulness (PU), Perceived ease of use (PEU), Familiarity, Disposition, TRU, purchase intentions
TRU was one of the major customer concerns with e-commerce as well as PU, which was an important predictor of intended IT usage. While repeat customers’ purchase intentions were influenced by TRU in the e-vendor and PU, potential customers were only influenced by TRU. (D. J. Kim et al., 2008a) E-commerce Information quality, Privacy protection, Security protection, Presence of third-party seal, Site reputation, Familiarity, Disposition to TRU, TRU, Perceived risk (PR), Perceived benefit, Intention to purchase
TRU was the strongest predictor of the online consumer’s purchase intention, followed by perceived benefit and PR.
TRU also had a strong negative effect on PR, which reduced the consumer’s intention to purchase.
Cognition-based and affect-based factors increased a consumer’s TRU as well as decreased consumer’s PR.
Consumers’ perceptions of privacy protection and security protection both had strong influences on TRU and PR.
(Bélanger & Carter, 2008) E-government Disposition to TRU, TRU of the internet, TRU of the government, PR, Intention to use
Disposition to TRU positively affected TRU of the Internet and TRU of the government., which in turn affected intentions to use an e-government service. TRU of the e-government negatively affected PR, which affected intention to use as well.
TRU of the Internet and TRU of the government were an essential element of e-government adoption.
Higher levels of TRU of the Internet did not decrease citizens’ PR, nor did PR decrease citizens’ intention to use e-government.
(G. Kim, Shin, & Lee, 2009) Mobile banking Relative benefits, Propensity to TRU, Structural assurance, Firm reputation, Initial
Among four antecedents of initial TRU in mobile banking, structural assurances were the most effective in shaping the TRU sense of mobile banking, followed by relative benefits, personal propensity, and firm reputation.
8
TRU, Usage intention
shows the biggest influence followed by relative benefits and firm reputation. (Shin, 2010) Social networking Perceived security, Perceived privacy, TRU, Attitude, Intention
Perceived privacy and perceived security were the main determinants of TRU in social networks acceptance.
Perceived security moderated the effect of perceived privacy on TRU. TRU enhanced intention and was significantly related to perceptions of security.
Perceived privacy and TRU had a moderate correlation, as well as there was a significant effect of perceived privacy on perceived security. Perceived privacy had a mediating effect on TRU through perceived security. (Kesharwani & Bisht, 2012) Internet banking TRU, Website design, Perceived behavioral control (PBC), Social influences, PR, PU, PEU, Behavioral intention (BI)
PR had a negative impact on BI to adopt internet banking, and TRU had a negative impact on PR.
A well-designed web site was helpful in facilitating use and minimizing PR of internet banking usage.
Website features had a negative impact on PR and a positive impact on PEU.
TRU and PR had a confirmed negative relationship, which means enhanced TRU had the potential to reduce PR.
(Rouibah, Lowry, & Hwang, 2016) Electronic Payment Systems (EPS) Perceived enjoyment, Personal innovativeness, Propensity to trust, Familiarity, Presence of third-party seals, PR, TRU, Adoption intention
Perceived enjoyment, the presence of third-party seals, familiarity, propensity to trust and personal innovativeness had a direct and positive effect on customers’ TRU, while PR was negatively related to the intention to adopt EPS.
With respect to the adoption of ADS, consumers need to rely on TRU to overcome their risk feelings, especially when one has incomplete control over the outcome (D. J. Kim et al., 2008a; Luo et al., 2010). Bansal & Kockelman, (2017) found that 54.4% of Americans perceived ADS as a useful advancement in transportation, but 58.4% feared them. Equipment or system failure were the main concern with ADS usage. Only 62.3% were willing to TRU technology companies, 49.5% luxury vehicle manufacturers and 45.5% mass-market manufacturers with the production of well-designed ADS. Outcomes of a study conducted by Straub et al., (2018) demonstrate that potential passengers of vehicles with ADS want to believe in and TRU them to make independent and intelligent decisions, but TRU could be held up by a lack of understanding of the basic reasoning method through which the vehicle makes decisions.
9
2.3. P
ERCEIVEDR
ISK AND CONSUMER BEHAVIORBauer, (1960) introduced the concept of perceived risk (PR) and defined it as a combination of uncertainty and seriousness of outcome. Cunningham, (1967) identified the major dimensions of PR. Later on, Featherman et al., (2003) empirically tested the effects of seven facets of PR, including performance, financial, time, psychological, social, privacy, and overall risk in the context of e-service adoption. Since the concept of PR appeared in marketing literature, various types of risk have been identified (see, e.g., Jacoby & Kaplan, 1972; Peter & Ryan, 1976; Zikmund & Scott, 1974). In consumer behavior research, PR has been related to the expectation of experiencing losses in uncertain situations (Featherman & Pavlou, 2003; Peter & Ryan, 1976). In innovation literature, on the other hand, it has been defined in terms of uncertainty about the possibility of the failure of a new product or the likelihood that the product will not work properly (Hengstler et al., 2016; Nienaber & Schewe, 2014).
A high level of PR is associated with potential threats and losses, which affects the perceived benefits of an outcome, or TRU in a system. Kyriakidis et al., (2015) demonstrated how the more sophisticated the level of automation, the more apprehensive people seemed to be. Taeihagh et al., (2018) identified five types of technological risk associated with ADS, namely, safety, liability, privacy, cybersecurity, and industry influence. Errors in the control system, legal issues, unqualified users, lack of TRU in such systems or even concerns about humans being better drivers than machines have also arisen in literature (see, e.g., Bansal, Kockelman, & Singh, 2016; Brandon & Sivak, 2014; Kaur & Rampersad, 2018; Neumayr, 2017). Regarding the relationship between TRU and risk, there are different results in the literature. Some studies found customer TRU negatively affected PR (see, e.g., Kesharwani & Bisht, 2012; D. J. Kim et al., 2008a; Schaupp & Carter, 2010; Yang et al., 2015) while others found that PR negatively affected customer TRU (see, e.g., Gutteling et al., 2007; D. J. Kim et al., 2008a). Simultaneously, there is research that points out for a reciprocal influence of TRU and PR (Chang & Chen, 2008).
2.4. T
ECHNOLOGY ACCEPTANCESeveral theoretical models have sought to explain technology acceptance and use. One of the most well-known theoretical models that intended to explain the relationship between user beliefs, attitudes, acceptance, and usage behavior of emerging information technologies at the individual level is the Theory of Reasoned Action (TRA) (Fishbein & Ajzen, 1975). Both the Theory of Planned Behavior (TPB) (Ajzen, 1985), and the Technology Acceptance Model (TAM) from (Davis, 1989) were based on the TRA. The TPB extends the TRA, to account for conditions where individuals do not have complete control over their behavior. The TPB postulates that actual usage is determined by behavioral intention (BI) and perceived behavioral control (PBC), while attitude towards behavior, subjective norm, and PBC determine BI (Ajzen, 1985). The TPB has been used in several topics in Information Technology (IT) research, such as the acceptance of the World Wide Web (Klobas & Clyde, 2000), the adoption of mobile technology (Luarn & Lin, 2005) and the use of online services (Bosnjak, Obermeier, & Tuten, 2006). TAM postulates that perceived usefulness (PU) and perceived ease of use (PEU), account for a large proportion of the variance in BI to adopt new IT (Al-Gahtani, Hubona, & Wang, 2007; V Venkatesh, 2000).
Later on, Venkatesh et al., (2003) provided a comprehensive examination of eight prominent models and derived a Unified Theory of Acceptance and Use of Technology (UTAUT). UTAUT suggests
10 performance expectancy (PE), effort expectancy, social influence, and facilitating conditions are determinants of BI and use behavior. In addition, it suggests the role of gender, age, experience, and voluntariness of use as moderator variables (Venkatesh et al., 2003). PE, defined as “the degree to which an individual believes that using a system will help him or her attain gains in performance” (V. Venkatesh et al., 2003), has consistently been shown to be the strongest predictor of BI. Years later, Venkatesh et. al., (2012) extended UTAUT to study the acceptance and use of technology in a consumer context and named it UTAUT2. In the latter, they incorporated hedonic motivation, price value, and habit, as well as individual differences, namely, age, gender, and experience as moderators of the effects of these constructs on BI and technology use. It produced a substantial improvement in the variance explained in technology BI (56% to 74%) and usage (40% to 52%).
2.5. O
THER RELEVANT THEORIESSelf-efficacy (SE) was first introduced in the context of the Social Cognitive Theory (SCT) by Bandura, (1989) and it is defined as a person's perception of how easy or difficult it is to carry out a behavior. It refers to people's beliefs about their capabilities to produce designated levels of performance that exercise influence over events that affect their lives (Bandura, 1994). The explanatory power of SE in models intended to predict technology adoption has been demonstrated since technology can be a complex and intimidating thing for new users.
11
3. RESEARCH MODEL AND HYPOTHESIS
3.1. R
ESEARCHM
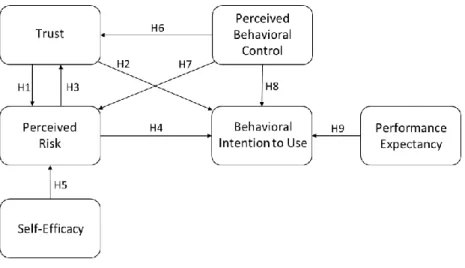
ODELIn line with our theoretical basis, this research model includes six constructs and nine hypotheses. Due to the nature of ADS, we expect consumers to experience initial resistance and PR. Under uncertain situations, TRU comes into play as a solution for the specific problems of PR (D. J. Kim et al., 2008a). The model suggests that TRU and PR will play important roles in individual adoption and have a strong effect on each other. At the same time, we expect other variables, such as PBC and PE to be drivers of ADS’ behavioral intention to use (BIU). The conceptual model is depicted in Figure 1.
Figure 1 - Conceptual model
3.2. H
YPOTHESESGiven the characteristics of ADS discussed above, we consider TRU as a critical antecedent of this technology, thus including it in our research model. We adopt the definition from (Ennew & Sekhon, 2007) in which TRU is an “individual’s willingness to accept vulnerability on the grounds of positive expectations about the behavior of ADS.” When drivers trust ADS, they assume that the vehicles will behave as expected, reducing the PR. TRU is a way of dealing with uncertain situations, and therefore it has the potential to improve the intention of individuals to engage in an action (D. J. Kim et al., 2008a; Rouibah et al., 2016). Some researchers have confirmed the influence of TRU both as a direct determinant of BI and as an indirect influence through PU and PR (Carter & Bélanger, 2005; Featherman & Pavlou, 2003; D. Gefen et al., 2003).Therefore, we hypothesize:
H1: TRU has a negative influence on PR in ADS H2: TRU has a positive influence on ADS’ BIU
In this study, we define PR as a consumer's belief about the potential uncertain negative outcomes from the adoption of ADS. Quite often new technologies fail to deliver on their promises (Hancock, Nourbakhsh, & Stewart, 2018). In the case of ADS, any failure of one of the components or sensors can cause a fatal accident or crash. Uncertainty and perceived loss, both related to PR, may obstruct the favorable evaluation of the system to be adopted. Consequently, as PR grows, the importance of TRU increases (Hancock et al., 2018). At the same time, we theorize that the more people are aware of the possible risks related to ADS, the less willing they are to adopt such
12 technology. For instance, Herrero Crespo & Rodriguez Del Bosque, (2010) obtained empirical evidence supporting the negative effect of consumers’ PR on both attitudes towards Internet purchasing and on intention to purchase online. Other studies reinforced PR’s negative effects on the intention to use technology (Choi & Ji, 2015; Meschtscherjakov, Wilfinger, Scherndl, & Tscheligi, 2009; Ratnasingham, 2000). Additionally, research has linked lower usage with higher PR. Thus, we hypothesize:
H3: PR has a negative influence on TRU in ADS H4: PR has a negative influence on ADS’ BIU
People with a high level of SE are more confident in their decisions and, according to (Luo et al., 2010), in case something goes wrong, they feel more certain they can solve the problem in their favor, perceiving lower uncertainty or less loss from difficult situations (in the context of ADS, e.g., security and safety issues or errors with the system). We define SE as an individual’s belief that they have the required knowledge, skill, or ability to operate ADS. As increasing attention is afforded to the development of ADS, it is inevitable that the average driver will eventually no longer be actively involved in handling driving tasks as he knows it, taking on a supervisory role in ensuring that the vehicle performs the required control actions suitably (Jamson et al., 2013). Consideration of a driver’s ability to undertake such a role is consequently vital (Jamson et al., 2013).
PR can be seen as a feeling of susceptibility to threats and a cause of self-protective behavior (Luo et al., 2010). In this sense, SE could help to overcome such feelings. Kim, (2005) provided evidence that SE is negatively associated with PR in e-commerce. In the context of ADS, we posit that people with a high level of SE will perceive less risk (Luo et al., 2010). Thus, we posit:
H5: SE has a negative impact on PR in ADS
The experience of control stems from the belief about the extent to which people have control over the environment (Skinner, 1996). It refers to ‘‘a person’s belief to significantly alter and predict a situation’’ and describes the extent of a person’s beliefs about the influence he or she has over his or her life (Hajli & Lin, 2016). Thus, perceived behavioral control (PBC) results from both individual beliefs regarding the factors determining behavior and from control over such factors (Herrero Crespo & Rodriguez Del Bosque, 2010). With regard to individual beliefs, according to Rundmo et al., (2011) drivers assess themselves as being more skilled than the average driver and perceive they control dangers when they are on the wheel themselves compared to when riding with another driver or using public transportation. Straub et al., (2018) demonstrate in their experience that, when given a role of authority, such as that of a safety operator, humans were likely to intervene with a vehicle’s autonomy, taking over control at inappropriate or unnecessary times. Inappropriate intervention is defined as “one where a human intervenes to disrupt what would have been a safe maneuver,” and it can be caused by, amongst others, lack of familiarity with the system, human distraction, or overconfidence in their own capabilities Straub et al., (2018). When the driver is dismissed, and therefore no longer holds control over the vehicles, concerns related to TRU, errors in the system, rules applied, ethical issues, legal matters, and security may arise (Rundmo et al., 2011; Windsor, Anstey, & Walker, 2008).
We could declare that whenever there is control, there is no TRU, and vice versa (Tan & Thoen, 2000). It means that putting control and guarantees is TRU building; it produces TRU when it
13 is not enough. On the other hand, when TRU in automation is enough, control makes it less reliable. In this sense, control can either decrease or increase TRU (Castelfranchi & Falcone, 2000).
In the context of artificial intelligence (AI), PR derives from the delegation of control to a machine and its control mechanisms (Castelfranchi & Falcone, 2000; Hengstler et al., 2016). While semi-automated on-road vehicles provide various forms of driver assistance to support the driver who ultimately remains in control, ADS are designed to drive themselves (levels 3 and 4 under some driving modes). We are witnessing a radical change in which control is given over to the machine (Hancock et al., 2018).
SAE’s level 3, also known as “conditional automation,” performs all aspects of the dynamic driving task with the expectation that the human driver will respond appropriately to a request to intervene (US Department of Transportation, 2015). Monitoring is common to a large spectrum of ADS, and it might negatively impact acceptance since engaging with secondary tasks might be a primary end-user benefit (Nees, 2016). Notwithstanding, monitoring could also emerge in order to address drivers’ lack of TRU in the system; people may feel more compelled to accept automation when the opportunity to regain control is given, even if human intervention is not required. Either scenario could prevent or dissuade the driver from engaging in secondary tasks and be harmful to TRU and acceptance of the system (Nees, 2016). The possibility to take over control in cases of emergency was consensual among respondents of a survey conducted by Neumayr, (2017) and even further when the most effective option to increase TRU towards ADS was the possibility to take over control whenever wanted (Bazilinskyy, Kyriakidis, & de Winter, 2015; Neumayr, 2017). In a study conducted by Kyriakidis et al., (2015) respondents did not appear to be very comfortable with the idea of entirely removing the steering wheel from the vehicle. Based on the above viewpoints, this study proposes the following hypotheses:
H6: PBC has a positive influence on TRU in ADS H7: PBC has a negative influence on PR in ADS H8: PBC has a positive influence on ADS’ BIU
PE reflects one’s expectation of improvement in performance by using a system (Venkatesh et al., 2003). In this context, PE is defined as the degree to which an individual believes that using ADS will help them achieve higher levels of performance. ADS have the potential to, not only outperform the safety record of traditional cars but also to increase passengers performance (Kaur & Rampersad, 2018). At the same time, being distracted would not lead to problems since the system is assuming the task of driving for humans. ADS have been through years of tests, driving thousands of miles under restricted conditions and with human intervention when required (see, e.g., Fraichard, Parent, Rocquencourt, & Bp, 2008; Kaur & Rampersad, 2018). Hence, their performance in uncontrolled environments is hard to predict. Since any system failure can threaten human lives, ADS need to meet high-performance requirements before they are deployed. Considering the initial adoption stage of ADS, the belief that precedes actual experience is critical ensuring that users will receive the expected benefits from the interaction. On the other hand, if ADS are not perceived as being able to perform their task as expected, people will not be willing to depend on them (Paravastu, Gefen, & Creason, 2014). Therefore, we posit:
14
4. METHODOLOGY
4.1. M
EASUREMENTData were collected between October and November 2018 using a questionnaire directed at residents in a European country, Portugal. We used a website named Survey Monkey to create the survey and to collect the responses. Our target population was working people with a driver’s license. Measurement items (Appendix A) were adapted from several authors, with slight modifications. The items for all constructs are included in Appendix A.
4.2. D
ATAA questionnaire was initially developed in English, based on the literature review, and the final version was independently translated into Portuguese by a professional translator, and then back into English by a different translator to ensure translation equivalence, as recommended by Brislin, (1970). All items were measured using seven-point Likert scales, anchored from totally disagree (1) to totally agree (7). A pilot study was conducted to test the instrument. The respondents were not included in the main survey. Four hundred seventeen individuals participated in the survey until the end of November 2018, of which 311 completed it. That means 106 responses were removed due to incompleteness, leaving 311 (about 74.6%) with valid and complete responses. The sample distribution of the early and late respondent groups were compared using the Kolmogorov-Smirnov (K-S) test (Ryans, 1974) to test for non-response bias. The sample distributions of the two groups did not differ significantly, indicating an absence of non-response bias (Ryans, 1974). The results revealed no statistically significant difference (p > 0.10), indicating the absence of non-response bias. Additionally, the marker variable technique was employed to test for common method bias (Lindell & Whitney, 2001; Malhotra, Kim, & Patil, 2006). No significant common method bias was found in the data set. In total 159 respondents (51%) were men, and 152 (49%) were females. Regarding education, 27% of the respondents said they had concluded high school or less. The education level was relatively high: more than half of respondents had bachelor’s degrees or higher qualifications, 36% had completed a bachelor’s degree, 35% a post-graduation or master’s degree and 2% a Ph.D. Concerning daily commute distance, 44.7% traveled between 0 and 30km per day (short commutes), while 22.5% of the respondents traveled between 32 and 60km per day (medium commutes), and 32.8% between 65 and 400km (long commutes). 35.4% spent less than 45 minutes per day in-vehicle, a similar percentage (36.3%) spent between 45 and 120 minutes, followed by 19.3% who spent between 120 and 240 minutes traveling and only 9% spent 240 minutes, that means, four hours or more in the vehicle.
15
5. RESULTS
The data analysis was carried out using structural equation modeling (SEM). The models were estimated with partial least squares (PLS), which has been widely selected as a tool in the IS/IT field (W. W. Chin, Marcolin, Newstead, & Newsted, 1996). PLS was chosen because (i) not all items in our data are distributed normally (p < 0.01 based on Kolmogorov-Smirnov's test); (ii) the research model has not been tested in the literature; (iii) the research model is considered to be complex; (iv) PLS estimation requires ten times the largest number of structural paths directed at a particular construct in the model (David Gefen, 2005). The sample in our study met the necessary conditions for using PLS. Smart PLS 2.0 M3 was the software used to analyze the relationships defined by the theoretical model.
5.1. M
EASUREMENTM
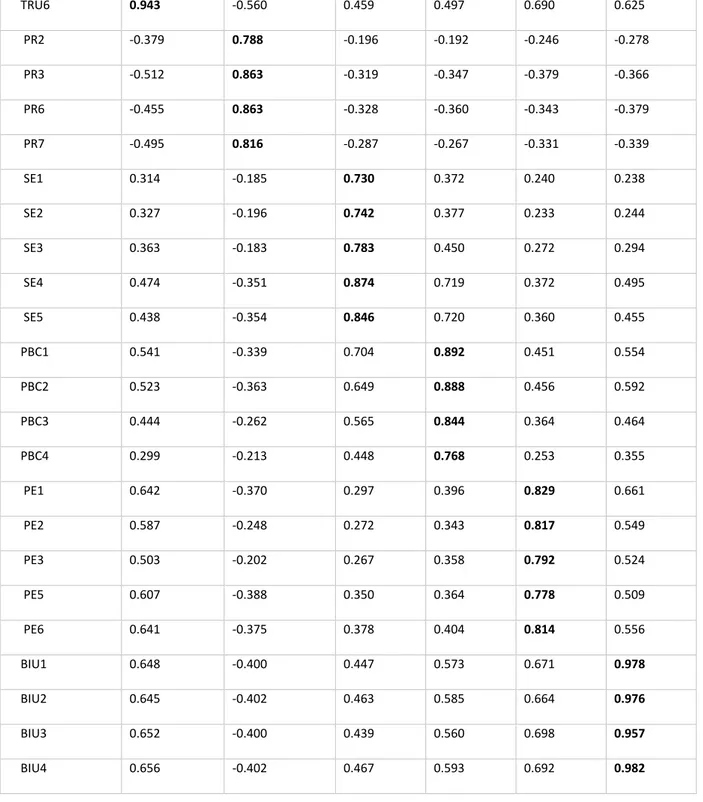
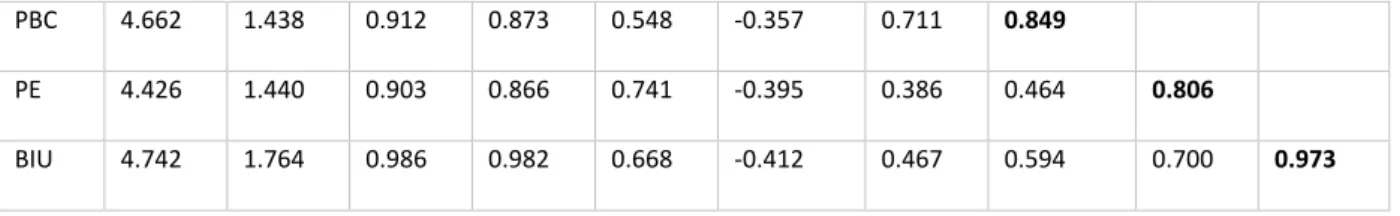
ODELTables 4 and 5 present the measurement model results. Five out of six of the results for composite reliability are greater than 0.9, indicating that the model has good internal consistency. Good indicator reliability was evaluated based on the criterion that the loadings should be greater than 0.70. The loadings are all above 0.70, as seen in Table 4, except for PE4, PR1, PR4, and PR5 that were excluded due to their low loadings. Average variance extracted (AVE) was used to test convergent validity. AVE should be higher than 0.50 so that the latent variables explain more than half of the variance of their indicators (Hair Jr, Hult, Ringle, & Sarstedt, 2016; Ringle & Sinkovics, 2009). As we can see in Table 5, AVE for each construct is above the expected threshold of 0.5. These results assure the validity and reliability of the measures in this research. To further examine the discriminant validity of the measures used, two methods were employed. First, the square roots of AVE (diagonal elements) are greater than the correlation between each pair of constructs (off-diagonal elements) (Fornell & Larcker, 1981). Second, to ensure the discriminant validity, the loadings should be larger than cross-loadings (Chin, 1998; Götz, Liehr-Gobbers, & Krafft, 2010; Gregoire & Fisher, 2006). In Table 5 we can see that the square root of AVE (in bold) is higher than the correlation between constructs. The measurement model results indicate that the model has good internal consistency, indicator reliability, convergent validity, and discriminant validity. Hence, the constructs of our model are statistically distinct and can be used to test the structural model.
5.2. S
TRUCTURALM
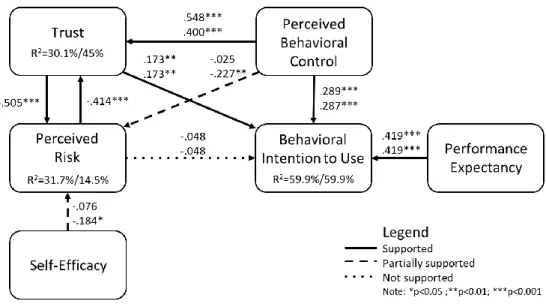
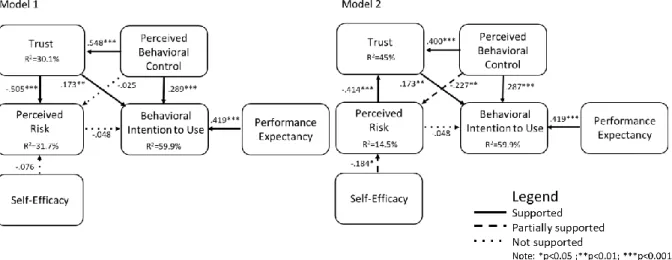
ODELSince hypotheses H1 and H3 include a mutual influence between TRU and PR that cannot be tested simultaneously, we tested two different models. Model 1 assumes that the influence is from TRU to PR (H1), whereas model 2 flows from PR to TRU (H3). The results of the tests performed on the two structural models are depicted in Figures 2 and 3. In Figure 2, the upper path coefficients give the results of model 1 and the lower ones of model 2. The path coefficient for the model with bootstrapping t-statistics is derived from standard error with 5,000 iterations.
16 Figure 2 - Structural model results with path coefficients, r-squares and p-values
TRU explains 30.1% of the variation in model 1 and 45% of the variation in model 2. The PR (β= -0.414, p<0.001) is statistically significant in explaining TRU in model 2, thus confirming hypothesis H3. The PBC (β=0.548, p<0.001 in model 1 and β= 0.400, p<0.001 in model 2) is statistically significant in explaining TRU, thus confirming hypothesis H6.
The PR explains 31.7% of the variation in model 1 and 14.5% of the variance in model 2. TRU (β=-0.505, p<0.001) is statistically significant in explaining the PR in model 1, thus confirming hypothesis H1. PBC (β= -0.227, p<0.01 in model 2) and SE (β=-0.184, p<0.05 in model 2) are statistically significant in explaining the PR in model 2, as opposed to model 1 are not statistically significant, thus partially confirming hypotheses H7 and H5.
The ADS’ BIU explains 59.9% of the variation in both models. TRU (β= 0.173, p<0.01 in model 1 and β=0.173, p<0.01 in model 2), PBC (β= 0.289, p<0.001 in model 1 and β= 0.287, p<0.001 in model 2), and PE (β=0.429, p<0.001 in both models) are statistically significant in explaining ADS’ BIU in both models, thus confirming hypotheses H2, H8, and H9. The PR (β=0.048 in both models) is not statistically significant, and consequently, H4 is not confirmed in either model.
Most of the hypotheses are partially or totally supported by our study (eight hypotheses from a total of nine). The findings regarding the nine hypotheses are summarized in Table 6.
Table 4 - PLS loadings and cross-loadings
TRU PR SE PBC PE BIU TRU1 0.900 -0.534 0.403 0.502 0.675 0.607 TRU2 0.838 -0.450 0.454 0.480 0.648 0.573 TRU3 0.828 -0.444 0.438 0.468 0.647 0.569 TRU4 0.679 -0.330 0.366 0.364 0.493 0.476 TRU5 0.923 -0.512 0.424 0.492 0.636 0.572
17 TRU6 0.943 -0.560 0.459 0.497 0.690 0.625 PR2 -0.379 0.788 -0.196 -0.192 -0.246 -0.278 PR3 -0.512 0.863 -0.319 -0.347 -0.379 -0.366 PR6 -0.455 0.863 -0.328 -0.360 -0.343 -0.379 PR7 -0.495 0.816 -0.287 -0.267 -0.331 -0.339 SE1 0.314 -0.185 0.730 0.372 0.240 0.238 SE2 0.327 -0.196 0.742 0.377 0.233 0.244 SE3 0.363 -0.183 0.783 0.450 0.272 0.294 SE4 0.474 -0.351 0.874 0.719 0.372 0.495 SE5 0.438 -0.354 0.846 0.720 0.360 0.455 PBC1 0.541 -0.339 0.704 0.892 0.451 0.554 PBC2 0.523 -0.363 0.649 0.888 0.456 0.592 PBC3 0.444 -0.262 0.565 0.844 0.364 0.464 PBC4 0.299 -0.213 0.448 0.768 0.253 0.355 PE1 0.642 -0.370 0.297 0.396 0.829 0.661 PE2 0.587 -0.248 0.272 0.343 0.817 0.549 PE3 0.503 -0.202 0.267 0.358 0.792 0.524 PE5 0.607 -0.388 0.350 0.364 0.778 0.509 PE6 0.641 -0.375 0.378 0.404 0.814 0.556 BIU1 0.648 -0.400 0.447 0.573 0.671 0.978 BIU2 0.645 -0.402 0.463 0.585 0.664 0.976 BIU3 0.652 -0.400 0.439 0.560 0.698 0.957 BIU4 0.656 -0.402 0.467 0.593 0.692 0.982
Table 5 - Means, standard deviations, correlations, and reliability and validity measures (CR, CA, and AVE) of latent variables
Mean SD CR CA TR PR SE PBC PE BIU
TR 4.053 1.308 0.942 0.925 0.856
PR 4.059 1.284 0.901 0.853 -0.557 0.833
18
PBC 4.662 1.438 0.912 0.873 0.548 -0.357 0.711 0.849
PE 4.426 1.440 0.903 0.866 0.741 -0.395 0.386 0.464 0.806
BIU 4.742 1.764 0.986 0.982 0.668 -0.412 0.467 0.594 0.700 0.973
Table 6 - Results of hypotheses tests
Hypothesis Model 1 β Model 2 β Support R2
Trust 30.1%/45% H3: PR → TRU -0.414*** Yes H6: PBC → TRU 0.548*** 0.400*** Yes Perceived Risk 31.7%/14.5% H1: TRU → PR -0.505*** Yes H5: SE → PR -0.076 -0.184* Partially H7: PBC → PR -0.025 -0.227** Yes
Behavioral Intention to Use 59.9%/59.9%
H2: TRU → BIU 0.173** 0.173** Yes
H4: PR → BIU -0.048 -0.048 No
H8: PBC → BIU 0.289*** 0.287*** Yes
19
6. DISCUSSION
Past research has recognized that the usage of ADS contains an element of PR, and therefore TRU may be an important factor in giving consumers the confidence they need to engage in such actions. Yet, many researchers have not systematically explored how TRU and PR, as well as others, may operate in combination to influence such decisions and what kinds of antecedents play a significant role in the consumer intention to use ADS. This model was developed, extended, and supported by several consumer behavior and social theories like TPB, UTAUT, TRU and risk theories, and SCT. In this paper, we developed a trust-based consumer decision-making model that verified key factors influencing ADS’ BIU, such as, PE, PBC and TRU, and PR’s influence on usage intentions indirectly through TRU. Results show that most predictors of usage intentions identified in the models are factors that can be directly or indirectly controlled by vendors. Thus, the model and results are likely to have important practical implications, in addition to theoretical contributions.
The ADS’ BIU in both models is explained by PE, PBC and TRU. TRU is explained by PBC in model 1 and by PBC and PR in model 2. PR is explained by TRU in model 1 and partially by PBC and SE in model 2. Model 1 has five supported hypotheses while model 2 has the same five supported hypotheses plus two partially supported hypotheses, as Figure 3 demonstrates.
Considering only the results of TRU on ADS to explain BIU, the results are consistent with those reported in previous studies (Choi & Ji, 2015; David Gefen & Straub, 2003; Kaur & Rampersad, 2018). Our research model validates the relationship between TRU and ADS’ BIU. Furthermore, the findings demonstrate how important it is to enhance the TRU given its influence on BIU, as well as the role PR might play in it. In this research we found that TRU had a strong negative effect on PR. This may explain why trusted ADS can be expected to reduce uncertainty and related risks. Once again, considering the influence of TRU on ADS to explain PR, the results are consistent with previous research(Choi & Ji, 2015; Jarvenpaa et al., 2006; Kesharwani & Bisht, 2012; Luo et al., 2010; Muñoz-Leiva, Climent-Climent, & Liébana-Cabanillas, 2016).
20 According to earlier investigation, it would be reasonable to believe that PR would be a significant factor in predicting BIU of a system (Abrahão, Moriguchi, & Andrade, 2016; Bélanger & Carter, 2008; Kesharwani & Bisht, 2012; Pavlou, 2001). Since the public seem to show caution about the concept of ADS and many people are concerned about matters, such as safety, and security, the higher the PR, the lower the BIU should be. However, our results show that PR has no direct impact on the latter, as Muñoz-Leiva et al., (2017) demonstrated. In model 2, though, (when PR explains TRU) PR has an indirect effect on ADS’ BIU through TRU. In addition, in model 2, SE becomes relevant as an influencer of PR. This means that, to encourage driver TRU in automation, drivers not only need a clear understanding of what the system is capable of doing and its purpose (external) but also confidence in their own coping skills (internal). When people's beliefs about their capabilities to operate ADS is negative, levels of PR increase, which in turn decrease TRU in ADS. The same way, as people develop beliefs in their abilities to operate the technology, the less the uncertainty about possible failure, or PR, which leads to higher levels of TRU in ADS. Finally, an additional finding was the influence PBC had in PR in model 2 (when the PR explained TRU), as opposed to in model 1 (when TRU explained PR). In situations where TRU fails to decrease PR, PBC and SE can be helpful alternatives.
PE is the most relevant factor in explaining ADS’ adoption, followed by PBC. Research in ADS quite often mentions how users find it odd and uncomfortable to lose power to machines and not to be in control when operating ADS (Glancy, 2012; Kaur & Rampersad, 2018). In both models, PBC had a strong positive effect on TRU but only in model 2 do we notice its impact on PR. This means individuals tend to fear giving up control of the vehicle and are relieved by having the ability to take it back (Howard, 2014), which not only directly leads to higher levels of TRU and ADS’ BIU but also decreases the level of PR (in model 2).
6.1. T
HEORETICALC
ONTRIBUTIONSThis work was developed following the directives from Luo et al., (2010) of developing further research for conjointly examining comprehensive PR and TRU in the context of acceptance of emerging innovative technology in its early adoption stage. The importance of TRU as a major determinant of acceptance of new technologies and other relevant determinants of BIU have been demonstrated (Choi & Ji, 2015; Metcalfe et al., 2017; Wu & Chen, 2005), although these variables are yet to be systematically studied in the domain of ADS. Our research model contributes to the literature by extending the roles of TRU and PR to ADS acceptance.
The contributions of the study are twofold: The primary contribution of this paper to the literature is the mutual influence TRU and PR play over each other, which means that, either directly or indirectly through the other, both constructs affect ADS’ BIU. On the one hand, we demonstrated that PR is not a direct negative antecedent of ADS’ BIU, but an indirect one, acting through TRU. Some constructs have no direct impact on another, but testing in combination with others, their indirect effect could play an important part in explaining BIU. Furthermore, when PR is explained by the TRU, in model 1, SE has no explanatory value. On the other hand, when TRU is explained by PR, SE negatively influences PR, which means, it indirectly and positively influences TRU. That is, one can work to increase SE if the intention is to lower the levels of PR, which, in turn, increase TRU levels. The same happens with PBC. It is possible to reduce PR through increased PBC, but this is only valid in model 2. In cases where TRU explains PR, neither SE nor PBC have explanatory relevance. This study allowed the identification of SE and PBC as indirect antecedents of PR and TRU.
21 Second, to our best knowledge, ADS’ BIU has so far not been studied based on a rigorous theoretical background. The Theory-based model is the most effective approach to identify its determinants and to formulate and design specific measures and action in the context of the studied subject (Jing et al., 2019). Much of the previous work on ADS has been descriptive, univariate analysis of travel attribute of users, benefits, concerns and sociodemographic aspects of the adoption, based on survey data samples. This paper aims to build on the existing body of literature by examining a statistical sample containing latent psychological variables. From the theoretical perspective, this study integrates TPB and UTAUT constructs, as well as acceptance, TRU, PR, and automation theories to explain ADS’ adoption intention. We found that the factors that contribute the most to ADS’s BIU are, by order of relevance, PE, PBC, and TRU. This means that the most used models in technology adoption research can be deconstructed and intersected with parts of other models, to expose different findings and applications of their constructs, as is the case. Incorporating two psychological variables, TRU and PR, and testing two different scenarios, allowed us to uncover deeper insights regarding the importance of TRU and PR and their role in ADS´ BIU. Results imply that understanding user behavior toward ADS requires concepts from different theories. To achieve successful strategies, we recommend that decision-makers base their action plan on the factors that influence the user, as we demonstrated.
6.2. M
ANAGERIAL IMPLICATIONSThis paper not only helps to forecast the drivers of long-term adoption of ADS, but also supports companies, transportation planners, governments and legislators in understanding the promotors of ADS’ BIU, and subsequently, developing strategies in order to address consumer’s concerns and make them overcome them. Their main potential resides in the fact that car automation is applicable to the entire public transportation system. In short, designing trustable, high-performing technologies that allow the driver to feel in control of the situation may be critical factors in the success of ADS.
When vehicles with SAE Level 5 autonomy are reached, they will not be expected to display traditional controls available to passengers, since they do not require human intervention. Limiting the number of control options available to the user may reduce feelings of responsibility, which may affect the passenger’s TRU perception of the vehicle. Requiring traditional user controls, such as a steering wheel and pedals, may provide some degree of comfort and initial TRU in the vehicle. However, as we saw before when given the opportunity, the driver tends to make inappropriate or unnecessary changes in control allocation. In order to create a sense of control without putting the driver in danger, one solution could be to implement vehicle-to-passenger communication interfaces, providing information to the drivers about environmental and situational awareness, pedestrian and other vehicle information (e.g., obstacle detection and avoidance), how the system’s underlying reasoning works, mobility and navigation feedback, vehicle status and passenger safety information, as a means to potentially reduce intervention and increase TRU in ADS. In addition, ADS manufacturers could take advantage of other equipment, such as smartphones and smartwatches, to provide travelers with real-time statistics about ADS usage, while capitalizing on the benefits that this type of interconnection provides, which comprehends access to user data and real-time feedback. Also, allowing the driver to shift a vehicle’s personalities or characteristics in the way that it drives, as in a selectable driving mode system, could help to produce a sense of control, while preventing drivers from engaging in possibly dangerous intervention. As for external control, governments should focus on infrastructure platform construction and policy formulation, and, through the latter,
22 norms standardization. Creating subsidies and tax benefits for ADS’ consumers could incentivize BIU too.
Promoting knowledge about ADS technology, as well as advertising the benefits to the transportation system, society and the environment and contributions for personal travel convenience through both online and offline media campaigns can help decrease travelers’ PR associated with ADS. New media, such as the Internet or television, are important means of opinion construction. Additionally, ADS companies can also provide users with insurance, maintenance, inspection, or even the opportunity to directly experience ADS. Positive performance outcome from test-driving can improve knowledge about ADS technology and perceived TRU. Free trial driving gives some people the willingness to try ADS, and it is a great opportunity to exploit travelers’ behavioral control. Ultimately, what will determine the degree of ADS incorporation on public roadways is performance, or how well vehicles behave in the real world.
The results showcased in this work suggest standards and rules for control measures and vehicle design to proactively address key concerns in the development and promotion of ADS to foster positive attitudes, acceptance and high-performance expectations.
6.3. L
IMITATIONS AND FUTURE RESEARCHFuture research will be needed to assess the generalizability of our findings. While our research participants reflect a typical group of potential ADS customers, they might not be representative of all users. For example, different geographic or demographic groups might display different attitudes toward ADS’ adoption.
Second, we conducted this research in a single country having a high vehicle penetration rate but not in automation technology. In 2017 in Portugal there were 626.5 motorized road vehicles per thousand inhabitants and 6,447,241 light vehicles in circulation (Pordata, 2018b, 2018a). In order to enhance generalization, future research can extend the study to other regions or countries.
Third, future research could develop original models to assess how TRU, PR, BIU constructs and their antecedents, may complement or contradict each other, the various conditions under which it may or may not hold, and in which research fields could it be integrated.
Finally, given the sturdy investments and forceful efforts of private industries as well as supporting activities by the governments in the last few years, we can expect to see substantial progress in ADS within the next years (Chan, 2017). Since ADS are such a dynamic and rapidly changing technology, it would be interesting to use a longitudinal study to assess the evolution of people’s perceptions and attitudes over time.
23
7. CONCLUSIONS
New forms of mobility are entering the market, which will have enormous repercussions on the entire transportation system and travel experience as people know it. A comprehensive study of travelers’ intentions to use ADS in Portugal, which has so far received little research attention, is, therefore, a subject worth exploring. In this paper, we carried out empirical research on the influencing factors of latent psychological variables on ADS’ BIU. Among the three variables that explained ADS’ BIU, PE was the most important, followed by PBC and TRU. Human perceptions of how the technology performs are fundamental in determining how well a given technology is accepted into common use. Before governments and legislation recognize this technology, high performance requirements need to be assured, considering that any system failure can cause a fatal accident or crash (Kaur & Rampersad, 2018). Drivers’ PBC over the environment also encourages the adoption of ADS because they feel reassured by having the ability to take back control if they feel it is necessary. At the same time, the degree to which humans accept and appropriately use automated technologies is deeply influenced by issues of TRU and confidence.
PR, contrary to what would be expected, does not directly and negatively influence ADS’ BIU. This means that PR is not a barrier to the adoption of ADS. However, PR was proven to have a negative influence over TRU, and vice versa. Hence, PR plays an indirect influence over BIU through TRU. Furthermore, we found that both SE and PBC influenced PR (in model 2). Thus, to reduce PR in automation, drivers need confidence in their capabilities to operate ADS (SE) as well as PBC.
We believe that, as people become more familiar with ADS, their confidence in the reliability, robustness, and safety of ADS will grow, and so will the willingness to share important decision and/or control with the vehicle.