i
Investigating the spatial imprint of sense of place dimensions
among foreign residents of Lisbon
ii
Investigating the spatial imprint of sense of place dimensions
among foreign residents of Lisbon
Dissertation supervised by
Marco Octávio Trindade Painho, PhD
NOVA Information Management School
Universidade Nova de Lisboa
Lisbon, Portugal
and co-supervised by
Sven Casteleyn, PhD
GEOTEC
Universitat Jaume I
Castelló, Spain
Albert Acedo Sánchez, PhD
Department of Geography and Environmental Management
University of Waterloo
Waterloo, Canada
iii
Declaration of Originality
I declare that the work described in this document is my own and not from someone else.
All the assistance I have received from other people is duly acknowledged and all the
sources (published or not published) are referenced.
This work has not been previously evaluated or submitted to NOVA Information
Management School or elsewhere.
Lisbon, February 10, 2020
Vicente de Azevedo Tang
iv
Acknowledgements
First, a special thanks to Prof. Marco Painho for all the advice and the persistent guidance throughout my thesis research as well as for providing constant support during the master studies.
I am extremely thankful for Dr. Albert Acedo and Dr. Sven Casteleyn who helped with insights, recommendations and suggestions during my study carryout.
I am grateful to the MSc. in Geospatial Technologies program for the incredible opportunity I was given as a scholarship holder. The program gifted me new research perspectives, quality education and amazing people that have shaped this journey into a lifetime experience.
To all the academics at NOVA IMS and IFGI who, in one way or another, inspired me to learn new skills, acquire new knowledge and achieve new milestones.
To the friends I have made in the program for all the mutual support and companionship. A special thanks to Carlos, Itzá and Mihail for their friendship and the knowledge exchanged.
To Márcio and Carol for their cheerfulness and love sent from thousands of kilometers away. To our friendship as a source of motivation to work hard and give my best.
Lastly, I would like to express my immense gratitude to my family for their understanding and emotional support throughout hardships as well as for encouraging me to pursue my goals.
v
Investigating the spatial imprint of sense of place dimensions
among foreign residents of Lisbon
Abstract
Place is a part of the geographic space which people have imbued with symbols and connotations
unfolded through psychological mechanisms. Places carry meanings for individuals, communities or even nations evidenced by bonds referred collectively as sense of place. Dissecting sense of
place can aid planners in providing a social-psychological layer of the world characterized by the
distinct relationships people possess towards the physical settings. In this research, different dimensions of sense of place experienced by foreign residents in the city of Lisbon were investigated through a map-based survey and following spatial analysis.
First, the map-based survey was structured on sense of place dimensions drawn from the environmental psychology and human geography research. The dimensions examined here were: (i) place dependence – functional attachment; (ii) place awareness – familiarity and exploration; (iii) place identity – special bonds and self-identity (iv) place inherited – rootedness and belongingness. The survey was shared online among international residents of the city and hand-drawn polygons were processed in order to represent the spatial lay-outs of sense of place. Subsequently, answers were split into two participant categories: short-terms and long-terms. Overlay analysis, spatial comparison metrics, cluster evaluation, statistics and the confection of map products were carried out in order to compare and visualize the distinct sense of place components.
Results, discussion and interpretation were brought forward through comparing dimensions between participant groups; between dimensions themselves, as well as identifying meaningful
places within the urban landscape. The spatial imprint of sense of place in the specified context
of study provided insights regarding the distinction between groups. Long-term and short-term dwellers’ geographic dimensions of sense of place were found to have different patterns, properties and characteristics. Lastly, similar to other works within the same scope, this research asserts the potential of using GIS in providing new perspectives and methodologies from which humanities research can greatly benefit.
vi
Keywords
Sense of place Place attachment
Geographic Information Science Participatory GIS
Spatial analysis Urban intelligence
vii
Index of the text
Acknowledgements ... iv
Abstract ... v
Index of the text ... vii
Index of tables ... ix Index of figures ... x Acronyms ... xii 1. Introduction ... 1 1.1 Research aspects ... 2 2 Literature review ... 3 2.1 Sense of place ... 3
2.2 Dimensions of sense of place ... 3
2.3 Operationalizing sense of place ... 5
2.4 Sense of place and geographic information ... 6
2.5 Sense of place and mobility ... 8
2.6 Theoretical framework ... 9
3 Methodology ... 11
3.1 Overview and study design ... 11
3.2 Survey ... 11
3.2.1 Survey123 and survey structure ... 11
3.2.2 Survey carryout ... 15
3.2.3 Survey data retrieval ... 16
3.2.4 Survey data pre-processing ... 16
3.3 Analysis ... 17
3.3.1 Overlay analysis ... 17
3.3.2 Spatial distribution ... 19
3.3.3 Hotspot analysis and high values distribution ... 19
3.3.4 Statistics ... 19
3.3.5 SPAEF – Spatial Efficiency Metric ... 20
3.3.6 Cluster analysis ... 20
4 Results and discussion ... 21
4.1 Survey ... 21
4.1.1 Survey data ... 21
4.2 Spatial distribution of sense of place dimensions ... 23
4.2.1 Intensity of sense of place dimensions: first map products ... 23
4.2.1.1 Place dependence ... 23
4.2.1.2 Place awareness ... 24
viii
4.2.1.4 Place inherited ... 25
4.2.1.5 Sense of place: combined dimensions ... 25
4.2.2 Regions of collective sense of place: second map products ... 26
4.2.2.1 Place dependence ... 26
4.2.2.2 Place awareness ... 27
4.2.2.3 Place identity ... 28
4.2.2.4 Place inherited ... 29
4.2.2.5 Sense of place: combined dimensions ... 30
4.2.3 Areas of sense of place dimensions within groups: third map products ... 31
4.3 Map products of hotspots analysis and high values distribution ... 31
4.3.1 Place dependence ... 31
4.3.2 Place awareness ... 33
4.3.3 Place identity ... 34
4.3.4 Place inherited ... 35
4.3.5 Sense of place: combined dimensions ... 37
4.4 Descriptive statistics ... 38
4.5 Comparison statistics and Spatial Efficiency metric ... 38
4.5.1 Comparison between groups ... 38
4.5.2 Comparison within groups ... 41
4.6 Cluster analysis ... 43
5 Final discussion ... 43
5.1 Short-term vs. long-term foreign dwellers ... 43
5.2 Comparison between sense of place dimensions ... 47
5.3 Limitations ... 48
6 Conclusions ... 48
6.1 Short-term residents’ sense of place ... 49
6.2 Length of residence and sense of place dimensions ... 49
6.3 Final considerations and future work ... 49
7 Bibliographic references... 51
ix
Index of tables
Table 4.1. Number of drawn polygons, polygons per participant ratio and number of polygons delimitated entirely outside Lisbon. ... 23 Table 4.2. Response rate of each assessed place dimension of short-term and long-term groups. ... 23 Table 4.3. Descriptive statistics for all assessed sense of place dimensions by each participant group. ... 38 Table 4.4. Values of selected areas and their area similarity indices for each dimension. ... 40 Table 4.5. SPAEF and Jaccard’s indices comparing sense of place dimensions within each participant group. ... 42
x
Index of figures
Figure 2.1. Theoretical framework used by Acedo et al. ... 5
Figure 2.2. Place attachment prediction model (from Rollero and Piccoli [29]) ... 6
Figure 2.3. The PPP tripartite framework of place attachment (from Scannel and Gifford [16]). 6 Figure 2.4. Spatial distribution of overlapping values for place attachment and home range based on hand drawn polygons from the PPGIS survey (from Brown et al. [14]) ... 7
Figure 2.5. Application built by Acedo et al. (from Acedo et al. [18]) ... 8
Figure 2.6. Sense of place dimensions used in this study with their respective descriptions .... 10
Figure 3.1. Methodology structure of the research ... 12
Figure 3.2. Initial sections of the survey on XLSForm format ... 13
Figure 3.3. First subsection of the place dependence section of the survey. ... 14
Figure 3.4. Second subsection of the place dependence section of the survey. ... 14
Figure 3.5. Survey steps of drawing polygons on the map. ... 15
Figure 3.6. Information displayed on Survey123 online dashboard. ... 16
Figure 3.7. Simplified scheme of the first operation steps in the overlay analysis ... 17
Figure 3.8. Scheme of the hexagon overlay steps. ... 18
Figure 4.1. Survey participants’ count based on their nationality. ... 21
Figure 4.2. On the left side, participants’ hand-drawn polygons mostly within Lisbon municipality. Maps on the right side show the polygons drawn outside the city of Lisbon ... 22
Figure 4.3. Distribution of place dependence ... 24
Figure 4.4. Distribution of place awareness ... 24
Figure 4.5. Distribution of place identity ... 25
Figure 4.6. Distribution of place inherited ... 25
Figure 4.7. Distribution of sense of place ... 26
Figure 4.8. Maps of common and unique areas for place dependence ... 27
Figure 4.9. Maps of common and unique areas for place awarenes ... 28
Figure 4.10. Maps of common and unique areas for place identity ... 29
Figure 4.11. Maps of common and unique areas for place inherited ... 30
Figure 4.12. Maps of common and unique areas for sense of place ... 30
Figure 4.13. Maps displaying the outline of areas ... 31
Figure 4.14. Hotspots areas and values higher than the upper quartile of place dependence . 32 Figure 4.15. Hotspots areas and values higher than the upper quartile of place awareness.... 33
Figure 4.16. Hotspots areas and values higher than the upper quartile of place identity ... 35
Figure 4.17. Hotspots areas and values higher than the upper quartile of place inherited ... 36
Figure 4.18. Hotspots areas and values higher than the upper quartile of sense of place. ... 37
Figure 4.19. Scatterplots and SPAEF results. ... 39
Figure 4.20. Kernel density functions of the distribution of values higher than 80% ... 40
xi
Figure 4.22 and 4.23. Results of hierarchical cluster analysis ... 45
Appendix
Figure 1. Introduction page of the survey. ... 55Figure 2. Time of residence question. ... 55
Figure 3. Residence location question. ... 56
Figure 4. Country of origin question. ... 56
Figure 5. Brief explanation about following questions... 56
Figure 6. Introduction to place dependence section. ... 56
Figure 7. Map-based question for place dependence. ... 57
Figure 8. Likert question for place dependence. ... 57
Figure 9. Introduction to place dependence section. ... 58
Figure 10. Map-based question for place awareness... 58
Figure 11. Likert question for place awareness... 58
Figure 12. Introduction to place identity section. ... 58
Figure 13. Map-based question for place identity. ... 59
Figure 14. Likert question for place identity. ... 59
Figure 15. Introduction to place inherited section. ... 59
Figure 16. Map-based question for place inherited. ... 59
Figure 17. Likert question for place inherited. ... 60
Figure 18. End of the survey. ... 60
Figure 19. Introduction page of the feedback questionnaire. ... 60
Figure 20. Likert questions of the feedback questionnaire. ... 61
Figure 21. Question regarding approximate time of survey completion. ... 61
Figure 22. Text questions regarding improvements, suggestions and recommendations. ... 62
Figure 23. End of the feedback questionnaire. ... 62
xii
Acronyms
SoP Sense of Place
PA Place Attachment
PI Place Identity
PD Place Dependence
PPP Person-Process-Place
GIScience Geographic Information Science
PPGIS Public Participation Geographic Information System GI Geographic Information
GIS Geographic Information System VGI Volunteered Geographic Information SPAEF Spatial Efficiency Metric
1.
Introduction
Within the geographic information science, the distinction between space and place has been gradually drawing attention to researchers in both its conceptualizations and applications [1]–[3].
Place can be defined as a portion of space in which interactions, activities and experiences occur,
shaping meanings, perceptions and identities for an individual or a community [4],[5]. The relationship between people and the physical world traces back to ancient times and has been a prominent theme of discourse in philosophy as well as visual and literary arts [5],[6]. Sociology, psychology, human geography, economics, anthropology and their respective branches are a few examples of research fields in which studying place is either fundamental or plays an important role [7]. In geography, particularly in human geography, the concept is essential and it has been described as the “science of places” by the well-known French geographer Paul Vidal de La Blanche [8] apud [1].
Studies have been conducted to find spatial patterns of sense of place dimensions as well as to correlate them with social, psychological, geographic and cultural variables [9]–[14]. In addition, quantitative analysis has been made before in the scope of geographic information. Mapping
place dimensions has not become commonplace due to constraints which arise from the inherent
uncertainty of the conceptualizations and scarce operationalization frameworks [9],[14]. According to Acedo et al. [15], shortcomings can also come from two main sides: representing sociopsychological phenomena may not be suitable for providing insights to sociopsychological research itself; and reducing subjective and dynamic constructs into geographic primitives brings up different elements and degrees of uncertainty.
Although sense of place has been thoroughly analyzed through theoretical frameworks as well as through spatial methodologies on GI systems, spatial analysis of their dimensions for foreign residents in a new urban setting has rarely been carried out. Studies on sense of place regarding international residents have been mainly conducted through the use of qualitative approaches and mostly with forced immigrants in an attempt to understand the differences between place bonds with the new settings and with their country of origin [16]. Nonetheless, using geographic information principles and tools for investigating sense of place and other social constructs has been done in the city of Lisbon context [9],[15],[17],[18].
The study here presented uses the conceptual scheme found in the context of human geography and environmental psychology, fields that study the relationship towards places through the concept of sense of place [7]. Sense of place’s intricacy does not stem only from its transdisciplinary character, but also from the construct itself, as the connections people establish with specific places are an elaborate combination of psychological processes, environmental features, individual characteristics, socioeconomic factors as well as cultural aspects [9]. Through the implementation of tools and techniques provided by the geographic information field, the distinct relationships foreign residents have towards the city of Lisbon were spatially assessed. Data was gathered on a map-based survey and spatial analysis was carried out aiming to
investigate the geographic dimension of sense of place experienced by foreign residents living in Lisbon. Discussion of the results was based on the interpretation of the different spatial patterns, localities and relationships of different dimensions of sense of place. In addition, mechanisms through which the participant groups develop distinct facets of sense of place in the urban context were also discussed.
1.1 Research aspects
Depicting the spatial dimensions of the relationships between people and the city is part of the human component of urban intelligence [9]. Albert et al. [9] interpret urban intelligence according to Roche’s [19] definition as “the urban stakeholders’ ability to depict the connected complex
urban places” by considering the human aspect of smart cities (p. 1). In general, this investigation
can help planners and decision-makers in various applications, such as: designing solutions for urban planning; supporting business in location-based services [11]; planning public health policies [11]; planning tourism and conservation of biomes, green areas and ecosystems [13]; planning social housing policies [20]; and creating frameworks for investigating the urban profile of civic engagement and social capital [21]. This is possible because different groups of people are attached to different places, enabling their characterization according to the objectives of specific applications. Therefore, methods and approaches used here are aimed to obtain the spatial picture of sense of place dimensions of foreign residents of Lisbon.
The term imprint adopted here carries the meaning of lay-out, surface or impression of the spatial dimension of sense of place and its dimensions. The research here conducted is aimed to obtain the geographic imprint of different sense of place dimensions experienced by foreign residents of the city of Lisbon through the implementation of tools and techniques provided by the geographic information field. The research questions hereby outlined are the following:
• Within the urban landscape, what are the meaningful places of foreign dwellers in Lisbon? • If short-term foreign dwellers feel sense of place towards different areas of the city, how
are they spatially characterized?
• What are the differences between the geographic distribution of sense of place dimensions between and within short-term and long-term foreign residents?
• What are the processes through which spatial distinctions of dimensions of sense of place emerge between and within participant groups?
By these means, the objectives in this study are shaped to answer the research questions through the following:
• Examining the spatial extent of sense of place dimensions of foreign residents in Lisbon • Comparing and characterizing patterns and properties of the geographical dimensions of
each sense of place dimension between and within each participant group
• Discussing the possible mechanisms that cause the spatial differences of facets of sense
of place for the study groups
The methodology here carried out was aimed to gather data regarding the different bonds, feelings and relationships foreign residents of Lisbon have towards places in the city through a map-based survey designed to collect spatial data. The lay-outs of the different dimensions were built based on the survey answers, which were processed to result in the spatial picture of the
place-people connections. Then, methods of spatial comparison metrics and statistics, cluster
analysis and map production were applied in order to examine patterns, understand correlations, identify hotspots, characterize clusters and compare extents.
2
Literature review
2.1 Sense of placeA notorious figure in place studies in human geography, Yu-Fu Tuan, defines sense of place (SoP) as a “universal affective tie that fulfills fundamental human needs” [4] apud [16], (p. 1). According to Stedman [22], people build SoP over time based on meanings attributed to the settings as SoP is not intrinsic to the physical world, but lies on symbolic representations people develop towards
places through experience and interaction. Therefore, SoP stems from the interplay of visual,
historical, psychological, environmental, social and even spiritual factors. Vanclay [7] states that is necessary to break down SoP into components as the term is too broad. The author cites the definition of SoP according to the Australian Government’s State of the Environment Report: “an
intensely personal response to the environment, social and natural, which the individual experiences in daily life, at a broader level it can be the individual’s perception of the whole region, state or nation” [7], (p. 7). As for Williams and Stewart [23], they define SoP as “the collection of meaning, beliefs, symbols, values, and feelings that individuals or groups associate with a particular locality” (p. 19).
However, the broad character of the construct as well as its multidisciplinary nature has let different fields build conceptual schemes on which several methodological frameworks were developed [13]. Nonetheless, most frameworks consider SoP a multidimensional concept as it encompasses distinct aspects of how people connect to places. One of the first studies to elucidate the multidimensionality of SoP was carried out by Jorgensen and Stedman [24], who performed a statistical analysis of questionnaires using attitude theory as their theoretical foundation. From then on, researchers have been performing different kinds of analysis to either unravel or describe the different dimensions that the SoP construct can carry [11],[13],[15],[24]. 2.2 Dimensions of sense of place
There are a multitude of terms in the literature which not only caused confusion but also blocked advances in the research field for a while [25]. As pointed out by Hidalgo and Hernández [25] terms such as community attachment, sense of community, place attachment, place identity,
place dependence and sense of place had been used in ways that it became difficult to discern
employ questionnaires and factor analysis to distinguish dimensions of SoP. As pointed out previously, the pioneer study of Jorgensen and Stedman [24] carried out with lakeshore property owners suggested the existence of three dimensions: attachment, dependence and identity. The authors define place attachment as the “individual’s affective or emotional connection to a spatial
setting”; place identity as the “individual’s cognitions, beliefs, perceptions or thoughts that the self is invested in a particular spatial setting”; and place dependence as the “perceived behavioral advantage of a spatial setting relative to other settings” [24], (p. 238).
A certain degree of confusion also arises between the terms sense of place and place attachment, as the former is mostly used by human geographers and the latter by environmental psychologists [7],[25]. Shumaker and Taylor’s [26] definition of place bonding is the “person-place bond that
evolves from specifiable conditions of place and characteristics of people” [26] apud [27], (p.
221). Environmental psychologists Scannell and Gifford [16] introduced their study defining
attachment as the “bonding between individual and their meaningful environments”, (p. 1). Both
Shumaker and Taylor’s and Scannell and Gifford’s conceptualizations are therefore similar to the holistic approach of sense of place geographers tend to adopt.
In fact, environmental psychology is the main field which has been delving thoroughly into the different SoP dimensions using surveys based on psychometric scales [21],[23],[24],[28]–[30] For instance, Williams and Vaske [31] described and quantified meanings people created towards different land use settings. Their analysis of questionnaire data allowed the authors to distinguish two dimensions of place attachment: place dependence – the physical quality of a place in terms of features and conditions that can support desired activities, also called functional attachment; and place identity – the symbolic quality of a place in which affective relationships develop as a component of self-identity, also called emotional attachment. Therefore, the authors assessed
place attachment as one unit comprised of two dimensions: dependence and identity.
As for Pretty et al. [10], their conceptual and empirical framework contained three separate dimensions for the SoP construct: place attachment, place identity and place dependence. Hence, their research approach is similar to the work of Jorgensen and Stedman [24]. The authors considered place identity (PI) as a “symbolic extensions of the self” (p. 275) built through experiences within the place; place attachment (PA) as the emotional bonding people have with a place; and place dependence (PD) as a “goal-oriented behavioral component” (p. 275), meaning the conditions of a place to satisfy specific activities of the individual [10]. Although early works have treated attachment, identity and dependence as separate constructs based on attitude theory, other studies have demonstrated that the PI and PD can be treated as dimensions of PA. Brown and Raymond [32] investigated the validity of a two-dimensional model for PA combining landscape values through exploratory factor analysis, deriving high-reliability results. Nevertheless, the authors mention that “we also recognize other researchers consider place
attachment as a separate place dimension, to be examined alongside place identity and place dependence” (p. 92).
In addition to the definitions described previously, some authors also mention and define other components of SoP, such as: place satisfaction – an overall judgement of the “perceived quality
of a setting” [22] (p. 672); place familiarity or place awareness – the level of knowledge people
have regarding a certain place [7]; place commitment – the measure of how much people are willing to contribute to their local place [7]; nature bonding – the connection to the natural environment [33]. Researches have also drawn parallels between place and social concepts. For instance, Manzo and Perkins [34] built a framework on which social capital and sense of place dimensions were connected based on their cognitive, affective and behavioral subdimensions. Using a similar theoretical framework (Figure 2.1) and existing literature, Acedo et al. [21] carefully schematized the associations between social capital and sense of place components. The correlation between the constructs was evident due to the common variables used to build these dimensions.
Figure 2.1. Theoretical framework used by Acedo et al. for establishing relationships between social capital and sense of place dimensions (modified scheme from Acedo et al. [21]).
The existing frameworks for analyzing and defining SoP dimensions in place research were summarized by Rollero and Piccoli [29] based on the literature review carried out by Hernández
et al. [28]: (i) PA and PI as the same concept; (ii) PA as a dimension of PI; (iii) PI as a dimension
of PA; (iv) PA and PI as dimensions within a supra-ordered concept. The concise literature review on the dimensions of SoP here presented do not make justice to the multitude of conceptual frameworks and definitions within the scope, as expressed by Scannel and Gifford [16]: “these
definitions remain scattered in the literature, and thus the theoretical development of the concept has not yet been acknowledged, nor has a more general definition of place attachment been agreed upon” (p. 2).
2.3 Operationalizing sense of place
Sense of place is not accessible through direct observation, yet it can be inferred based on
people’s responses and actions [24]. In order to analyze its dimensions and quantify them, researchers have combined questionnaires, psychometric scales and various statistical methods. The predictors and variables used to structure psychometric scaled questionnaires vary in the literature depending on the conceptual or methodological framework. For example, Lewicka [35] assessed PA based on different attributes: demographic factors – such as age, education and gender; physical factors – type of housing and building size; social factors – neighborhood ties and sense of security.
Structural equation modelling is often used in environmental psychology to assess and define the relationships between different SoP dimensions and their predictors. Rollero and Piccoli [29] used both quantitative and qualitative data to build a structural equation model in which cause indicators such as cultural level, age, gender, social relationships and length of residence were surveyed to assess their contribution in forming place attachment (Figure 2.2).
Figure 2.2. Place attachment prediction model with regression weights, variances and correlations obtained after statistical analysis of self-reported questionnaires (from Rollero and Piccoli [29])
Different latent variables and indicators have been hypothesized and tested. For instance, Deutsch et al. [36] built their structural equation model of sense of place using six different dimensions – attachment, dependence, identity, satisfaction, atmosphere and community – which in turn had several different survey questions as indicators, and explanatory variables such as sociodemographic attributes and “description of the day”. Scannel and Gifford [16] explored all commonalities of sense of place in different fields through an exhaustive literature review and built a tripartite organizing framework – PPP. The person-process-place framework (Figure 2.3) splits
place attachment into three main components: person – who is attached; process – how they are
attached and place – to where in space an individual or community is attached. According to the authors, the PPP framework can aid the operationalization of the constructs both in quantitative and qualitative analysis of sense of place.
Figure 2.3. The PPP tripartite framework of place attachment (from Scannel and Gifford [16]). 2.4 Sense of place and geographic information
Although sense of place and its related constructs are social-psychological concepts, they are fundamentally attached to a geographical dimension [9]. The space-place dichotomy has been
extensively discussed by human geographers, yet it has not been substantially approached within the GIScience. Merschdorf and Blaschke [37] argued that the terms have been used almost interchangeably in the literature. The authors carried out an in-depth revision of the role of place in GIScience regarding the formalization and operationalization of place constructs. They identified that the branches of VGI/crowdsourcing, semantics and ontologies are areas concerned in operationalizing place.
Before research was conducted through combining place studies and geographic information, spatial dimensions were only considered as a scale of attachment strength such as towards the house, apartment, neighborhood, city and country. Lewicka [35] demonstrated that perishes and districts are poorly consolidated through cognitive mechanisms due to the arbitrary character of administrative areas, causing people to report lower values of place attachment towards these scales. According to the author, administrative boundaries generally lack symbolism for building cognitive spatial representations as people tend to abstract spatial information in the form of places.
In the scope of natural resource management, Brown and his colleagues have applied map-based methodologies for measuring SoP together with landscape values [13],[14],[32]. As brought up by Brown [13] at the time, the concepts lacked suitable operational definitions, limiting their applications and requiring the need to “connect special place locations (geography of place) with
their underlying perceptual rationale (psychology of place)” (p. 19). In their pioneer research,
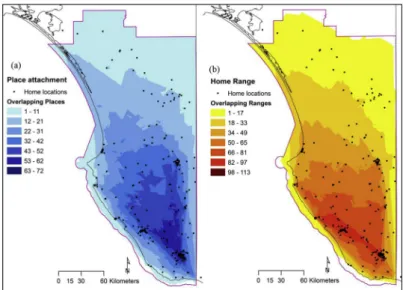
Brown et al. [14] mapped PA using internet-based PPGIS combining variables of landscape values, PA and home range. Figure 2.4 shows the map-based survey results of place attachment and home range considering their area overlap.
Figure 2.4. Spatial distribution of overlapping values for place attachment and home range based on hand drawn polygons from the PPGIS survey (from Brown et al. [14]).
Jenkins et al. [11] gathered crowdsourced data from Twitter and Wikipedia to analyze collective SoP in different cities. Their study combined social media, GIS and SoP for “gaining an
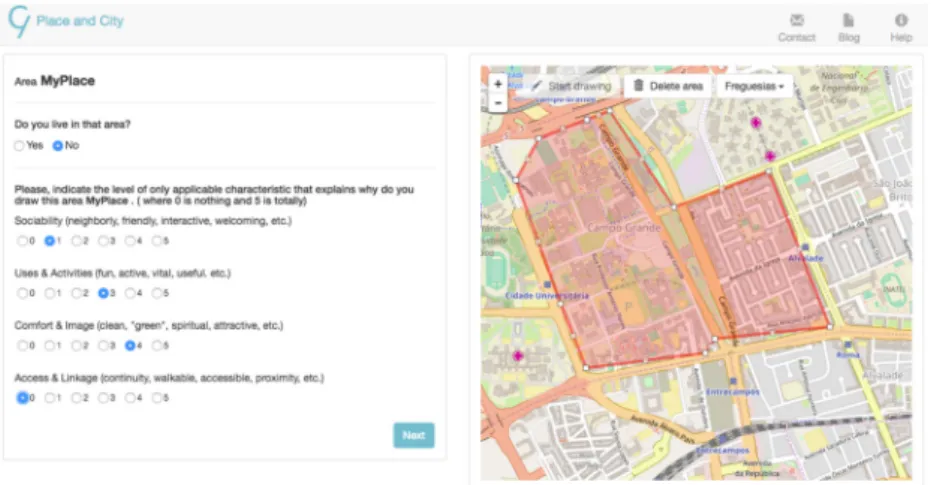
the authors refer to as “moving from a geometrical view of the world around us to a platial view” (p. 17). In their research on spatializing SoP, social capital and civic engangement, Acedo et al. [18] developed a GIS platform to “render space as a subjective place that covers the people’s
feeling towards places and human relationships” (p. 2). Users of the platform are able to draw
polygons according to questions designed to assess each social-psychological construct, enabling visualization and analysis (Figure 2.5). Their motivation was to investigate predictors, create a social-spatial layer of the city (Lisbon) and demonstrate the relevance of GIScience in citizen social information [18].
Figure 2.5. Application built by Acedo et al. to gather users’ data on sense of place, civic engagement and
social capital (from Acedo et al. [18]).
Also in the city of Lisbon, Acedo et al. [17] examined the spatial relationship between areas where people feel SoP and areas that people take part in activities. The data for SoP was acquired using the application developed by Acedo et al. [18], while activity was represented by geolocation of
Twitter posts. Their spatial analysis concluded that social media data can serve as a proxy for
bounding SoP spatial dimensions. Along similar lines, Acedo et al. [9] investigated the spatial relationship between SoP and social capital also using the same application developed by Acedo
et al. [18]. Their motivation was to show the possibilities of VGI/PPGIS in understanding social
synergies to promote urban intelligence, treating the city as a network of places. Acedo et al. [15] took a step further by implementing the topological relationships between SoP, social capital and
civic engagement into a structural equation model. In fact, imbuing the topological relationships
into the model resulted in better statistical fits in almost all cases [15]. 2.5 Sense of place and mobility
As discussed by Gustafson [20], mobility includes international or internal migration, residential mobility inside the same region, daily commuting as well as leisure or occupational traveling. One of the consequences of a mobile world is the development of sense of place towards more than one place, establishing bonds to multiple places through different processes of meaning formation [20],[38]. As pointed out by some researchers, literature shows that sense of place and mobility are classically seen as opposite or exclusive phenomena, but these studies might overlook some qualitative distinctions in SoP when comparing the concept between more and less mobile
individuals [20],[39]. This is due to the fact that people who are more mobile may develop relationships towards places by creating meanings through different processes when compared to native people [20].
A study with middle class immigrants in Manchester demonstrated that although a strong place
attachment was developed, its characteristics were a reflection of a selective preference of
aesthetic and physical attributes of the place [40] apud [20]. However, while immigrants are adjusting to the new settings, commonality and diversity can play different roles in forming
attachment; people seek familiar physical features and local immigrant communities or look for
exposure to new ways of life, or even a combination of both [41]. Length of residence has often been a direct measure of place attachment in psychometric scales, but other researchers argue that duration should be treated as a predictor [20]. The reason behind this is that spatial knowledge increases over time, enabling people not only to acknowledge their surroundings but also to acquire more information and consequently develop new feelings towards new places [41]. Immigrants away from home may develop SoP towards the neighborhood, the city and also the country, through an active effort to help facilitating the transition [41].
Based on semi-structured interviews, Chow and Healey [42] assessed the transitional process of first-year undergraduate students who had moved away from home to study. The authors qualitatively explored the mediating variables that impact on place attachment and place identity, which are dynamic and prone to disruption since these relationships evolve both through space and time. The authors conclude that during the transitional context, sense of place naturally manifested during the adjustment to a new socio-spatial environment.
One of the reasons high correlation between sense of place constructs is often present lies on the fact that most of the research focus on native or long-time residents [28]. According to Hernández
et al. [28], concepts overlap because natives or long-term residents usually report high scores for
all dimensions. Their study showed that different place dimensions yielded more variability on their intensities for non-native residents. The authors concluded their study pointing out the need for conducting more analysis with people of different nationalities in order to examine the role of cultural differences and the different processes through which these individuals construct distinct
place identities [28].
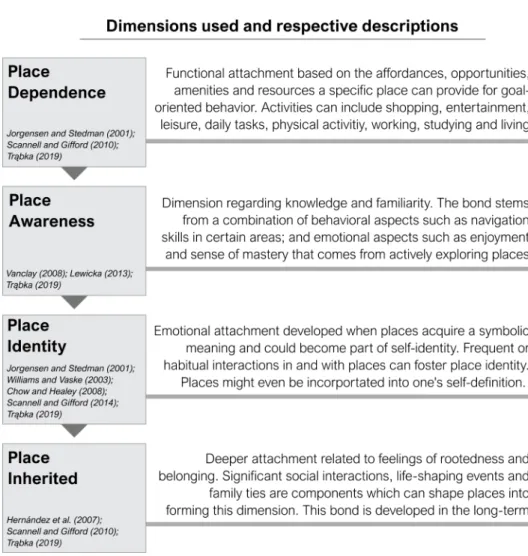
2.6 Theoretical framework
A four-dimensional model of sense of place was adopted in the study (Figure 2.6). The framework was conceived based on a combination of Trąbka’s [43] defined structure and the existing literature on the topic. Trąbka [43] studied how different dimensions of sense of place emerged among voluntary polish immigrants in Oslo and London. The author conducted semi-structured in-depth interviews and revealed that their sense of place was dynamic and could be dissected into a dynamic ladder: place dependence – affordances and new opportunities; place discovered
– sense of mastery and pleasure from exploring place; place identity – arena of self-expression;
Figure 2.6. Sense of place dimensions used in this study with their respective descriptions. The four-dimensional model was drawn from Trąbka’s [43] as her work considered and deducted important aspects pertinent to the study here carried out, such as: dimensions are considered dynamic both in space and time; dimensions tend to develop sequentially; participants’ activities concerns aspects of the urban context; individuals can either skip the development of specific dimensions or not develop certain bonds at all; and finally, participants are foreigners currently living in a new urban setting. Therefore, the main dimensional structure here defined is an attempt to fit a sequential model of sense of place based on residence time. The spectrum on which sense
of place is dismembered considers the evolution from immediate perceptions [44] and functional
attachment to emotional attachment and deep relationships with places.
Nevertheless, Trąbka’s [43] sense of place dimensions are derived from a deductive approach within a rather specific research context. As a consequence, the theoretical framework currently adopted also defines sense of place dimensions based on the literature review on the topic, mainly withdrawn from studies in environmental psychology. Furthermore, Trąbka’s place discovered was replaced here by place awareness, which not only considers the discovery and exploration relationship towards places, but also carries cognitive aspects of familiarity, representing a transition from functional to emotional attachment. Final dimensions assessed here were: place
dependence – functional attachment; place awareness – exploration and familiarity (transition
from functional to emotional attachment); place identity – emotional attachment and self-identity; and place inherited – deep emotional attachment strongly correlated to aspects of social capital. In addition, literature confirms that sense of place dimensions are distinct but often highly correlated with each other, although felt with different intensities by different people in different contexts [10]. Therefore, this research acknowledges the dynamic and interrelated nature of
sense of place dimensions while investigating their spatial relationships.
3
Methodology
3.1 Overview and study design
Methodology consisted of two main segments: map-based survey for data collection and analysis of gathered data. Study design with described steps is found in Figure 3.1 and the study area was the municipality of Lisbon, Portugal. Next sections will elucidate all the steps, tasks and tools used throughout the research.
3.2 Survey
3.2.1 Survey123 and survey structure
The platforms used to design and carry out the survey were the Survey123 online and desktop environments. Survey123 for ArcGIS is a tool developed by ESRI for creating and sharing customized surveys both on web and mobile formats [45]. Survey123 online had several limitations regarding the type of questions, structure format and online map compatibility; therefore, Survey123 desktop platform was used to build the survey and Survey123 online mainly for final editing, sharing, data downloading and dashboard observation.
Both platforms were connected through ArcGIS Online and used concurrently for adjusting, designing, managing and publishing the final survey. However, Survey123 desktop was used for building the survey based on XLSForm tool, which is the framework for designing questionnaires in the desktop environment. XLSForm is a standard for authoring and sharing forms in Excel through a specific syntax for creating XLS based questionnaires [46].
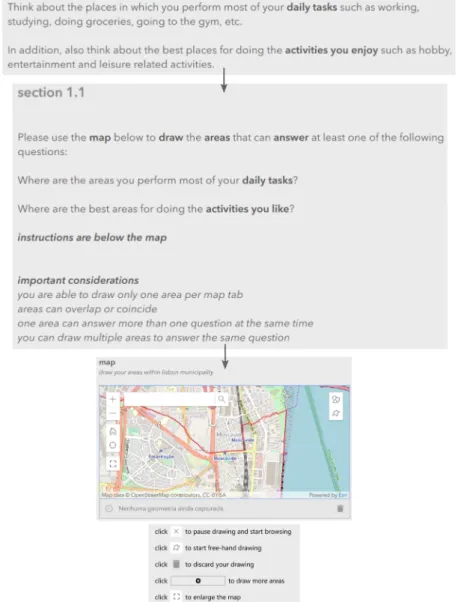
The XLSForm syntax allowed all required functionalities of Survey123 platform such as different types of questions, including geoshape questions for hand-drawing polygons on map; different logic and validation rules for constraints and conditions; question grouping; as well as the enablement of inserting media such as images. Figure 3.2 shows a segment of the survey in XLSForm format on Survey123 desktop.
Figure 3.2. Initial sections of the survey on XLSForm format. Type column shows examples of specific syntax and constraint column displays one example of a regex expression for postal code filling restriction. The complete survey can be found in Annexes in both English and Portuguese versions. First, participant would find information regarding the aim of the survey, approximate time of completion, recommendations and contact details. Then, in order to proceed and fill the survey, participant had to agree with the stated data terms.
Secondly, time of residence, home country and postal code of residence location (optional) questions were asked. Each of the four sections corresponded to a dimension, split into two subsections: the first subsection incited the participant to think about specific places according to the dimension (Figure 3.3); in the next page the subsection contained the questions asked to guide the map drawing, the map itself for drawing the areas as well as instructions; the second subsection consisted of a likert scale question to obtain additional information regarding the intensity of the specific relationships towards the drawn areas (Figure 3.4). The order of the sense
of place dimensions’ sections in the survey was defined according to the theoretical framework.
In addition, answering the place dependence section was compulsory since it represents the dimension of daily tasks, activities and routine based place interactions.
Map-based functionality for hand-drawn polygons is only enabled on Survey123 desktop through the implementation of the geoshape question type of XLSForm. For each main section, one
geoshape question was added to allow participants to draw areas within the city of Lisbon.
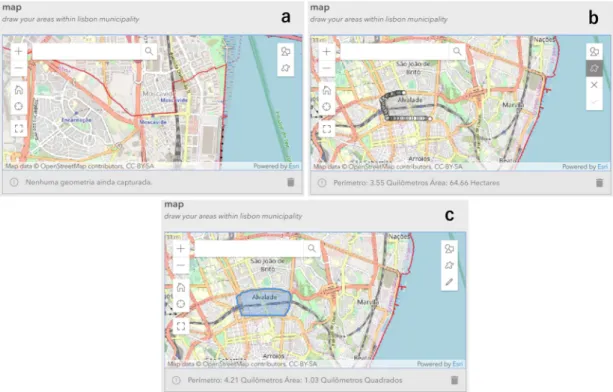
Participants could interact with the online map by zooming, browsing, searching for specific regions and enlarging to full screen mode. Polygons could be built through either defined geometric shapes or freehand drawing, and participants could delete and edit the shapes after delimitating them. These steps are shown in Figure 3.5.
Figure 3.3. First subsection of the place dependence section of the survey.
Figure 3.4. Second subsection of the place dependence section of the survey.
Participants were encouraged to draw more than one area for each dimension, and in order to do so, instructions were added so they would be able to add other maps for polygon drawing since Survey123 platform does not allow to draw more than one polygon per map. Therefore, after participants were finished with each polygon, they either went to the next subsection or clicked on a button that would add another map for drawing. This could be repeated as many times as desired by the participant.
Figure 3.5. Survey steps of drawing polygons on the map: (a) red line corresponds to Lisbon’s municipality boundaries; (b) area drawing using the freehand option; (c) final single polygon with enabled edition and deletion.
The desktop platform supports different base-maps for the geoshape questions, however, as the study area was within Lisbon’s municipality, adding its boundaries on the map was important. In order to do so, a feature class of the city limits was obtained in the official city council open data website – Lisboa Aberta [47]. Then, the feature class was added to a map on ArcGIS Pro and shared online as a web-map on ArcGIS Online using OpenStreetMap as the base map. Lastly, the web-map was manually added to the survey through adjusting map parameters on Survey123 desktop files.
Succeeding the completion of the survey design, feedback was obtained through a questionnaire. The link to the questionnaire was added in the end of the survey, while the survey was shared among six people, split into participants who were either familiar with GIS platforms or not. Feedback questionnaire was split into a sequence of likert questions and text questions regarding suggestions, recommendations, approximate time of completion and overall feedback. The questionnaire can be found in Annexes. Following feedback collection, minor adjustments were made constrained within the limitations of the platform.
3.2.2 Survey carryout
Both versions of the survey (English and Portuguese) were first shared online with foreign students and researchers of the Information Management School of Universidade Nova de Lisboa. Throughout the process, participants were encouraged to share the survey link with friends, family and acquaintances, as long as they were foreign residents living in the city at the time. Survey was also shared with representatives of other institutions in Lisbon. Contact was made via e-mail
with representatives and coordinators of these organizations; however, only members of universities’ faculties and research groups responded and shared the survey with foreign researchers, members and students of their institutions.
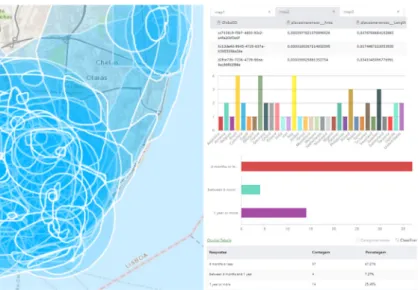
Survey was available online and actively shared during a time frame of 18 days. Survey123 online dashboard was constantly inspected throughout and following the sharing period. Information on the dashboard included total count of participants, count of participants per day, charts displaying question responses, attribute tables and maps with drawn polygons (example in Figure 3.6).
Figure 3.6. Information displayed on Survey123 online dashboard, including hand drawn polygons, attribute tables and charts.
3.2.3 Survey data retrieval
After deactivating the survey for public sharing, data was downloaded directly from Survey123 online platform as geodatabases. Each version of the survey (English and Portuguese) was exported as a geodatabase containing nine feature classes. For each dimension, four feature classes represented the layers of drawn polygons and four relationship classes connected each polygon feature class to a separate feature class containing all other participants’ data.
3.2.4 Survey data pre-processing
Before starting analysis, pre-processing of data from Survey123 was carried out. All steps were done through ArcGIS Pro ModelBuilder. First, polygon feature classes from the Portuguese and English versions were merged to represent each dimension. Then, the participants’ responses of each version were added to the polygon layer by joining fields through the ID of the relationship classes.
Joining two different tables into the merged feature class resulted in a table with doubled field columns with values split into the two different survey versions. Therefore, for each dimension, new fields were added and calculated using each versions’ attributes. Reprojection was also performed as the original data was in a geographic coordinate system (EPSG: 4326) and spatial analysis was to be done. Therefore, the data was reprojected to a metric coordinate system (UTM Zone 29N).
The next step was to convert the answers of the likert questions from the neutral-strongly agree categorical scale to equal interval numerical attributes. Each layer of polygons representing a dimension for a participant would therefore have a numerical attribute. These values would then be summed and normalized in the overlay analysis to represent the collective strength of each dimension. In addition, all layers were clipped to Lisbon’s municipality, disregarding areas outside the city and considering polygon portions within the boundaries. Lastly, length of residence attribute was selected to split the dimensions between two participant groups. The division was done based on a one-year threshold: short-terms consisting of participants who had been living less than a year and long-terms those who had been living more than a year in Lisbon. The one-year threshold was chosen aiming to obtain spatial distinctions between newcomers and long-terms according to the proposed theoretical framework.
3.3 Analysis
3.3.1 Overlay analysis
The overlay analysis was carried out using ArcGIS Pro ModelBuilder and its purpose was to quantify polygon overlap in order to represent polygon density. Overlapping areas would then represent different intensities of the dimensions as spatial concurrence of drawn polygons represent shared regions of sense of place among participants. The methodological framework characterized by using surveyed polygons and following calculation of their overlap areas was adopted in Brown’s [14] study on mapping and measuring place attachment.
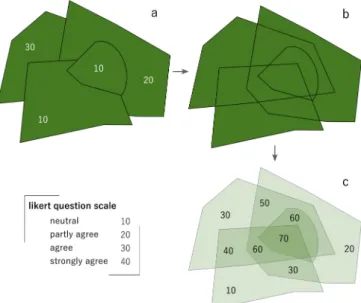
Steps of the overlay analysis were applied to each feature class representing each dimension for both participant groups – short-terms and long-terms. The first operation was to perform a union task followed by a multipart to singlepart as well as a spatial join in order to obtain all the polygons’ intersections and the summed value of the likert questions according to the overlapping areas. The steps of the first operation are exemplified in Figure 3.7.
Figure 3.7. Simplified scheme of the first operation steps in the overlay analysis. (a) each polygon layer carried the categorical attribute of the likert question, which was converted to a numerical scale. (b) and (c) the steps were applied to quantify polygon overlap based on the numerical scale values.
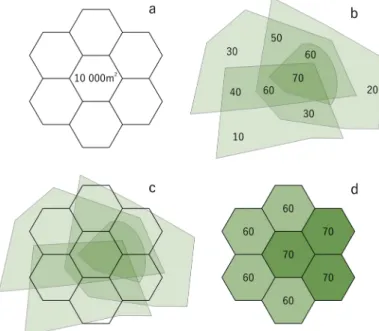
The next operation was to overlay the results obtained from the first operation to a hexagonal tessellation. A hexagonal mesh was used to improve visualization of spatial patterns as well as to facilitate other operations such as creating a unified table of attributes based on the hexagons’ IDs. The first step was to set the unit area value of the generated tessellation. The final mesh was clipped to Lisbon’s municipality boundaries and each hexagon had an area of 10 000m2. Chosen size was based on the approximate area of certain city blocks of the Freguesia de Avenidas Novas, near the centroid of Lisbon’s municipality.
The following step consisted of performing the spatial join of the polygon overlap layer into the hexagonal mesh. In other words, transferring the summed overlap polygon values to the hexagonal tessellation. The rule used to perform the spatial join was the maximum value of intersection. Therefore, in an attempt to represent the scalar variability of to a certain extent, hexagons would attain the highest value intersected regardless of the resulted overlap area on the hexagons themselves. Figure 3.8 shows the scheme of the polygon to hexagon mesh operation.
Figure 3.8. Scheme of the hexagon overlay steps. (a) generation of a hexagonal mesh; (b) results of the polygon overlap operation; (c) spatial join of the polygon overlap into the hexagonal mesh; (d) results of the spatial join using the maximum value intersect rule.
All operations were done with each dimension of each participant group, as well as with all participants’ answers combined. For each dimension, polygon overlay results of short-term, long-term and of all participants were used to carry out the hexagon overlay. Polygon overlay and hexagon overlay operations were also performed combining all dimensions, resulting in the general sense of place picture of short-terms, long-terms and all participants. The sense of place combined layer did not consider unanswered dimensions by participants, as it was calculated through the overlay of all existing polygons. The final steps consisted of normalizing the hexagon overlay values based on the range of each group and dimension into a 0 to 1 scale. Lastly, final products were displayed in maps and used in the following phases of the methodology.
3.3.2 Spatial distribution
The spatial distribution of sense of place dimensions were displayed in three different map products. The first map products represent the spatial configuration of the scaled normalized values for each dimension and participant group in a continuous color ramp using the direct results of the overlay analysis. They were used for the initial examination of intensity distribution of sense of place dimensions throughout the city.
The second products were done through selecting values of collective sense of place for each dimension and each participant group. Collective dimensions were represented by areas which had values higher than the upper quartile (highest 25%) for each normalized distribution within short-term and long-term foreign residents. These areas therefore would represent statistically significant regions of shared sense of place among participants. After selecting the areas, maps of each dimension were built to visualize their spatial distribution, patterns, unique and common areas for each participant group and consequently to provide the initial interpretation and discussion of the results. The third map products were done using the outline of the selected areas, while displaying all dimensions for each participant group. Outline maps were built to provide initial insights and visual overview regarding the spatial relationships between dimensions. All maps were made on ArcGIS Pro.
3.3.3 Hotspot analysis and high values distribution
Hotspot analysis was performed using Getis-Ord Gi* statistics tool in ArcGIS Pro on the selected regions of the previous section. Default parameters were used and areas representing high-value hotspots with 99% confidence (p-value < 0,01 and z-score > 2,58) were selected and extracted. As for high values distribution, selected areas (higher than upper quartile) had their symbology changed to the same intervals for short-term and long-term groups in order to compare regions carrying high values of sense of place.
High values and hotspots distributions were displayed in maps for each sense of place dimension as well as the combined dimensions. Hotspots of each participant group were put onto the same map and the map composition also contained the maps of high values for each group. The final maps were used for visual interpretation of their spatial configurations and discussion regarding the location of meaningful regions and places in the context of Lisbon’s urban landscape. 3.3.4 Statistics
Descriptive statistics and comparison statistics were done for all dimensions and between groups. Descriptive statistics included mean, standard deviation, media, mode, variance and kurtosis. Comparison statistics included Pearson correlation, ratio of coefficient of variation, histogram overlap – parameters obtained in the spatial comparison metrics elucidated in the next section. In addition, kernel density distribution of values higher than 80%; calculated area of hotspots, regions with values higher than the upper quartile as well as regions with intensity higher than 75%; and lastly, Jaccard’s index of the mentioned selected areas. Jaccard’s index or Jaccard’s similarity coefficient represents the similarity between two sets and is expressed by the
intersection divided by the union of the sets [48]. In the case of this study, it represents the intersection area divided by the union area of two geometries.
Comparison statistics were performed between short-term and long-term residents for each dimension and, with exception of kernel density distribution, between dimensions for each group. Jaccard’s indices and area values were calculated using ArcGIS Pro. Correlograms, scatterplots and kernel density distributions graphs were done using R data visualization libraries on RStudio. 3.3.5 SPAEF – Spatial Efficiency Metric
The Spatial Efficiency metric (SPAEF) was developed and brought forward by Koch et al. [49]. SPAEF consists of three equally weighted parameters: correlation, ratio of coefficient of variation and histogram overlap. Their research showed that SPAEF is a “tough criterion with three
independent components that individually penalize the overall similarity score” [49], (p. 1882). By
these means, SPAEF metric was used in this study in order to assess the similarity between spatial patterns of sense of place dimensions’ distributions between short-terms and long-terms, as well as between dimensions. SPAEF equation (modified from Koch et al. [49]) is expressed as:
SPAEF = 1 − �(𝛼𝛼 − 1)2+ (𝛽𝛽 − 1)2+ (𝛾𝛾 − 1)2 𝛼𝛼 = 𝜌𝜌(𝑎𝑎 , 𝑏𝑏), 𝛽𝛽 =�𝜎𝜎 𝑏𝑏 𝜇𝜇𝑏𝑏� � 𝜎𝜎𝑎𝑎 𝜇𝜇𝑎𝑎� , 𝛾𝛾 =� min �𝐾𝐾𝑗𝑗, 𝐿𝐿𝑗𝑗� 𝑛𝑛 𝑗𝑗=1 �𝑛𝑛𝑗𝑗=1𝐾𝐾𝑗𝑗
Where a and b are the patterns to be compared; α is the Pearson correlation coefficient between the patterns; β is the ratio of the coefficient of variations of each pattern (spatial variability [49]) and γ is the histogram intersection, while K and L are the patterns’ histograms and n the bin count. Pattern similarity is defined by the Euclidian distance to the optimal point (1,1,1), represented by the highest scores for each equally weighted component. Therefore, SPAEF metric ranges from −∞ to 1. The code developed to apply the spatial metric was made available on GitHub by the authors on their paper [49]. The algorithm reads the data as a transposed array; therefore, feature classes were first converted to raster on ArcGIS Pro with cell sizes smaller than the hexagon unit. Each pixel contained the value for each sense of place dimension. Before running the SPAEF metric, raster files were opened and read as arrays using GDAL library. SPAEF metric and its pre-processing steps were carried out using Python language on the open source Jupyter Notebook application. Final outputs included the SPAEF score and calculated values of its parameters. 3.3.6 Cluster analysis
Cluster analysis was carried out using all sense of place dimensions of all participants. Hierarchical cluster analysis was performed in order to obtain additional information on patterns and characteristics of the gathered data altogether. Hierarchical analysis was chosen due to the relatively small size of the dataset (87520 instances) and flexibility in the interpretation of cluster numbers based on the resulted dendrogram [50]. Agglomerative approach with Euclidian distance and Ward’s minimum variance method were used for computing the distance matrix.
Final number of clusters was defined based on visual interpretation of the dendrogram as well as the Elbow method. All steps were done using R language on RStudio platform. Steps of the algorithm and cluster analysis implementation were performed using several libraries from the
clustree R package. Subsequently, R data visualizations libraries were used to create parallel
coordinate and radar charts to aid cluster characterization together with ArcGIS Pro to display cluster spatial distribution on a map.
4
Results and discussion
4.1 SurveyThe survey was answered by 81 participants in total, from which 30 were long-term residents and 51 were short-term residents. In total, people from 35 different nationalities participated in the survey. Figure 4.1 shows the participants’ count based on their nationality. Brazil was the country which had the highest number of participants, consisting of approximately 30% of the total count.
Figure 4.1. Survey participants’ count based on their nationality.
For those who shared their residence location, most of their postal codes were assigned to central areas within the municipality, except for four participants whose residence were located outside the municipality, yet still in the metropolitan region. Although residence location was not implemented into the analysis, the following sections confirm the influence of residential and occupational locations in fostering sense of place. It was assumed here that among the participants there were graduate students, researchers or individuals who had finished their graduate studies in Lisbon, as the survey was not only but mostly shared within faculties of Universidade Nova de Lisboa and Universidade de Lisboa.
4.1.1 Survey data
Polygons outside the municipality were drawn, despite the inserted instructions guiding to delimitate polygons within the marked boundaries (Figure 4.2). Table 4.1 displays the total number of drawn polygons, the ratio of polygons per participant as well as the count of polygons drawn entirely outside the city for each dimension per participant group. Overall, total number of polygons decreased progressively from place dependence to place inherited, as well as the ratio between polygons per participant. In addition, long-terms drew relatively more polygons
compared with short-term residents for all dimensions. Another aspect observed in the responses (Figure 4.2) is the presence of polygons which either covered a considerably large portion of the city or the whole city itself. During following overlay analysis, considerably large polygons would have most of their extent represented by low intensity values of sense of place dimensions, as most of its area would not overlap with other participants’ polygons and therefore would not represent regions with significant shared sense of place.
Figure 4.2. On the left side, participants’ hand-drawn polygons mostly within Lisbon municipality. Maps on the right side show the polygons drawn outside the city of Lisbon. Maps a and b – place dependence; Maps c and d – place awareness; Maps e and f – place identity; Maps g and h – place inherited.
drawn
polygons polygons total polygons/participant ratio polygons outside the city
place dependence short-term 92 165 1,80 3
long-term 73 2,43 3
place awareness short-term 66 128 1,29 5
long-term 62 2,07 3
place identity short-term 50 108 0,98 5
long-term 58 1,93 2
place inherited short-term 35 83 0,68 2
long-term 48 1,60 6
Table 4.1. Number of drawn polygons, polygons per participant ratio and number of polygons delimitated entirely outside Lisbon.
Information regarding the response rate for each place dimension is found in Table 4.2. Participants drew polygons and answered the likert questions for place dependence as it was compulsory in order to complete the survey. As for the other dimensions, participants could choose to skip questions if one did not necessarily feel the particular bond, as guided through the instructions. Long-term residents had a significant higher percentage of answered questions in comparison with short-term dwellers. In addition, long-term residents had a consistent high percentage of answered questions for each dimension, whilst short-term residents’ responses had a lowering count as dimensions represented deeper connections.
Table 4.2. Response rate of each assessed place dimension of short-term and long-term groups. 4.2 Spatial distribution of sense of place dimensions
The following subsections display the results in map format of the overlay and hotspot analysis as well as spatial features of the different dimensions assessed in this study.
4.2.1 Intensity of sense of place dimensions: first map products
The first map products built are characterized by the display of the intensity of each dimension for short-terms, long-terms and combined responses with normalized values within each dataset range.
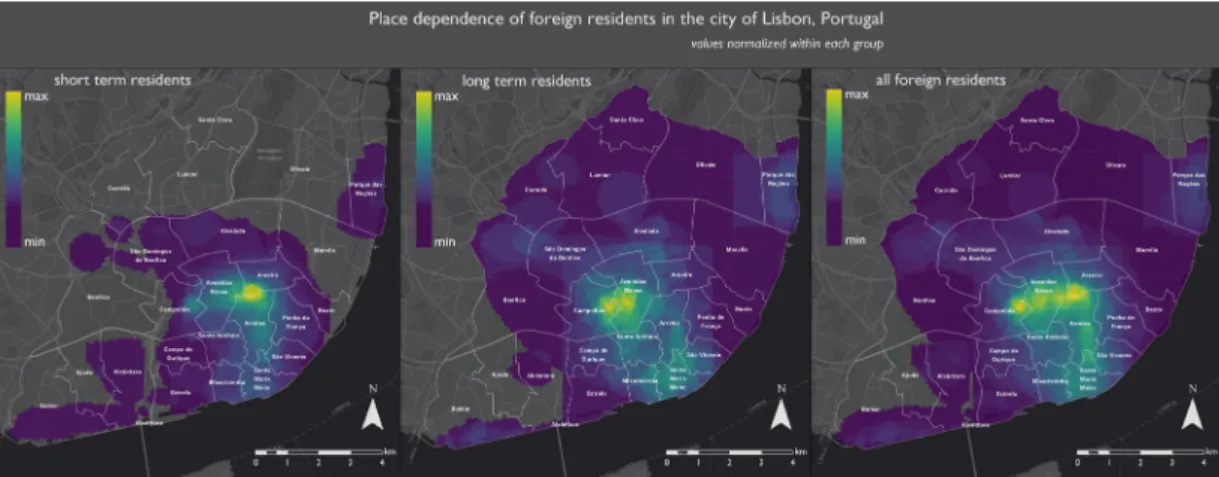
4.2.1.1 Place dependence
Short-terms’ distribution has a prominent high intensity spot, high values in the central city area as well as lower values in some peripherical zones (Figure 4.3). As for long-terms, their higher intensity zone is located in another area and in general, the central area of the city displays higher values when compared to short-terms. When combining the groups, the high intensity zones are noticeable, yet high values are found throughout the central region of Lisbon.
dimension short-term (%) long-term (%)
place dependence 100 100
place awareness 80 97
place identity 69 87
Figure 4.3. Distribution of place dependence for short-term, long-term and all foreign residents. 4.2.1.2 Place awareness
Short-terms’ high intensity zones (Figure 4.4) are characterized by a larger extent when compared to dependence (Figure 4.3). As for long-terms, the highest strength of awareness is concentrated in two adjacent areas, yet its distribution of high values is similar to the one described for short-terms. As a result, when combining the two participant groups, awareness is encountered throughout the whole city, but bearing higher intensity across the center of the municipality.
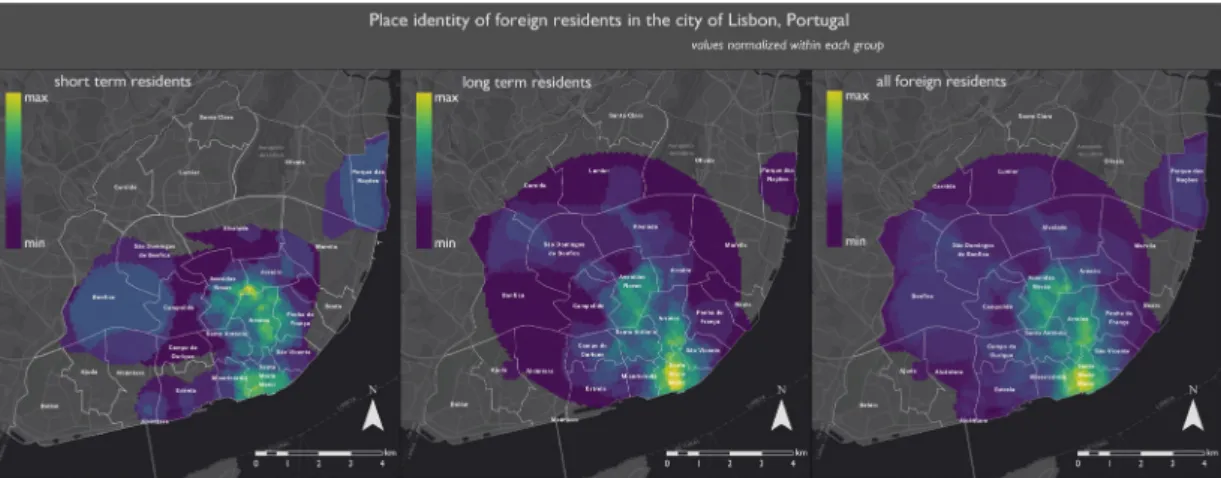
Figure 4.4. Distribution of place awareness for short-term, long-term and all foreign residents. 4.2.1.3 Place identity
Maps show a larger extent of the highest intensity zone for long-terms while short-terms’ distribution of higher values seems to be more homogenous (Figure 4.5). In addition, similar to the previous dimensions, identity is concentrated in the central area of the city. When analyzing all residents, the higher intensity zone for long-term dwellers is a salient feature.