CERN-EP/2016-199 2016/11/23
CMS-HIN-15-011
Decomposing transverse momentum balance contributions
for quenched jets in PbPb collisions at
√
s
NN=
2.76 TeV
The CMS Collaboration
∗Abstract
Interactions between jets and the quark-gluon plasma produced in heavy ion colli-sions are studied via the angular distributions of summed charged-particle transverse momenta (pT) with respect to both the leading and subleading jet axes in high-pTdijet
events. The contributions of charged particles in different momentum ranges to the overall event pTbalance are decomposed into short-range jet peaks and a long-range
azimuthal asymmetry in charged-particle pT. The results for PbPb collisions are
com-pared to those in pp collisions using data collected in 2011 and 2013, at collision en-ergy√sNN = 2.76 TeV with integrated luminosities of 166 µb−1and 5.3 pb−1,
respec-tively, by the CMS experiment at the LHC. Measurements are presented as functions of PbPb collision centrality, charged-particle pT, relative azimuth, and radial distance
from the jet axis for balanced and unbalanced dijets.
Published in the Journal of High Energy Physics as doi:10.1007/JHEP11(2016)055.
c
2016 CERN for the benefit of the CMS Collaboration. CC-BY-3.0 license ∗See Appendix A for the list of collaboration members
1
Introduction
High transverse momentum (pT) jets originating from partons produced in the initial hard
scat-terings in ultra-relativistic heavy ion collisions have been used successfully to study the prop-erties of the quark-gluon plasma (QGP) [1]. The observation of the jet quenching phenomenon, first at the BNL RHIC [2, 3] and then at the CERN LHC [4–7], began the era of detailed experi-mental studies trying to assess both the redistribution of energy from the parton as it interacts with the QGP, and the possible QGP response to the propagating parton. In these studies, a suppression of strongly interacting hard probes has been observed, including suppression of charged-particle yields associated with jets when compared with pp data at the same center-of-mass energy. The dependence of jet quenching on the collision centrality (i.e. the degree of the overlap of the two colliding nuclei, with fully-overlapping nuclei defined as “0% central”), has also been established, with stronger quenching effects reported for more central collisions. Detailed studies at CMS and ATLAS report that not only the suppression of jet yields, but also the relative differences between the momenta of the leading and subleading jets in dijet events increase in more central collisions, indicating that the jet quenching effect depends on the path length of the parton traversing the medium [4–6]. Corresponding measurements from the most peripheral (i.e. least central) PbPb data in these studies and from pPb collisions [8] are found to be similar to those in pp collisions, implying that the jet quenching phenomenon is caused by hot nuclear matter effects. Recently, CMS reported results showing the difference in the dis-tribution of charged-particle pT between the subleading and leading jet hemispheres in PbPb
events with asymmetric dijets [9]. In these results, it is found that low-pT particles extending
to large angles away from the dijet axis in the subleading hemisphere must be considered in order to recover the momentum balance in these events. In addition to these momentum bal-ance studies, precise measurements of the fragmentation pattern [10] and the distribution of charged-particle pTas a function of radial distance from the jet axis [11], have also shown that
the jet structure is modified by the medium. These modifications extend to large distances in relative pseudorapidity (∆η) and relative azimuth (∆φ) with respect to the jet axis [12]. These studies have found softening of the jet fragmentation in PbPb collisions with respect to pp events, with the most significant excess of soft-hadron yields observed in more central PbPb events.
The analysis presented in this paper probes the details of the momentum distribution in dijet events, taking advantage of the high production rates for dijet events at the LHC, and the CMS detector’s ability to measure charged-particle tracks over an extended η and pT range.
Two-dimensional correlations between the reconstructed jets and charged-particle tracks (jet-track correlations) are constructed in∆η and ∆φ. These correlations are used to decompose the over-all event pT distribution into three components: two 2D Gaussian-like peaks associated with
the leading and subleading jets, and an azimuthal asymmetry in the distribution of momentum under the jet peaks. Results for each component are presented as a function of∆φ, and the jet momentum density profile (“jet shape”) is also presented as a function of the radial distance from the jet axis in the ∆η-∆φ plane. Measurements are performed differentially in collision centrality, charged-particle transverse momentum (ptrk
T ), and dijet asymmetry. These detailed
differential studies provide input for theoretical models that attempt to describe the patterns of energy loss by a highly-energetic probe passing through the QGP.
The data used in this analysis are from PbPb collisions at a nucleon-nucleon center-of-mass en-ergy of 2.76 TeV, corresponding to an integrated luminosity of 166 µb−1. For the reference mea-surement, pp data taken in 2013 at the same energy corresponding to an integrated luminosity of 5.3 pb−1are used. These studies allow for a detailed characterization of the two-dimensional (in∆η and ∆φ) ptrkT distributions for charged-particle tracks with respect to the jet axes,
provid-ing information about the topology of the event from the jet perspective and details about the ptrkT flow modification in dijet events.
In this paper, Section 2 gives general information about the CMS detector, and Section 3 outlines jet and track reconstruction procedures for PbPb and pp data. Section 4 describes the selection of events, while Section 5 details the procedure applied to analyze these events and evaluate systematic uncertainties. Section 6 presents results as a function of∆r (Section 6.1), ∆φ (Section 6.2), and integrated transverse momentum balance over the whole event (Section 6.3). Finally, Section 7 summarizes and concludes the paper.
2
The CMS detector
The central feature of the CMS apparatus is a superconducting solenoid of 6 m internal dia-meter, providing a magnetic field of 3.8 T. Within the solenoid volume are a silicon pixel and strip tracker, a lead tungstate crystal electromagnetic calorimeter (ECAL), and a brass and scin-tillator hadron calorimeter (HCAL), each composed of a barrel and two endcap sections. Two hadronic forward (HF) steel and quartz-fiber calorimeters complement the barrel and endcap detectors, providing coverage up to|η| <5.2. In this analysis, the collision centrality is
deter-mined using the total sum of transverse energy (ET) from calorimeter towers in the HF region
(covering 2.9< |η| <5.2). The ET distribution is used to divide the event sample into bins,
each representing 0.5% of the total nucleus-nucleus hadronic interaction cross section. A de-tailed description of centrality determination can be found in Ref. [6].
Jet reconstruction for this analysis relies on calorimeter information from the ECAL and HCAL. For the central region (|η| <1.74) from which jets are selected for this analysis, the HCAL cells
have widths of 0.087 in both η and φ. In the η–φ plane, and for |η| < 1.48, the HCAL cells
map on to 5×5 ECAL crystal arrays to form calorimeter towers projecting radially outwards from close to the nominal interaction point. Within each tower, the energy deposits in ECAL and HCAL cells are summed to define the calorimeter tower energies, subsequently used to provide the energies and directions of hadronic jets [13].
Accurate particle tracking is critical for measurements of charged-hadron yields. The CMS sil-icon tracker measures charged particles within the range|η| < 2.5. It consists of 1,440 silicon
pixel and 15,148 silicon strip detector modules. For nonisolated particles of 1 < pT < 10 GeV
and|η| <1.4, the track resolutions are typically 1.5% in pT and 25–90 (45–150) µm in the
trans-verse (longitudinal) impact parameter [14]. Performance of the track reconstruction in pp and PbPb collisions will be discussed in Section 3.
A detailed description of the CMS detector, together with a definition of the coordinate system used and the relevant kinematic variables, can be found in [15].
3
Jet and track reconstruction
For both pp and PbPb collisions, jet reconstruction in CMS is performed with the anti-kT
algo-rithm, as implemented in the FastJet framework [16, 17], using a distance parameter R = 0.3. Jets are reconstructed offline (i.e. after raw data is recorded) based on energy deposits in the CMS calorimeters. Raw jet energies are obtained from the sum of the tower energies and raw jet momenta from the vectorial sum of the tower momenta, and are corrected to establish a relative uniform response of the calorimeter in η and a calibrated absolute response in pT. For
PbPb collisions, the CMS algorithm “HF/Voronoi” is used to estimate and subtract the heavy-ion underlying event based on informatheavy-ion from HF energy measurements as well as Voronoi
decomposition of particle flow [9, 18]. For pp collisions, the contribution from the underlying event is negligible and no underlying event subtraction is employed.
Monte Carlo (MC) event generators have been used for evaluation of the jet and track recon-struction performance. Jet events are generated by the PYTHIA MC generator [19] (version 6.423, tune Z2 [20]). Simulated events are further propagated through the CMS detector using the GEANT4 package [21] to simulate the detector response. In order to account for the influ-ence of the underlying PbPb event, thePYTHIAevents are embedded into fully simulated PbPb events, generated byHYDJET[22] (version 1.8) that is tuned to reproduce the total particle mul-tiplicities, charged-hadron spectra, and elliptic flow at all centralities. The embedding is done by mixing the simulated signal information fromPYTHIAandHYDJET, hereafter referred to as PYTHIA+HYDJET. These events are then propagated through the same jet and track reconstruc-tion and analysis procedures as pp and PbPb data.
The jet energy scale (JES) is established for pp using PYTHIA events and for PbPb using PYTHIA+HYDJET events in classes of event centrality. The accuracy of the reconstruction and correction procedure is tested as a function of jet pT and η, by comparing a sample of
recon-structed and corrected jets to the jets originally simulated in that sample. To account for the dependence of the JES on the fragmentation of jets, an additional correction is applied as a function of reconstructed jet pT and as a function of the number of tracks with pT > 2 GeV
within a radius∆r < 0.3 around the jet axis. This correction is derived separately for pp and PbPb data, as described in Ref. [9].
For studies of pp data and PYTHIA simulation, tracks are reconstructed using the same it-erative method [14] as in the previous CMS analyses of pp collisions. For PbPb data and PYTHIA+HYDJET simulation, a dedicated heavy-ion iterative track reconstruction method [11, 23] is employed. Tracking efficiency for charged particles in pp collisions ranges from approx-imately 80% at pT ≈ 0.5 GeV to 90% or better at pT ≈ 10 GeV and higher. Track reconstruction
is more difficult in the heavy-ion environment due to the high track multiplicity, and track-ing efficiency for PbPb collisions ranges from approximately 30% at 0.5 GeV to about 70% at 10 GeV. Detailed studies of tracking efficiency and of tracking efficiency corrections (derived as a function of centrality, ptrkT , η, φ, and local charged particle density) can be found in Ref. [9].
4
Event selection
The events for this analysis are selected using the CMS high-level trigger (HLT), with an in-clusive single-jet trigger with a threshold of pT > 80 GeV [24]. This trigger is fully efficient
in both PbPb and pp data for events containing offline reconstructed jets with pT > 120 GeV.
In order to suppress noncollision-related noise due to sources such as cosmic rays and beam backgrounds, the events used in this analysis are also required to satisfy offline selection cri-teria as documented in Refs. [6, 25]. These include restricting PbPb events to those containing a reconstructed vertex with at least two tracks and a z position within 15 cm of the detector center, and in which at least 3 GeV energy is deposited in at least three HF calorimeter towers on each side of the interaction point.
A dijet sample is selected using criteria matched to those of previous CMS analyses measuring dijet energy balance and correlated yields to high-pT jets [5, 9, 12]. In this selection, events are
first required to contain a leading calorimeter jet with pT,1 > 120 GeV in the range of|ηjet| <2,
and a subleading jet of pT,2 > 50 GeV, also in |ηjet| < 2. Once the leading and subleading
jets in the event have been identified, a tighter |ηjet| selection is applied to ensure stable jet
events in which both leading and subleading jets fall within|ηjet| <1.6 are included in the final
selected data sample. The azimuthal angle between the leading and subleading jets is required to be at least 5π/6. No explicit requirement is made either on the presence or absence of a third jet in the event. This jet sample is further divided based on the asymmetry between the leading and subleading jets, AJ= (pT,1−pT,2)/(pT,1+pT,2). Two asymmetry classes are considered: the
more balanced part (defined by AJ < 0.22) of the total dijet sample, and the more unbalanced
part (defined by AJ > 0.22). The dividing value AJ = 0.22 is chosen for consistency with
previous CMS analyses [5, 9]. In this analysis, 52% of PbPb events are balanced, while 67% of pp events are balanced. For the PbPb data, the centrality of the collisions is also considered and results are compared for central events (with centrality 0–30%) versus peripheral events (with centrality 50-100%).
5
Analysis procedure
Dijet events in this analysis are studied differentially in collision centrality, with the following bins: 0–30% (most central), 30–50% (not shown), and 50–100% (most peripheral). This analysis follows the procedure established in Refs. [12, 26]: two-dimensional∆η–∆φ correlations with respect to the measured subleading and leading jet axes are constructed for charged-particle tracks in the event with ptrkT ≥0.5 GeV and|ηtrack| <2.4, in several ptrkT bins. These correlations
are weighted by ptrk
T on a per-track basis, and normalized by the number of jets in the sample.
This produces two-dimensional∆η–∆φ average per-jet distributions of ptrkT with respect to the leading and subleading jets. After the construction of the initial two-dimensional correlations described above, the remaining analysis procedure consists of the following steps, which will be discussed in detail below:
• A pair-acceptance correction, derived by the “mixed event” method [12, 26];
• The separation of correlations into jet-peak and long-range components;
• Corrections for jet reconstruction biases: a full simulation-based analysis is con-ducted to determine and subtract the correlated yield produced by jet selection bias.
5.1 Pair-acceptance correction
With jet acceptance of|ηjet| <1.6, many tracks within|∆η| <2.5 of a jet will fall outside of the
track acceptance of|ηtrack| <2.4, resulting in correlation geometry that falls with increasing∆η.
To correct for this pair-acceptance effect, a mixed-event distribution is constructed by correlat-ing jets from the jet-triggered event sample with tracks from a sample of minimum bias events, matched in vertex position (within 1 cm) and collision centrality (within 2.5%), following the technique used in Refs. [27–29]. In the following, Njets denotes the number of dijet events
se-lected as described in a given data sample. The per-jet associated yield, weighted per-track by ptrkT is defined as: 1 Njets d2∑ pT d∆η d∆φ = ME(0, 0) ME(∆η, ∆φ)S(∆η, ∆φ). (1)
The signal pair distribution, S(∆η, ∆φ), represents the ptrkT -weighted yield of jet-track pairs normalized by Njets from the same event:
S(∆η, ∆φ) = 1
Njets
d2ΣpsameT
The mixed-event pair distribution,
ME(∆η, ∆φ) = 1
Njets
d2Nmix
d∆η d∆φ , (3)
is constructed to account for pair-acceptance effects, with Nmixdenoting the number of mixed-event jet-track pairs.
Signal and mixed event correlations are both corrected for tracking efficiencies on a per-track basis, using the efficiency parametrization defined as a function of centrality, ptrkT , η, φ, and local charged-particle density, as in Ref. [9]. The ratio ME(0, 0)/ME(∆η, ∆φ)establishes the correction normalization, with ME(0, 0)representing the mixed-event associated yield for jet-track pairs going in approximately the same direction and thus having full pair acceptance.
5.2 Separation of correlations into jet-peak and long-range components
After the mixed-event correction, correlations to the leading and subleading jets show a Gaussian-like peak confined to the region |∆η| < 1.5, on top of a significant combinatorial and long-range-correlated background. To separate the long-range azimuthally-correlated and uncorrelated distributions under the peaks from jets, the “sideband” regions 1.5 < |∆η| <2.5 of both the leading and subleading jet acceptance-corrected correlations are projected into∆φ. Previous studies have found no∆η-dependence of the long-range underlying event distribu-tions in this|∆η| range [12, 30]. Figure 1 illustrates these long-range distributions in ∆φ for pp, most peripheral PbPb, and most central PbPb data for representative bins at low (upper panels) and high (lower panels) ptrkT of the tracks in unbalanced dijet events (with AJ > 0.22).
For illustration, the range|∆φ| < π/2 of the leading and subleading long-range ∆φ
distribu-tions are shown as a combined 2π distribution, with the subleading jet distribution shifted by
π to show the full underlying event correlation with respect to the leading jet direction. The
visible asymmetry in this long-range distribution in pp data is attributed to the presence of additional jets and other contributions that must, by momentum conservation, be present on the subleading side of the unbalanced dijet system.
To isolate the Gaussian-like leading and subleading jet peaks, this long-range distribution is propagated over the full range|∆η| <2.5 and subtracted in 2D from the mixed-event-corrected signal correlation. In addition, the leading side of the long-range distribution is subtracted from the subleading side (in the illustration shown, the distribution for |∆φ| < π/2 is subtracted
from the distribution for π/2<∆φ<3π/2) to obtain a measurement of subleading-to-leading asymmetry in the long-range correlated background. With this, the three contributions to the dijet hemisphere momentum balance have been identified: leading jet peak, subleading jet peak, and subleading-to-leading two-dimensional underlying event asymmetry.
5.3 Corrections and systematic uncertainties
Simulation-based corrections are applied to correlations to account for two biases in jet recon-struction: a bias toward selecting jets that are found on upward fluctuations in the background (relevant for PbPb only), and a bias toward selecting jets with harder fragmentation (affecting PbPb and pp similarly). For the former, to estimate and subtract the contribution to the excess yield due to background fluctuation bias in jet reconstruction, a similar procedure to that out-lined in previous CMS studies [10] is followed. Simulations are performed inPYTHIA+HYDJET samples with reconstructed jets, and correlations are constructed excluding particles generated with the embeddedPYTHIAhard-scattering process. A Gaussian fit to the excess is subtracted as a correction from the data results, and half its magnitude is assigned as the associated sys-tematic uncertainty.
φ ∆ -1 0 1 2 3 4 (GeV) φ∆ /d T p Σ d jets 1/N 5 10 15 20 pp reference | < 1.0 η ∆ Dijet peaks, | | < 2.5 η ∆ Long range, 1.5 < | < 2 GeV trk T 1 < p φ ∆ -1 0 1 2 3 4 (GeV) φ∆ /d T dp jets 1/N 5 10 15 20 25 PbPb cent. 50-100% < 2 GeV trk T 1 < p φ ∆ -1 0 1 2 3 4 (GeV) φ∆ /d T dp jets 1/N 75 80 85 90 PbPb cent. 0-30% CMS < 2 GeV trk T 1 < p φ ∆ -1 0 1 2 3 4 (GeV) φ∆ /d T p Σ d jets 1/N 10 20 30 40 50 pp reference < 8 GeV trk T 4 < p φ ∆ -1 0 1 2 3 4 (GeV) φ∆ /d T dp jets 1/N 10 20 30 40 50 PbPb cent. 50-100% < 8 GeV trk T 4 < p φ ∆ -1 0 1 2 3 4 (GeV) φ∆ /d T dp jets 1/N 10 20 30 40 50 PbPb cent. 0-30% < 8 GeV trk T 4 < p > 0.22 J A (2.76 TeV) -1 pp 5.3 pb PbPb 166 µb-1 (2.76 TeV) | < 1.6 jet η R = 0.3, | T anti-k /6 π > 5 1,2 φ ∆ > 50 GeV, T,2 > 120 GeV, p T,1 p
Figure 1: Jet-track correlation distributions for unbalanced dijet events (AJ > 0.22), projected
over|∆η| <1. and overlaid with a long-range distribution projected over 1.5< |∆η| <2.5. The region|∆φ| <π/2 is taken from the leading jet correlation, while the region π/2< ∆φ<3π/2
is taken from the subleading jet correlation. The top row shows the low ptrkT bin 1 < ptrkT <
2 GeV, while the bottom row shows the high ptrk
T bin 4< ptrkT <8 GeV. Statistical uncertainties
are shown with vertical bars.
The second bias is toward the selection of jets with fewer associated tracks in both pp and PbPb data for all ptrkT selections studied, due to the fact that jets with harder fragmentation are more likely to be successfully reconstructed than jets with softer fragmentation. Following the method used in Refs. [9, 12], corrections are derived for this jet fragmentation function (JFF) bias and for the related possible effect of ”jet swapping” between leading, subleading, and ad-ditional jets by comparing correlated per-trigger particle yields for all reconstructed jets versus all generated jets. This correction is derived for each jet selection in aPYTHIA-only simulation, and also in PYTHIA+HYDJET events, excluding HYDJET tracks from the correction determina-tion. The variation between the JFF and jet swapping correction derived fromPYTHIA embed-ded into HYDJETsimulation at different centralities is assigned as a systematic uncertainty in this correction. This uncertainty is less than 2% for all ptrkT selections, and converges to zero at high ptrkT .
Jet reconstruction-related sources of systematic uncertainty in this analysis include the two re-construction biases as discussed above, as well as a residual JES uncertainty that accounts for possible differences of calorimeter response in data and simulation. In simulation, for exam-ple, there is a difference in the JES between quark and gluon jets (about 2% at 120 GeV [9]), meaning that medium-induced changes in jet flavor could result in either over-correction or under-correction of jet energy, and a resulting bias in jet selection. To evaluate this residual JES uncertainty, we vary the leading jet selection threshold by 3% to account for possible dif-ferences in data versus simulated calorimeter response. The resulting maximum variations in total correlated particle yield are found to be within 3% in all cases, and we conservatively assign 3% to account for this systematic uncertainty source.
The tracking efficiency correction uncertainty is estimated from the ratio of corrected
recon-structed yields and generated yields in PYTHIA and PYTHIA+HYDJET simulated events, by
using generator-level charged particles as a reference. This uncertainty is found to be ∼ 2– 4% for PbPb and pp collisions, with the greater value corresponding to a higher multiplicity and lower momentum range of selected tracks. To account for possible track reconstruction differences in data and simulation, a residual uncertainty in track reconstruction efficiency and misidentification rate corrections is estimated to be 5% [9].
The uncertainty arising from pair acceptance effects is estimated by considering the sideband asymmetry after dividing by the mixed-event correlation. Each sideband region of the final background-subtracted∆η distribution (−2.5 < ∆η < −1.5 and 1.5< ∆η < 2.5) is separately fit with a constant. The greater of these two deviations from zero is assigned as systematic uncertainty, and is found to be within 5–9% for the lowest ptrkT bin. The uncertainty result-ing from the event decomposition is determined by evaluatresult-ing point-to-point variations in the side-band projections used to estimate long-range correlation contributions. The event decom-position uncertainty is found to be within 2–5% for 0–30% central PbPb data in the the lowest ptrkT bin where the background is most significant compared to the signal level, and decreases for less central collisions and for higher ptrkT tracks (ptrkT >2 GeV).
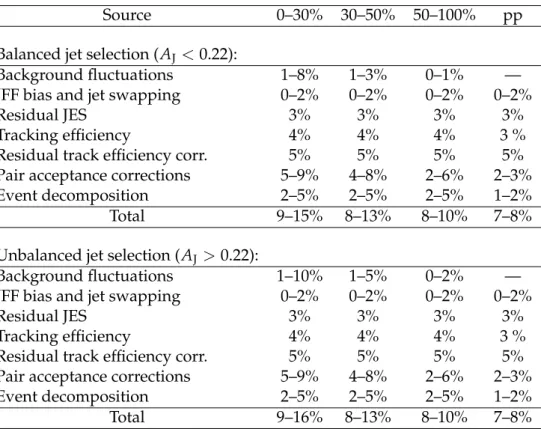
The systematic uncertainties from the sources discussed above are added in quadrature for the final result. Table 1 lists the upper limits on the estimated contributions from the individual sources described above.
Table 1: This table summarizes the systematic uncertainties in the measurement of the jet-track correlations in PbPb and pp collisions. Upper and lower limits are shown as a function of collision centrality. Upper values correspond to the uncertainties at lowest ptrkT .
Source 0–30% 30–50% 50–100% pp
Balanced jet selection (AJ <0.22):
Background fluctuations 1–8% 1–3% 0–1% —
JFF bias and jet swapping 0–2% 0–2% 0–2% 0–2%
Residual JES 3% 3% 3% 3%
Tracking efficiency 4% 4% 4% 3 %
Residual track efficiency corr. 5% 5% 5% 5%
Pair acceptance corrections 5–9% 4–8% 2–6% 2–3%
Event decomposition 2–5% 2–5% 2–5% 1–2%
Total 9–15% 8–13% 8–10% 7–8%
Unbalanced jet selection (AJ >0.22):
Background fluctuations 1–10% 1–5% 0–2% —
JFF bias and jet swapping 0–2% 0–2% 0–2% 0–2%
Residual JES 3% 3% 3% 3%
Tracking efficiency 4% 4% 4% 3 %
Residual track efficiency corr. 5% 5% 5% 5%
Pair acceptance corrections 5–9% 4–8% 2–6% 2–3%
Event decomposition 2–5% 2–5% 2–5% 1–2%
6
Results
In this analysis, two-dimensional ∆η–∆φ momentum distributions with respect to high-pT
leading and subleading jets are studied differentially in centrality and ptrkT . First, the jet mo-mentum density profile is measured as a function of∆r=p(∆η)2+ (∆φ)2for all dijet events,
comparing PbPb to pp jet shapes up to ∆r = 1. Next, the sample is divided into balanced (AJ < 0.22) and unbalanced (AJ > 0.22) dijet events, and the overall subleading-to-leading
hemisphere momentum balance is evaluated by subtracting the distribution of ptrkT about the leading jet from the distribution of ptrk
T about the subleading jet . This overall hemisphere
mo-mentum balance is then further decomposed into contributions from the leading and sublead-ing jet peaks and from the underlysublead-ing event-wide long-range asymmetry. The jet peak shapes are quite similar in∆η and ∆φ, as reported in Ref. [12], but the long-range “ridge-like” distri-bution is independent of∆η within the fiducial acceptance and uncertainties, while showing a clear∆φ dependence, as is visible in Fig. 1. To avoid convolving these two different trends, we present the results that follow as a function of∆φ, including the overall subleading-to-leading hemisphere momentum balance and respective contributions from the leading and subleading peaks and underlying long-range asymmetry as a function of∆φ. Finally, we summarize our findings by presenting the total momentum in each ptrk
T bin, integrated over each hemisphere.
6.1 Measurement of radial jet momentum density profile
After subtraction of the long-range background, ptrkT correlations in∆η and ∆φ may be used to obtain measurements of jet shape as a function of∆r by direct integration. Jet shape ρ(∆r)is defined as: ρ
(
∆r) =
1 δr 1 Njets Σjets Σtracks∈(ra,rb)p trk T pjetsT . (4)The jet shape ρ(∆r)is extracted by integrating 2D jet-peak momentum distributions in annuli with radial width δr = 0.05, where each has an inner radius of ra = r−δr/2 and outer radius
of rb = r+δr/2. A previous CMS study measured the jet shape ρ(∆r)within the jet cone
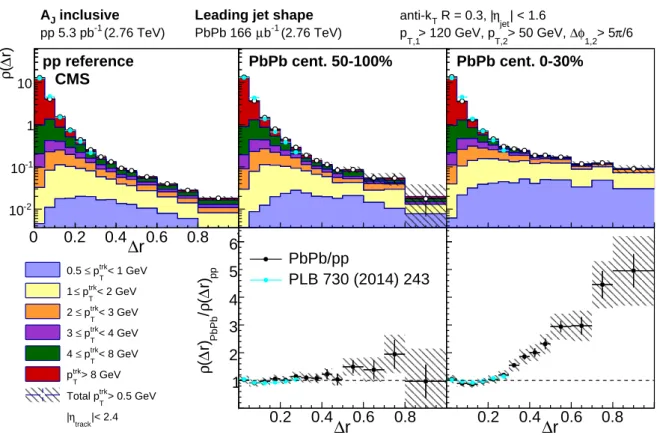
radius∆r= 0.3 [11]; for comparison with this previous result, distributions are normalized to integrate to unity within the radius∆r < 0.3. In Fig. 2, the leading jet shape measured with this correlation technique is compared to the published CMS measurement [11]. The new jet shape measurement is performed differentially in ptrkT , in bins ranging from 0.5< ptrk
T <1 GeV
to ptrkT > 8 GeV. With the advantages provided by the correlation technique, the radial jet momentum density profile measurements are also extended in this analysis to ∆r = 1. The ∆r = 1 limit is driven by the pp data, which has no correlated yields within our sample at larger∆r. The leading jet shape is found to be very similar to that in the previous measurement for an inclusive jet selection of all jets with pT > 100 GeV, despite small differences in the jet
selection.
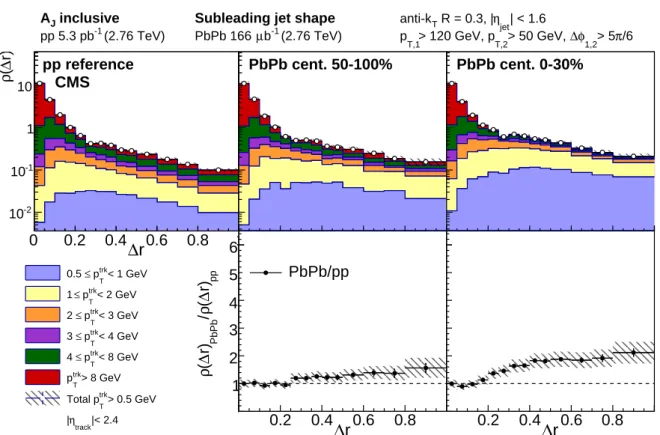
A new measurement of subleading jet shape is presented in Fig. 3. Significant jet shape mod-ifications are evident in central PbPb events for both leading and subleading jets with respect to the pp reference measurement, while in peripheral PbPb events the jet shapes are similar to the pp reference. Broadening of the jet structure is an expected consequence of jet quenching in theoretical models [31]. Here it is important to note that the broadening in central PbPb collisions is relative to the jets of the same type (leading or subleading) in pp collisions. The subleading jets are of lower pTby selection in both PbPb and pp, and significantly broader than
leading jets in pp data. Thus, although subleading jets in central PbPb collisions are softer and broader than leading jets in these collisions, the relative jet shape modification (expressed via a
ratio to pp data) is greater for leading jets since these are compared to the narrower pp leading jets. 0 0.2 0.4 0.6 0.8 1 r) ∆ ( ρ -2 10 -1 10 1 10 pp reference CMS < 1 GeV trk T p ≤ 0.5 < 2 GeV trk T p ≤ 1 < 3 GeV trk T p ≤ 2 < 4 GeV trk T p ≤ 3 < 8 GeV trk T p ≤ 4 > 8 GeV trk T p > 0.5 GeV trk T Total p |< 2.4 track η | pp r) ∆ ( ρ / PbPb r) ∆ ( ρ 0 1 2 3 4 5 6 r ∆ 0 0.2 0.4 0.6 0.8 10 0.2 0.4 0.6 0.8 1 PbPb cent. 50-100% r ∆ 0 0.2 0.4 0.6 0.8 1 PbPb/pp PLB 730 (2014) 243 0 0.2 0.4 0.6 0.8 1 PbPb cent. 0-30% r ∆ 0 0.2 0.4 0.6 0.8 1 inclusive J
A Leading jet shape
(2.76 TeV) -1 pp 5.3 pb PbPb 166 µb-1 (2.76 TeV) | < 1.6 jet η R = 0.3, | T anti-k /6 π > 5 1,2 φ ∆ > 50 GeV, T,2 > 120 GeV, p T,1 p
Figure 2: Top row: leading jet shape ρ(∆r) for the pp reference, and peripheral and central PbPb data, shown for all tracks with pT > 0.5 GeV and decomposed by ptrkT (with ptrkT ranges
denoted by different color shading). Shapes are normalized to unity over the region∆r < 0.3 for comparison with the published reference shown (Ref. [11]). Bottom row: leading jet shape ratio ρ(∆r)PbPb/ρ(∆r)pp, again with the published reference. Statistical uncertainties are shown with vertical bars, and systematic uncertainties are shown with shaded boxes.
6.2 Azimuthal distribution of charged-particle transverse momentum
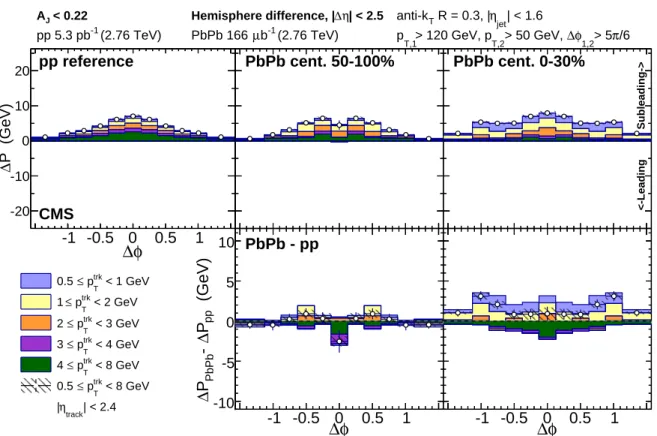
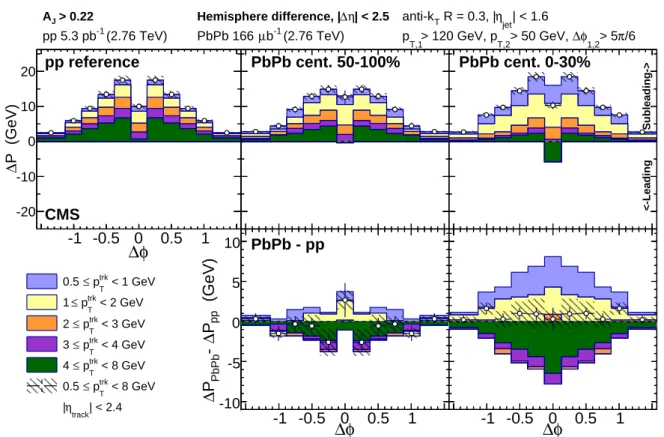
To investigate in detail how the modification of the jet peaks contributes to the overall re-distribution of ptrkT flow reported in [9], we measure the transverse momentum balance in the event via ∆η–∆φ ptrkT correlations to subleading and leading jets. First, we present the hemisphere-wide balancing distribution of ptrkT around the subleading versus the leading jets in Figs. 4 and 5, for balanced and unbalanced dijet events, respectively. These figures show the per-event azimuthal distribution of ptrkT about the leading or subleading jet axis, denoted P = 1/NevtdΣpT/d∆φ, with the subleading-to-leading hemisphere difference of this
distri-bution denoted ∆P. For display, all distributions are symmetrized in ∆φ. For both balanced and unbalanced dijet events, a broad excess of soft particles is evident in the subleading versus leading hemisphere in central PbPb collisions relative to the pp reference data. This reflects the greater quenching of the subleading jet. In the unbalanced selection, as required by the momentum conservation, the signal is enhanced in both pp and PbPb data: in pp data a large excess of particles with ptrkT >3 GeV is present on the subleading side. This excess compensates for the smaller contribution of the highest pTparticles in the jet itself. In peripheral PbPb data
the distribution is quite similar to the pp reference, while in central PbPb data this balancing distribution consists mostly of soft particles with ptrk
0 0.2 0.4 0.6 0.8 1 r) ∆ ( ρ -2 10 -1 10 1 10 pp reference CMS < 1 GeV trk T p ≤ 0.5 < 2 GeV trk T p ≤ 1 < 3 GeV trk T p ≤ 2 < 4 GeV trk T p ≤ 3 < 8 GeV trk T p ≤ 4 > 8 GeV trk T p > 0.5 GeV trk T Total p |< 2.4 track η | pp r) ∆ ( ρ / PbPb r) ∆ ( ρ 0 1 2 3 4 5 6 r ∆ 0 0.2 0.4 0.6 0.8 10 0.2 0.4 0.6 0.8 1 PbPb cent. 50-100% r ∆ 0 0.2 0.4 0.6 0.8 1 PbPb/pp 0 0.2 0.4 0.6 0.8 1 PbPb cent. 0-30% r ∆ 0 0.2 0.4 0.6 0.8 1 inclusive J
A Subleading jet shape
(2.76 TeV) -1 pp 5.3 pb PbPb 166 µb-1 (2.76 TeV) | < 1.6 jet η R = 0.3, | T anti-k /6 π > 5 1,2 φ ∆ > 50 GeV, T,2 > 120 GeV, p T,1 p
Figure 3: Top row: subleading jet shape ρ(∆r) for pp reference and peripheral and central PbPb data, shown for all tracks with pT > 0.5 GeV and decomposed by ptrkT (with ptrkT ranges
denoted by different color shading), normalized to unity over the region∆r<0.3. Bottom row: subleading jet shape ratio ρ(∆r)PbPb/ρ(∆r)pp. Statistical uncertainties are shown with vertical
bars, and systematic uncertainties are shown with shaded boxes.
the previous CMS study [9]. To demonstrate these medium modifications more clearly, the dif-ference in yield between PbPb and pp collisions is shown in the bottom panels of Figs. 4 and 5. For presentation, tracks with ptrkT >8 GeV are not included in these figures, so that it is possible to zoom in on the low-ptrkT structures and modifications.
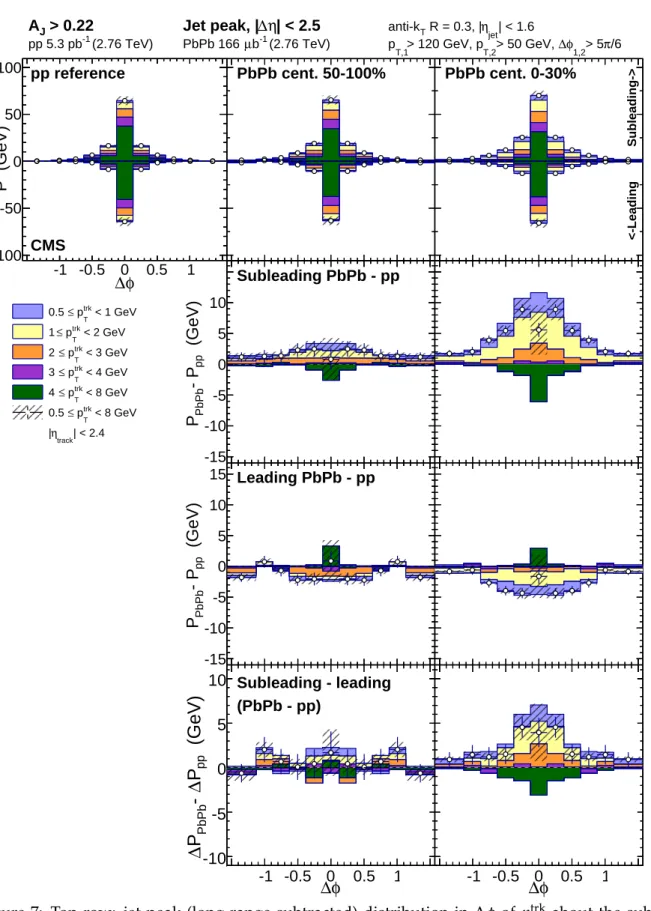
To elucidate the redistribution of ptrkT within the QGP, the distributions are separated into three components as stated above: the two Gaussian-like peaks about the leading and subleading jet axes, and a third component accounting for overall subleading-to-leading hemisphere asym-metry of the long-range side-band distributions (measured in the region 1.5 < |∆η| < 2.5). In Figs. 6 and 7, the jet peak components are shown for balanced and unbalanced jets, respec-tively, presenting subleading results as positive and leading results as negative (in line with the hemisphere difference measurements in Figs. 4 and 5). Jet peak distributions after decompo-sition are projected over the full range|∆η| < 2.5, again for consistency with the hemisphere difference measurements. The top row of each panel first shows the overall distribution of momentum carried by particles with ptrkT < 8 GeV associated with the jet peak. The middle two panels then assess modifications to the subleading and leading jets for each ptrkT bin. Here, again, there is evidence of quenching of both the subleading and leading jets in central PbPb collisions relative to the pp reference data. There is an excess of low-pT particles correlated
with the leading and subleading jet axes in both the balanced and unbalanced dijet selections, in agreement with results presented in the CMS study [12]. In unbalanced dijet events, this enhancement of soft particles turns into a depletion at higher ptrkT , and is greater on the sub-leading than the sub-leading side. The pp subsub-leading jet peak is broader than the pp sub-leading jet
φ ∆ -1.5 -1 -0.5 0 0.5 1 1.5 P (GeV) ∆ -20 -10 0 10 20 pp reference CMS < 1 GeV trk T p ≤ 0.5 < 2 GeV trk T p ≤ 1 < 3 GeV trk T p ≤ 2 < 4 GeV trk T p ≤ 3 < 8 GeV trk T p ≤ 4 < 8 GeV trk T p ≤ 0.5 | < 2.4 track η | φ ∆ -1.5 -1 -0.5 0 0.5 1 1.5 (GeV) pp P ∆ - PbPb P ∆-10 -5 0 5 10 -1.5 -1 -0.5 0 0.5 1 1.5 PbPb cent. 50-100% φ ∆ -1.5 -1 -0.5 0 0.5 1 1.5 PbPb - pp -1.5 -1 -0.5 0 0.5 1 1.5 PbPb cent. 0-30% <-Leading Subleading-> φ ∆ -1.5 -1 -0.5 0 0.5 1 1.5 < 0.22 J A Hemisphere difference, |∆η| < 2.5 (2.76 TeV) -1 pp 5.3 pb PbPb 166 µb-1 (2.76 TeV) | < 1.6 jet η R = 0.3, | T anti-k /6 π > 5 1,2 φ ∆ > 50 GeV, T,2 > 120 GeV, p T,1 p
Figure 4: Top row: difference of the total ptrkT distributions between subleading and leading jet hemispheres, projected on∆φ, for balanced dijet events with AJ <0.22 shown differentially by
ptrkT for pp reference, peripheral PbPb, and central PbPb data. Bottom row: PbPb–pp difference in these∆φ momentum distributions. Statistical uncertainties are shown with vertical bars, and systematic uncertainties are shown with shaded boxes.
peak and, while both subleading and leading jet peaks are broader in central PbPb than pp data, the PbPb–pp excess is wider on the leading than on the subleading side. To assess the jet peak contributions to the overall hemisphere momentum balance, the double-differential (PbPb–pp, subleading–leading) result is presented in the bottom panel. Here it is evident that the low-ptrk
T excess in central PbPb collisions is greater on the subleading than the leading side
of the dijet system, but the larger subleading-to-leading excess only accounts for a portion of the total momentum redistribution in unbalanced dijet events. It is also clear that the high-ptrkT large-angle depletion observed in the overall hemisphere momentum balance distribution is not produced by the Gaussian-like jet peaks.
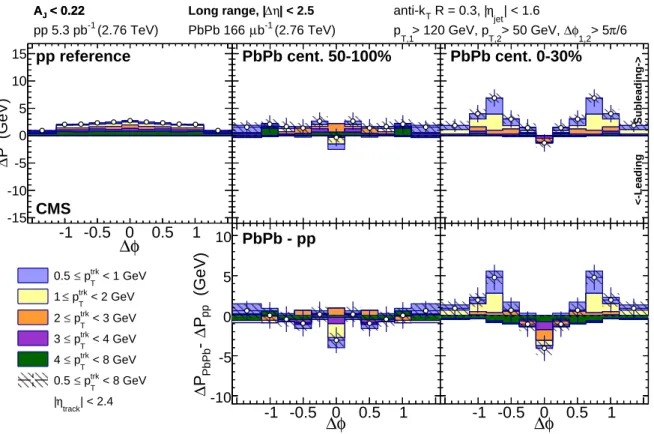
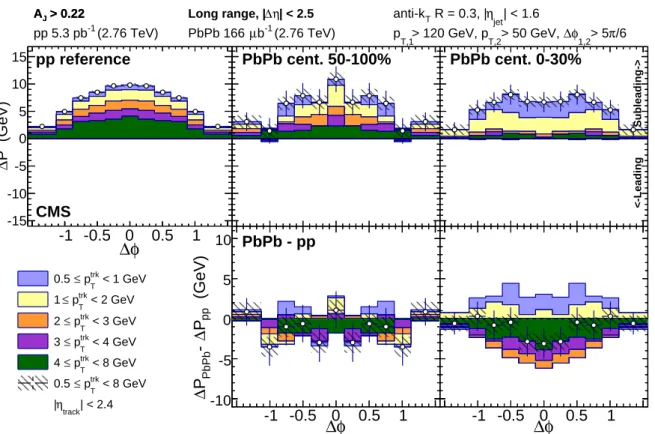
To uncover the missing part of the total transverse momentum balance, these jet-related studies are complemented by an analysis of the long-range subleading-to-leading hemisphere asym-metry, presented in Figs. 8 and 9 for balanced and unbalanced jets, respectively. The long-range correlated background in balanced dijet events is approximately symmetric in pp and periph-eral PbPb data, while in central PbPb data there is a small excess of low-pTparticles. In
unbal-anced dijet events, however, there is already significant asymmetry in the pp reference data, with a large correlated excess of particles in all ptrkT classes less than 8 GeV on the subleading relative to the leading side of the underlying event. This asymmetry reflects the presence of other hard-scattering products in the subleading hemisphere of dijet events (e.g. additional jets), as required by the momentum conservation for asymmetric dijet events in pp collisions. In the presence of the strongly interacting medium, however, this underlying event asymme-try in asymmetric dijet events changes notably. In peripheral PbPb collisions, an onset of some
φ ∆ -1.5 -1 -0.5 0 0.5 1 1.5 P (GeV) ∆ -20 -10 0 10 20 pp reference CMS < 1 GeV trk T p ≤ 0.5 < 2 GeV trk T p ≤ 1 < 3 GeV trk T p ≤ 2 < 4 GeV trk T p ≤ 3 < 8 GeV trk T p ≤ 4 < 8 GeV trk T p ≤ 0.5 | < 2.4 track η | φ ∆ -1.5 -1 -0.5 0 0.5 1 1.5 (GeV) pp P ∆ - PbPb P ∆-10 -5 0 5 10 -1.5 -1 -0.5 0 0.5 1 1.5 PbPb cent. 50-100% φ ∆ -1.5 -1 -0.5 0 0.5 1 1.5 PbPb - pp -1.5 -1 -0.5 0 0.5 1 1.5 PbPb cent. 0-30% <-Leading Subleading-> φ ∆ -1.5 -1 -0.5 0 0.5 1 1.5 > 0.22 J A Hemisphere difference, |∆η| < 2.5 (2.76 TeV) -1 pp 5.3 pb PbPb 166 µb-1 (2.76 TeV) | < 1.6 jet η R = 0.3, | T anti-k /6 π > 5 1,2 φ ∆ > 50 GeV, T,2 > 120 GeV, p T,1 p
Figure 5: Top row: difference of the total ptrkT distributions between subleading and leading jet hemispheres, projected on∆φ, for unbalanced dijet events with AJ >0.22, shown differentially
by ptrkT for the pp reference data, peripheral PbPb, and central PbPb data. Bottom row: PbPb– pp difference in these ∆φ momentum distributions. Statistical uncertainties are shown with vertical bars, and systematic uncertainties are shown with shaded boxes.
depletion of momentum carried by high-pT particles can be seen, and in central PbPb data,
subleading-to-leading underlying event excesses with ptrkT > 2 GeV nearly vanish. The signif-icance of the contribution of this long-range asymmetry to the total hemisphere imbalance is further assessed by the double difference (PbPb–pp, subleading–leading), which is shown on the bottom panel. The absence of a high-ptrk
T component in the long-range part of the
correla-tion suggests that events containing addicorrela-tional jets constitute a smaller fraccorrela-tion of unbalanced dijet events in PbPb than pp data. A likely explanation for this effect is that while momentum conservation requires the presence of additional jets in unbalanced pp dijet events, in PbPb data the sample of unbalanced dijet events also includes events in which the dijet asymmetry is due to the greater quenching of the subleading jet.
φ ∆ -1.5 -1 -0.5 0 0.5 1 1.5 P (GeV) -100 -50 0 50 100 pp reference CMS < 1 GeV trk T p ≤ 0.5 < 2 GeV trk T p ≤ 1 < 3 GeV trk T p ≤ 2 < 4 GeV trk T p ≤ 3 < 8 GeV trk T p ≤ 4 < 8 GeV trk T p ≤ 0.5 | < 2.4 track η | (GeV) pp - P PbPb P -15 -10 -5 0 5 10 15 φ ∆ -1.5 -1 -0.5 0 0.5 1 1.5 (GeV) pp - P PbPb P -15 -10 -5 0 5 10 15
(GeV)
ppP
∆
-
PbPbP
∆
-10 -5 0 5 10 -1.5 -1 -0.5 0 0.5 1 1.5 PbPb cent. 50-100% -1.5 -1 -0.5 0 0.5 1 1.5 Subleading PbPb - pp -1.5 -1 -0.5 0 0.5 1 1.5 Leading PbPb - pp φ ∆ -1.5 -1 -0.5 0 0.5 1 1.5 Subleading - leading (PbPb - pp) -1.5 -1 -0.5 0 0.5 1 1.5 PbPb cent. 0-30% <-Leading Subleading-> -1.5 -1 -0.5 0 0.5 1 1.5 -1.5 -1 -0.5 0 0.5 1 1.5 φ ∆ -1.5 -1 -0.5 0 0.5 1 1.5 < 0.22 J A Jet peak, |∆η| < 2.5 (2.76 TeV) -1 pp 5.3 pb PbPb 166 µb-1 (2.76 TeV) | < 1.6 jet η R = 0.3, | T anti-k /6 π > 5 1,2 φ ∆ > 50 GeV, T,2 > 120 GeV, p T,1 pFigure 6: Top row: jet-peak (long-range subtracted) distribution in ∆φ of ptrkT about the sub-leading (plotted positive) and sub-leading (plotted negative) jets for balanced dijet events with AJ < 0.22. Middle rows: PbPb–pp momentum distribution differences for subleading and
leading jets. Bottom row: PbPb–pp, subleading–leading double difference in these ∆φ mo-mentum distributions. Statistical uncertainties are shown with vertical bars, and systematic uncertainties are shown with shaded boxes.
φ ∆ -1.5 -1 -0.5 0 0.5 1 1.5 P (GeV) -100 -50 0 50 100 pp reference CMS < 1 GeV trk T p ≤ 0.5 < 2 GeV trk T p ≤ 1 < 3 GeV trk T p ≤ 2 < 4 GeV trk T p ≤ 3 < 8 GeV trk T p ≤ 4 < 8 GeV trk T p ≤ 0.5 | < 2.4 track η | (GeV) pp - P PbPb P -15 -10 -5 0 5 10 15 φ ∆ -1.5 -1 -0.5 0 0.5 1 1.5 (GeV) pp - P PbPb P -15 -10 -5 0 5 10 15
(GeV)
ppP
∆
-
PbPbP
∆
-10 -5 0 5 10 -1.5 -1 -0.5 0 0.5 1 1.5 PbPb cent. 50-100% -1.5 -1 -0.5 0 0.5 1 1.5 Subleading PbPb - pp -1.5 -1 -0.5 0 0.5 1 1.5 Leading PbPb - pp φ ∆ -1.5 -1 -0.5 0 0.5 1 1.5 Subleading - leading (PbPb - pp) -1.5 -1 -0.5 0 0.5 1 1.5 PbPb cent. 0-30% <-Leading Subleading-> -1.5 -1 -0.5 0 0.5 1 1.5 -1.5 -1 -0.5 0 0.5 1 1.5 φ ∆ -1.5 -1 -0.5 0 0.5 1 1.5 > 0.22 J A Jet peak, |∆η| < 2.5 (2.76 TeV) -1 pp 5.3 pb PbPb 166 µb-1 (2.76 TeV) | < 1.6 jet η R = 0.3, | T anti-k /6 π > 5 1,2 φ ∆ > 50 GeV, T,2 > 120 GeV, p T,1 pFigure 7: Top row: jet-peak (long-range subtracted) distribution in ∆φ of ptrkT about the sub-leading (plotted positive) and sub-leading (plotted negative) jets for unbalanced dijet events with AJ > 0.22. Middle rows: PbPb–pp momentum distribution differences for subleading and
leading jets. Bottom row: PbPb–pp, subleading–leading double difference in these ∆φ mo-mentum distributions. Statistical uncertainties are shown with vertical bars, and systematic uncertainties are shown with shaded boxes.
φ ∆ -1.5 -1 -0.5 0 0.5 1 1.5 P (GeV) ∆ -15 -10 -5 0 5 10 15 pp reference CMS < 1 GeV trk T p ≤ 0.5 < 2 GeV trk T p ≤ 1 < 3 GeV trk T p ≤ 2 < 4 GeV trk T p ≤ 3 < 8 GeV trk T p ≤ 4 < 8 GeV trk T p ≤ 0.5 | < 2.4 track η | φ ∆ -1.5 -1 -0.5 0 0.5 1 1.5 (GeV) pp P ∆ - PbPb P ∆-10 -5 0 5 10 -1.5 -1 -0.5 0 0.5 1 1.5 PbPb cent. 50-100% φ ∆ -1.5 -1 -0.5 0 0.5 1 1.5 PbPb - pp -1.5 -1 -0.5 0 0.5 1 1.5 PbPb cent. 0-30% <-Leading Subleading-> φ ∆ -1.5 -1 -0.5 0 0.5 1 1.5 < 0.22 J A < 0.22J A Long range, |∆η| < 2.5 (2.76 TeV) -1 pp 5.3 pb PbPb 166 µb-1 (2.76 TeV) | < 1.6 jet η R = 0.3, | T anti-k /6 π > 5 1,2 φ ∆ > 50 GeV, T,2 > 120 GeV, p T,1 p
Figure 8: Top row: long-range distribution in ∆φ of excess ptrkT in the subleading relative to leading sides for balanced dijet events with AJ < 0.22. Bottom row: PbPb–pp difference in
these∆φ long-range momentum distributions. Statistical uncertainties are shown with vertical bars, and systematic uncertainties are shown with shaded boxes.
φ ∆ -1.5 -1 -0.5 0 0.5 1 1.5 P (GeV) ∆ -15 -10 -5 0 5 10 15 pp reference CMS < 1 GeV trk T p ≤ 0.5 < 2 GeV trk T p ≤ 1 < 3 GeV trk T p ≤ 2 < 4 GeV trk T p ≤ 3 < 8 GeV trk T p ≤ 4 < 8 GeV trk T p ≤ 0.5 | < 2.4 track η | φ ∆ -1.5 -1 -0.5 0 0.5 1 1.5 (GeV) pp P ∆ - PbPb P ∆-10 -5 0 5 10 -1.5 -1 -0.5 0 0.5 1 1.5 PbPb cent. 50-100% φ ∆ -1.5 -1 -0.5 0 0.5 1 1.5 PbPb - pp -1.5 -1 -0.5 0 0.5 1 1.5 PbPb cent. 0-30% <-Leading Subleading-> φ ∆ -1.5 -1 -0.5 0 0.5 1 1.5 > 0.22 J A > 0.22J A Long range, |∆η| < 2.5 (2.76 TeV) -1 pp 5.3 pb PbPb 166 µb-1 (2.76 TeV) | < 1.6 jet η R = 0.3, | T anti-k /6 π > 5 1,2 φ ∆ > 50 GeV, T,2 > 120 GeV, p T,1 p
Figure 9: Top row: long-range distribution in ∆φ of excess ptrkT in the subleading relative to leading sides for unbalanced dijet events with AJ > 0.22. Bottom row: PbPb–pp difference in
these∆φ long-range momentum distributions. Statistical uncertainties are shown with vertical bars, and systematic uncertainties are shown with shaded boxes.
6.3 Integrated hemisphere momentum balance
To summarize all contributions to the overall ptrkT flow in the dijet events, we first present the hemisphere integralΣ∆P (where ∆P represents the subleading-to-leading difference in the ∆φ distribution of ptrkT in the event) for this long-range asymmetry, measured in|∆φ| < π/2 and |∆η| < 2.5, in Fig. 10. For balanced dijet events, the PbPb and pp integrals follow similar ptrkT dependences. For unbalanced dijet events, the overall asymmetry rises with ptrkT in the pp ref-erence data, but falls with ptrk
T in central PbPb data, indicating the presence of different sources
for the long-range momentum correlations. Finally, a summary of hemisphere-integrated ex-cess (PbPb–pp) yields from all assessed sources for balanced and unbalanced dijet events is shown in Figs. 11 and 12. The top panels of Fig. 11 present total central PbPb–pp differences in ptrkT associated with the subleading (plotted positive) and leading (plotted negative) jets. The leading and subleading jet peak modifications offset each other, so the total jet-peak-related modification, constructed from these two distributions, is also presented. The total jet peak modifications in central PbPb collisions are not significantly different in unbalanced versus bal-anced dijet events. The bottom panels of Fig. 11 present these jet-peak modifications together with the long-range modifications evident in Fig. 10 to show the decomposed hemisphere-wide differences in associated pTin each track pT range. Unlike the jet peak contributions, the
long-range PbPb versus pp modifications are greater than their uncertainties between balanced and unbalanced dijet events. Here the depletion of high-pT tracks in unbalanced PbPb versus pp
dijet events corresponds to the reduced contribution from additional jets (which are promi-nently evident in the long-range distribution for pp unbalanced dijet events) in central PbPb unbalanced dijet events. Figure 12 presents the same hemisphere-integrated PbPb–pp excess for peripheral collisions for comparison to the central results shown in Fig. 11. Some possible small modifications are already evident in this 50–100% centrality range, but these differences between peripheral PbPb and pp results are in most cases smaller than systematic uncertainties.
(GeV) trk T p 1 2 3 4 5 6 7 8 P (GeV) ∆Σ -2 0 2 4 6 8 10 12 14 < 0.22 J A PbPb 50-100% PbPb 0-30% pp reference (GeV) trk T p 1 2 3 4 5 6 7 8 > 0.22 J A CMS |<2.5 η ∆ Long range asymmetry |
(2.76 TeV) -1 pp 5.3 pb (2.76 TeV) -1 b µ PbPb 166 | < 1.6 jet η R = 0.3, | T anti-k /6 π > 5 1,2 φ ∆ > 50 GeV, T,2 > 120 GeV, p T,1 p
Figure 10: Integrated pTin the long-range∆φ-correlated distribution as a function of track-ptrkT
integrated over|∆φ| <π/2 and|∆η| <2.5 for pp reference, peripheral PbPb and central PbPb
data for balanced compared to unbalanced dijet events. Statistical uncertainties are shown with vertical bars, and systematic uncertainties are shown with shaded boxes.
(GeV) pp P Σ - PbPb P Σ -10 -5 0 5 10 15 Subleading jet Leading jet
Subleading and leading jets < 0.22 J A
(GeV)
trk Tp
1
2
3
4
5
6
7
8
(GeV) pp P ∆Σ - PbPb P ∆Σ -10 -5 0 5 1015 Subleading and leading jets
Long range Total > 0.22 J A CMS 0-30% central PbPb - pp
(GeV)
trk Tp
1
2
3
4
5
6
7
8
(2.76 TeV) -1 pp 5.3 pb (2.76 TeV) -1 b µ PbPb 166 | < 1.6 jet η R = 0.3, | T anti-k /6 π > 5 1,2 φ ∆ > 50 GeV, T,2 > 120 GeV, p T,1 pFigure 11: Modifications of jet-track correlated ptrkT in central PbPb collisions with respect to the pp reference data, integrated over|∆φ| < π/2 and|∆η| < 2.5. Top row: subleading and
leading jet peaks PbPb–pp. Bottom row: relative contributions from jet peaks and long-range asymmetry to the double difference (PbPb–pp, subleading–leading) in total hemisphere ptrk
T .
Statistical uncertainties are shown with vertical bars, and systematic uncertainties are shown with shaded boxes.
(GeV) pp P Σ - PbPb P Σ -10 -5 0 5 10 15 Subleading jet Leading jet
Subleading and leading jets < 0.22 J A
(GeV)
trk Tp
1
2
3
4
5
6
7
8
(GeV) pp P ∆Σ - PbPb P ∆Σ -10 -5 0 5 1015 Subleading and leading jets
Long range Total > 0.22 J A CMS 50-100% peripheral PbPb - pp
(GeV)
trk Tp
1
2
3
4
5
6
7
8
(2.76 TeV) -1 pp 5.3 pb (2.76 TeV) -1 b µ PbPb 166 | < 1.6 jet η R = 0.3, | T anti-k /6 π > 5 1,2 φ ∆ > 50 GeV, T,2 > 120 GeV, p T,1 p (2.76 TeV) -1 pp 5.3 pb (2.76 TeV) -1 b µ PbPb 166 | < 1.6 jet η R = 0.3, | T anti-k /6 π > 5 1,2 φ ∆ > 50 GeV, T,2 > 120 GeV, p T,1 pFigure 12: Modifications of jet-track correlated ptrkT in peripheral PbPb collisions with respect to the pp reference data, integrated over |∆φ| < π/2 and |∆η| < 2.5. Top row: subleading
and leading jet peaks PbPb–pp. Bottom row: relative contributions from jet peaks and two-dimensional asymmetry to the double difference PbPb–pp, subleading–leading in total hemi-sphere ptrk
T . Statistical uncertainties are shown with vertical bars, and systematic uncertainties
7
Summary
In this analysis, the redistribution of momentum in dijet events is studied via two-dimensional ∆η–∆φ jet-track correlations in PbPb and pp collisions at√sNN =2.76 TeV, using data sets with
integrated luminosities of 166 µb−1and 5.3 pb−1, respectively. Events are selected to include a leading jet with pT,1 > 120 GeV and subleading jet with pT,2 >50 GeV, with an azimuthal
sep-aration of at least∆φ1,2 >5π/6. Subtracting the long-range part of the correlation from the jet
peaks, this work extends the studies of jet shape modifications in PbPb events relative to pp collisions to large radial distances (∆r ≈ 1) from the jet axis. These modifications are found to extend out to the largest radial distance studied in central PbPb events for both leading and subleading jets. The jet modifications are further studied differentially for balanced and unbal-anced dijet events, and as a function of ptrkT and collision centrality for each of these selections in PbPb and pp reference data. Transverse momentum redistribution around the subleading and leading jets, as well as differences in long-range correlated background asymmetry, are separately analyzed.
An excess of transverse momentum carried by soft particles (ptrkT < 2 GeV) is found for both leading and subleading jets in central PbPb collisions relative to the pp reference, consistent with previous studies of charged-particle yields correlated to high-pT jets. For unbalanced
dijet events, this low-ptrkT excess is greater on the subleading-jet side than on the leading-jet side. However, the difference in ptrkT contained in the Gaussian-like jet peaks is found only partially to account for the total ptrkT redistribution in the most central PbPb collisions with dijet events. In the long-range correlated distribution of ptrk
T under the jet peaks, it is found that the
excess of relatively high-pT particles (2< ptrkT < 8 GeV) on the subleading side relative to the
leading side, which is observed in asymmetric pp collisions and mainly attributed to three-jet events, is absent in most central PbPb collisions. This indicates that the fraction of events with additional jets in the asymmetric dijet sample is significantly lower than in an identical selection of dijet events in pp data. A long-range asymmetry in the low-pTparticles in dijet events is also
Acknowledgments
We congratulate our colleagues in the CERN accelerator departments for the excellent perfor-mance of the LHC and thank the technical and administrative staffs at CERN and at other CMS institutes for their contributions to the success of the CMS effort. In addition, we gratefully acknowledge the computing centres and personnel of the Worldwide LHC Computing Grid for delivering so effectively the computing infrastructure essential to our analyses. Finally, we acknowledge the enduring support for the construction and operation of the LHC and the CMS detector provided by the following funding agencies: BMWFW and FWF (Austria); FNRS and FWO (Belgium); CNPq, CAPES, FAPERJ, and FAPESP (Brazil); MES (Bulgaria); CERN; CAS, MoST, and NSFC (China); COLCIENCIAS (Colombia); MSES and CSF (Croatia); RPF (Cyprus); SENESCYT (Ecuador); MoER, ERC IUT and ERDF (Estonia); Academy of Finland, MEC, and HIP (Finland); CEA and CNRS/IN2P3 (France); BMBF, DFG, and HGF (Germany); GSRT (Greece); OTKA and NIH (Hungary); DAE and DST (India); IPM (Iran); SFI (Ireland); INFN (Italy); MSIP and NRF (Republic of Korea); LAS (Lithuania); MOE and UM (Malaysia); BUAP, CINVESTAV, CONACYT, LNS, SEP, and UASLP-FAI (Mexico); MBIE (New Zealand); PAEC (Pakistan); MSHE and NSC (Poland); FCT (Portugal); JINR (Dubna); MON, RosAtom, RAS and RFBR (Russia); MESTD (Serbia); SEIDI and CPAN (Spain); Swiss Funding Agencies (Switzerland); MST (Taipei); ThEPCenter, IPST, STAR and NSTDA (Thailand); TUBITAK and TAEK (Turkey); NASU and SFFR (Ukraine); STFC (United Kingdom); DOE and NSF (USA). IIndividuals have received support from the Marie-Curie programme and the European Re-search Council and EPLANET (European Union); the Leventis Foundation; the A. P. Sloan Foundation; the Alexander von Humboldt Foundation; the Belgian Federal Science Policy Of-fice; the Fonds pour la Formation `a la Recherche dans l’Industrie et dans l’Agriculture (FRIA-Belgium); the Agentschap voor Innovatie door Wetenschap en Technologie (IWT-(FRIA-Belgium); the Ministry of Education, Youth and Sports (MEYS) of the Czech Republic; the Council of Sci-ence and Industrial Research, India; the HOMING PLUS programme of the Foundation for Polish Science, cofinanced from European Union, Regional Development Fund, the Mobil-ity Plus programme of the Ministry of Science and Higher Education, the National Science Center (Poland), contracts Harmonia 2014/14/M/ST2/00428, Opus 2013/11/B/ST2/04202, 2014/13/B/ST2/02543 and 2014/15/B/ST2/03998, Sonata-bis 2012/07/E/ST2/01406; the Thalis and Aristeia programmes cofinanced by EU-ESF and the Greek NSRF; the National Pri-orities Research Program by Qatar National Research Fund; the Programa Clar´ın-COFUND del Principado de Asturias; the Rachadapisek Sompot Fund for Postdoctoral Fellowship, Chu-lalongkorn University and the ChuChu-lalongkorn Academic into Its 2nd Century Project Advance-ment Project (Thailand); and the Welch Foundation, contract C-1845.
References
[1] J. D. Bjorken, “Energy loss of energetic partons in QGP: possible extinction of high pTjets
in hadron-hadron collisions”, (1982). FERMILAB-PUB-82-059-THY.
[2] STAR Collaboration, “Direct observation of dijets in central Au+Au collisions at√sNN=
200 GeV”, Phys. Rev. Lett. 97 (2006) 162301,
doi:10.1103/PhysRevLett.97.162301, arXiv:nucl-ex/0604018.
[3] PHENIX Collaboration, “Transverse momentum and centrality dependence of dihadron correlations in Au+Au collisions at√sNN= 200 GeV: Jet-quenching and the response of
partonic matter”, Phys. Rev. C 77 (2008) 011901,
[4] ATLAS Collaboration, “Observation of a Centrality-Dependent Dijet Asymmetry in Lead-Lead Collisions at√sNN=2.76 TeV with the ATLAS Detector at the LHC”, Phys.
Rev. Lett. 105 (2010) 252303, doi:10.1103/PhysRevLett.105.252303, arXiv:1011.6182.
[5] CMS Collaboration, “Observation and studies of jet quenching in PbPb collisions at√ sNN= 2.76 TeV”, Phys. Rev. C 84 (2011) 024906,
doi:10.1103/PhysRevC.84.024906, arXiv:1102.1957.
[6] CMS Collaboration, “Jet momentum dependence of jet quenching in PbPb collisions at√ sNN=2.76 TeV”, Phys. Lett. B 712 (2012) 176,
doi:10.1016/j.physletb.2012.04.058, arXiv:1202.5022.
[7] ALICE Collaboration, “Measurement of jet suppression in central Pb-Pb collisions at√ sNN= 2.76 TeV”, Phys. Lett. B 746 (2015) 1,
doi:10.1016/j.physletb.2015.04.039, arXiv:1502.01689.
[8] CMS Collaboration, “Studies of dijet transverse momentum balance and pseudorapidity distributions in pPb collisions at√sNN=5.02 TeV”, Eur. Phys. J. C. 74 (2014) 2951,
doi:10.1140/epjc/s10052-014-2951-y, arXiv:1401.4433.
[9] CMS Collaboration, “Measurement of transverse momentum relative to dijet systems in PbPb and pp collisions at√sNN=2.76 TeV”, JHEP 01 (2016) 6,
doi:10.1007/JHEP01(2016)006, arXiv:1509.09029.
[10] CMS Collaboration, “Measurement of jet fragmentation in PbPb and pp collisions at√ sNN=2.76 TeV”, Phys. Rev. C 90 (2014) 024908,
doi:10.1103/PhysRevC.90.024908, arXiv:1406.0932.
[11] CMS Collaboration, “Modification of jet shapes in PbPb collisions at√sNN=2.76 TeV”,
Phys. Lett. B 730 (2014) 243, doi:10.1016/j.physletb.2014.01.042, arXiv:1310.0878.
[12] CMS Collaboration, “Correlations between jets and charged particles in PbPb and pp collisions at√sNN=2.76 TeV”, JHEP 02 (2016) 156,
doi:10.1007/JHEP02(2016)156, arXiv:1601.00079.
[13] CMS Collaboration, “Determination of Jet Energy Calibration and Transverse Momentum Resolution in CMS”, JINST 6 (2011) P11002,
doi:10.1088/1748-0221/6/11/P11002, arXiv:1107.4277.
[14] CMS Collaboration, “Description and performance of track and primary-vertex reconstruction with the CMS tracker”, JINST 9 (2014) P10009,
doi:10.1088/1748-0221/9/10/P10009, arXiv:1405.6569.
[15] CMS Collaboration, “The CMS experiment at the CERN LHC”, JINST 3 (2008) S08004, doi:10.1088/1748-0221/3/08/S08004.
[16] M. Cacciari, G. P. Salam, and G. Soyez, “FastJet user manual”, Eur. Phys. J. C 72 (2012) 1896, doi:10.1140/epjc/s10052-012-1896-2, arXiv:1111.6097.
[17] M. Cacciari, G. P. Salam, and G. Soyez, “The anti-ktjet clustering algorithm”, JHEP 04
[18] CMS Collaboration, “Underlying-Event Subtraction for Particle Flow”, CMS Detector Performance Summary CMS-DP-2013-018, 2013.
[19] T. Sj ¨ostrand, S. Mrenna, and P. Skands, “PYTHIA 6.4 physics and manual”, JHEP 05 (2006) 026, doi:10.1088/1126-6708/2006/05/026, arXiv:hep-ph/0603175. [20] R. Field, “Early LHC Underlying Event Data - Findings and Surprises”, in Hadron collider
physics. Proceedings, 22nd Conference, HCP 2010, Toronto, Canada. 2010.
arXiv:1010.3558.
[21] GEANT4 Collaboration, “GEANT4 — a simulation toolkit”, Nucl. Instrum. Meth. A 506 (2003) 250, doi:10.1016/S0168-9002(03)01368-8.
[22] I. P. Lokhtin and A. M. Snigirev, “A model of jet quenching in ultrarelativistic heavy ion collisions and high-pThadron spectra at RHIC”, Eur. Phys. J. C 45 (2006) 211,
doi:10.1140/epjc/s2005-02426-3, arXiv:hep-ph/0506189.
[23] CMS Collaboration, “Study of high-pTcharged particle suppression in PbPb compared to
pp collisions at√sNN= 2.76 TeV”, Eur. Phys. J. C 72 (2012) 1945,
doi:10.1140/epjc/s10052-012-1945-x, arXiv:1202.2554.
[24] CMS Collaboration, “The CMS high level trigger”, Eur. Phys. J. C 46 (2006) 605,
doi:10.1140/epjc/s2006-02495-8, arXiv:hep-ex/0512077.
[25] CMS Collaboration, “Studies of jet quenching using isolated-photon+jet correlations in PbPb and pp collisions at√sNN=2.76 TeV”, Phys. Lett. B 718 (2013) 773,
doi:10.1016/j.physletb.2012.11.003, arXiv:1205.0206.
[26] CMS Collaboration, “Multiplicity and transverse momentum dependence of two- and four-particle correlations in pPb and PbPb collisions”, Phys. Lett. B 724 (2013) 213, doi:10.1016/j.physletb.2013.06.028, arXiv:1305.0609.
[27] CMS Collaboration, “Observation of long-range, near-side angular correlations in proton-proton collisions at the LHC”, JHEP 09 (2010) 091,
doi:10.1007/JHEP09(2010)091, arXiv:1009.4122.
[28] CMS Collaboration, “Long-range and short-range dihadron angular correlations in central PbPb collisions at√sNN =2.76 TeV”, JHEP 07 (2011) 076,
doi:10.1007/JHEP07(2011)076.
[29] CMS Collaboration, “Observation of long-range, near-side angular correlations in pPb collisions at the LHC.”, Phys. Lett. B 718 (2013) 795,
doi:10.1016/j.physletb.2012.11.025, arXiv:1210.5482.
[30] CMS Collaboration, “Measurement of higher-order harmonic azimuthal anisotropy in PbPb collisions at√sNN= 2.76 TeV”, Phys. Rev. C 89 (2014) 044906,
doi:10.1103/PhysRevC.89.044906, arXiv:1310.8651.
[31] G.-Y. Qin and X.-N. Wang, “Jet quenching in high-energy heavy-ion collisions”, Mod. Phys. E 24 (2015) 1530014, doi:10.1142/S0218301315300143, arXiv:1511.00790.
A
The CMS Collaboration
Yerevan Physics Institute, Yerevan, Armenia V. Khachatryan, A.M. Sirunyan, A. Tumasyan
Institut f ¨ur Hochenergiephysik der OeAW, Wien, Austria
W. Adam, E. Asilar, T. Bergauer, J. Brandstetter, E. Brondolin, M. Dragicevic, J. Er ¨o, M. Flechl, M. Friedl, R. Fr ¨uhwirth1, V.M. Ghete, C. Hartl, N. H ¨ormann, J. Hrubec, M. Jeitler1, A. K ¨onig, I. Kr¨atschmer, D. Liko, T. Matsushita, I. Mikulec, D. Rabady, N. Rad, B. Rahbaran, H. Rohringer, J. Schieck1, J. Strauss, W. Treberer-Treberspurg, W. Waltenberger, C.-E. Wulz1
National Centre for Particle and High Energy Physics, Minsk, Belarus V. Mossolov, N. Shumeiko, J. Suarez Gonzalez
Universiteit Antwerpen, Antwerpen, Belgium
S. Alderweireldt, E.A. De Wolf, X. Janssen, J. Lauwers, M. Van De Klundert, H. Van Haevermaet, P. Van Mechelen, N. Van Remortel, A. Van Spilbeeck
Vrije Universiteit Brussel, Brussel, Belgium
S. Abu Zeid, F. Blekman, J. D’Hondt, N. Daci, I. De Bruyn, K. Deroover, N. Heracleous, S. Lowette, S. Moortgat, L. Moreels, A. Olbrechts, Q. Python, S. Tavernier, W. Van Doninck, P. Van Mulders, I. Van Parijs
Universit´e Libre de Bruxelles, Bruxelles, Belgium
H. Brun, C. Caillol, B. Clerbaux, G. De Lentdecker, H. Delannoy, G. Fasanella, L. Favart, R. Goldouzian, A. Grebenyuk, G. Karapostoli, T. Lenzi, A. L´eonard, J. Luetic, T. Maerschalk, A. Marinov, A. Randle-conde, T. Seva, C. Vander Velde, P. Vanlaer, R. Yonamine, F. Zenoni, F. Zhang2
Ghent University, Ghent, Belgium
A. Cimmino, T. Cornelis, D. Dobur, A. Fagot, G. Garcia, M. Gul, D. Poyraz, S. Salva, R. Sch ¨ofbeck, M. Tytgat, W. Van Driessche, E. Yazgan, N. Zaganidis
Universit´e Catholique de Louvain, Louvain-la-Neuve, Belgium
H. Bakhshiansohi, C. Beluffi3, O. Bondu, S. Brochet, G. Bruno, A. Caudron, S. De Visscher, C. Delaere, M. Delcourt, L. Forthomme, B. Francois, A. Giammanco, A. Jafari, P. Jez, M. Komm, V. Lemaitre, A. Magitteri, A. Mertens, M. Musich, C. Nuttens, K. Piotrzkowski, L. Quertenmont, M. Selvaggi, M. Vidal Marono, S. Wertz
Universit´e de Mons, Mons, Belgium N. Beliy
Centro Brasileiro de Pesquisas Fisicas, Rio de Janeiro, Brazil
W.L. Ald´a J ´unior, F.L. Alves, G.A. Alves, L. Brito, C. Hensel, A. Moraes, M.E. Pol, P. Rebello Teles
Universidade do Estado do Rio de Janeiro, Rio de Janeiro, Brazil
E. Belchior Batista Das Chagas, W. Carvalho, J. Chinellato4, A. Cust ´odio, E.M. Da Costa,
G.G. Da Silveira5, D. De Jesus Damiao, C. De Oliveira Martins, S. Fonseca De Souza,
L.M. Huertas Guativa, H. Malbouisson, D. Matos Figueiredo, C. Mora Herrera, L. Mundim, H. Nogima, W.L. Prado Da Silva, A. Santoro, A. Sznajder, E.J. Tonelli Manganote4, A. Vilela Pereira
Universidade Estadual Paulistaa, Universidade Federal do ABCb, S˜ao Paulo, Brazil
P.G. Mercadanteb, C.S. Moona, S.F. Novaesa, Sandra S. Padulaa, D. Romero Abadb, J.C. Ruiz Vargas
Institute for Nuclear Research and Nuclear Energy, Sofia, Bulgaria
A. Aleksandrov, R. Hadjiiska, P. Iaydjiev, M. Rodozov, S. Stoykova, G. Sultanov, M. Vutova University of Sofia, Sofia, Bulgaria
A. Dimitrov, I. Glushkov, L. Litov, B. Pavlov, P. Petkov Beihang University, Beijing, China
W. Fang6
Institute of High Energy Physics, Beijing, China
M. Ahmad, J.G. Bian, G.M. Chen, H.S. Chen, M. Chen, Y. Chen7, T. Cheng, C.H. Jiang,
D. Leggat, Z. Liu, F. Romeo, S.M. Shaheen, A. Spiezia, J. Tao, C. Wang, Z. Wang, H. Zhang, J. Zhao
State Key Laboratory of Nuclear Physics and Technology, Peking University, Beijing, China Y. Ban, G. Chen, Q. Li, S. Liu, Y. Mao, S.J. Qian, D. Wang, Z. Xu
Universidad de Los Andes, Bogota, Colombia
C. Avila, A. Cabrera, L.F. Chaparro Sierra, C. Florez, J.P. Gomez, C.F. Gonz´alez Hern´andez, J.D. Ruiz Alvarez, J.C. Sanabria
University of Split, Faculty of Electrical Engineering, Mechanical Engineering and Naval Architecture, Split, Croatia
N. Godinovic, D. Lelas, I. Puljak, P.M. Ribeiro Cipriano University of Split, Faculty of Science, Split, Croatia Z. Antunovic, M. Kovac
Institute Rudjer Boskovic, Zagreb, Croatia
V. Brigljevic, D. Ferencek, K. Kadija, S. Micanovic, L. Sudic, T. Susa University of Cyprus, Nicosia, Cyprus
A. Attikis, G. Mavromanolakis, J. Mousa, C. Nicolaou, F. Ptochos, P.A. Razis, H. Rykaczewski Charles University, Prague, Czech Republic
M. Finger8, M. Finger Jr.8
Universidad San Francisco de Quito, Quito, Ecuador E. Carrera Jarrin
Academy of Scientific Research and Technology of the Arab Republic of Egypt, Egyptian Network of High Energy Physics, Cairo, Egypt
A. Ellithi Kamel9, M.A. Mahmoud10,11, A. Radi11,12
National Institute of Chemical Physics and Biophysics, Tallinn, Estonia B. Calpas, M. Kadastik, M. Murumaa, L. Perrini, M. Raidal, A. Tiko, C. Veelken Department of Physics, University of Helsinki, Helsinki, Finland
P. Eerola, J. Pekkanen, M. Voutilainen
Helsinki Institute of Physics, Helsinki, Finland
J. H¨ark ¨onen, V. Karim¨aki, R. Kinnunen, T. Lamp´en, K. Lassila-Perini, S. Lehti, T. Lind´en, P. Luukka, T. Peltola, J. Tuominiemi, E. Tuovinen, L. Wendland