Temperatures and shelf-life duration in the strawberry
supply chain
Rita Gonçalves André Alcéo
Dissertação para a obtenção do Grau de Mestre em
Engenharia Alimentar
Orientador: Doutor Domingos Paulo Ferreira de Almeida
Júri:
Presidente: Doutora Margarida Gomes Moldão Martins, Professora Auxiliar com Agregação, Instituto Superior de Agronomia da Universidade de Lisboa.
Vogais: Doutor Pedro Nogueira Brás de Oliveira, Investigador Auxiliar, Instituto Nacional de Investigação Agrária e Veterinária, I.P.
Doutor Domingos Paulo Ferreira de Almeida, Professora Auxiliar com Agregação, Instituto Superior de Agronomia da Universidade de Lisboa.
III
Agradecimentos
Gostaria de agradecer a todos os que direta ou indiretamente permitiram a realização deste trabalho.
Em especial ao meu orientador, Domingos Almeida, por toda a ajuda que sempre me deu, pelo seu apoio incondicional, por toda a disponibilidade que sempre teve, por todas as sugestões, por ter sempre puxado por mim e por nunca ter deixado de acreditar que eu era capaz. Foi muito mais que um orientador e será sempre muito especial para mim.
Ao professor Chris Bishop por toda a informação, orientação e conselhos que me deu e por ter demonstrado sempre tanta disponibilidade para me ajudar. E pelo conhecimento que me passou do funcionamento da distribuição de frutas e hortícolas em Inglaterra.
Aos fornecedores e empresa de distribuição que tornaram todo este estudo possível. Por nos terem recebido nas suas instalações e terem sempre demonstrado toda a sua disponibilidade. À minha família que me apoiou em tudo o que conseguiam e não conseguiam.
Ao meu filho, Afonso Lopes, pela imensa força e garra que me deu, por toda a paciência que teve comigo e pela pouca atenção que lhe dei nestes últimos tempos. Todo o meu esforço é para que um dia lhe possa dar tudo e que o futuro dele seja o melhor possível.
Ao meu marido, João Lopes, pelo seu amor, carinho, companheirismo, compreensão, incentivo, paciência e dedicação, pelo apoio incondicional demonstrado em todos os momentos da minha vida. Por me ter ajudado sempre que precisei, por me ter dado espaço para trabalhar e por ter conseguido gerir tudo sem mim. Por ter investido o que podia e não podia para que possamos vir a ter uma vida melhor.
Aos meus pais, Licínia Gamito e João André, por todo o apoio e carinho, por sempre terem acreditado em mim, por todo o investimento que depositaram, pela educação que me deram e por terem tornado a pessoa que sou hoje. Pela paciência abismal que tiveram comigo, por me terem sempre apoiado nos bons e maus momentos. A eles lhe devo tudo o que sou e tenho hoje.
Ao chato do meu irmão, Pedro Alcéo, que apesar de tudo sempre me apoiou e ajudou quando precisei. Pelos conselhos dele, por me ter ajudado nas revisões e por me ajudar sempre que lhe ligava mesmo às dez da noite quando não conseguia resolver alguma coisa.
À fantástica Cristina Couto por tudo o que aturou, pelas horas que me fez companhia, por ter estado sempre lá quando precisava de alguma coisa, pela ajuda que me deu sempre que precisei. Espero que consiga ter um grande futuro.
IV A todos os que durante o estágio, que realizei neste período, me apoiaram e por todo o carinho que sempre me deram e que permitiram que conseguisses terminar este trabalho.
A todos os participantes do painel sensorial, pelo precioso contributo para este trabalho. A todos os que aqui não estão mencionados, mas que contribuíram para este trabalho e pelo apoio que me deram.
V
Abstract
Strawberry is a very perishable fruit that requires proper temperature management to reduce losses. Temperature abuses in the strawberry supply chain leads to high losses and dissatisfaction on the part of consumers and retailers. The temperature was monitored in two commercial circuits from harvesting to the final consumer, in June and July of 2016. Temperatures outside and inside of 500 g clamshells and inside the fruits were recorded in the three locations of the pallet. The air temperature inside 5 vehicles trunks and 5 domestic refrigerators were recorded at 60 seconds intervals. Strawberry (Fragaria ×ananassa) packaged in clamshells were stored at 0, 5, 10, 15, and 20 °C. Fruit were evaluated for colour, firmness, soluble solids content (SSC), and titratable acidity (TA). A 10-member panel assessed the fruit for odour, texture, juiciness, flavour, and overall liking at the same sampling dates. In the studied circuits fruits were exposed to an accumulated time-temperature (ATT) of 502.3 and 588.8 °C h. In both the display in store represented the largest contribution to the ATT (273.1 and 281.2 °C h). The maximum temperatures recorded in trunks each day were 47.3, 40.3, 41.4 and 48.2 °C with an outdoor temperature of 24.0, 26.1, 28.2 and 36.6 °C. In refrigerators were recorded average temperatures of 7.2, 4.3, 9.2, 7.4 and 7.7 ° C with reaching temperature fluctuations higher than 5 °C. The temperature had little effect on the physicochemical characteristics and sensory evaluation of the strawberry, but strongly influenced the evolution of the losses. The clamshells have become unmarketable after 3 days at 20 °C and 5 days at 15 °C. Damages development can arise in the retail or just in consumers houses with the ‘last mile’ temperatures being possibly the responsible for the biggest quality depreciation on strawberries.
VI
Resumo
A morango é um fruto muito perecível que requer uma gestão adequada da temperatura de modo a reduzir as perdas. Abusos de temperatura na cadeia de abastecimento do morango leva a grandes perdas e insatisfação por parte dos consumidores e retalhistas. A temperatura foi monitorizada em dois circuitos comerciais desde a colheita até ao consumidor final, em junho e julho de 2016. As temperaturas dentro e fora de cuvetes de 500 g e dentro dos frutos foram registradas nos três locais da palete. A temperatura do ar dentro de 5 bagageiras de veículos e 5 frigoríficos domésticos foi registada em intervalos de 60 segundos. O morango (Fragaria × ananassa) embalado em cuvetes foi armazenada a 0, 5, 10, 15 e 20 ° C. Os frutos foram avaliados quanto à cor, firmeza, teor de sólidos solúveis (SSC) e acidez titulável (TA). Um painel de 10 membros avaliou os frutos quanto ao odor, textura, suculência, sabor e apreciação global nas mesmas datas de amostragem. Nos circuitos estudados os frutos foram expostos a um tempo-temperatura acumulado (ATT) de 502,3 e 588,8 ° C h. Em ambos, a exibição em loja representou a maior contribuição para a ATT (273,1 e 281,2 ° C h). As temperaturas máximas registradas em bagageiras por dia foram 47,3, 40,3, 41,4 e 48,2 ° C com temperaturas exteriores de 24,0, 26,1, 28,2 e 36,6 ° C. Nos frigoríficos foram registradas temperaturas médias de 7,2, 4,3, 9,2, 7,4 e 7,7 ° C com flutuações de temperatura atingindo mais de 5 ° C. A temperatura teve pouco efeito sobre as características físico-químicas e a avaliação sensorial do morango, mas influenciou fortemente a evolução das perdas. As cuvetes tornaram-se não comercializáveis após 3 dias a 20 ° C e 5 dias a 15 ° C. O desenvolvimento de danos pode surgir nas lojas ou apenas em casas de consumidores com as temperaturas do "último quilómetro" sendo possivelmente o responsável pela maior depreciação de qualidade em morangos.
VII
Resumo extendido
O morango é um fruto muito perecível que tem de percorrer a cadeia de abastecimento, entre a colheita e o consumo, em cerca de uma semana em condições ótimas que raramente se verificam nas operações reais. A temperatura ótima para a conservação do morango é 0 °C. A longevidade pós-colheita reduz-se significativamente com uma inadequada gestão da cadeia de frio, nomeadamente o aumento da temperatura e os atrasos no arrefecimento após a colheita. Os excessos de temperatura na cadeia de abastecimento do morango conduzem a elevadas perdas e insatisfação, motivando muitas reclamações por parte de consumidores e retalhistas. A cadeia de abastecimento é uma série de processos, operações e entidades que ligam produtores, grossistas, retalhistas e consumidores, em conjunto com fornecedores de fatores de produção, prestadores de serviços e outras partes interessadas que leva os alimentos do seu estado natural até ao prato dos consumidores. O «último quilómetro» das cadeias de abastecimento é a fase final, onde a cadeia se dispersa por um grande número de pontos de venda que, por sua vez, se multiplicam no abastecimento a milhares de consumidores. O «último quilómetro» compreende as etapas desde que os frutos são adquiridos pelo consumidor, compreendendo o transporte e armazenamento doméstico. As temperaturas a que os frutos são sujeitos e as quebras da cadeia de frio que ocorrem nesta última fase não se encontram quantificadas de forma a permitir avaliar as consequências e permitir tomadas de decisão de gestão adequadas. Um dos problemas do «último quilómetro» da pós-colheita hortofrutícola consiste na dificuldade de controlar a temperatura quando os produtos estão na posse do consumidor. Os automóveis destes não são refrigerados e não se utilizam sacos isotérmicos no transporte de fruta refrigerada até casa. Os frigoríficos, eletrodomésticos não permitem um controlo da temperatura de conservação e têm regimes de funcionamento e capacidade de manutenção da temperatura muito variáveis.
Os objetivos deste estudo foram: (1) avaliar as alterações sensoriais e físico-químicas do morango como consequência da temperatura de armazenamento de forma a melhorar a gestão da cadeia de abastecimento; (2) tipificar as causas de perdas de morango a nível do retalho; (3) quantificar a evolução dessas causas durante a vida de prateleira; (4) avaliar as condições ambientais durante toda a cadeia de abastecimento, desde a colheita até casa do consumidor; (5) e as consequências das temperaturas no "último quilómetro", em particular, em bagageiras de carros e frigoríficos domésticos.
A temperatura foi monitorizada em dois circuitos comerciais, de dois fornecedores distintos, desde a colheita até o consumidor final, em junho e julho de 2016. As temperaturas fora e dentro de cuvetes de 500 g e no interior dos frutos foram monitorizadas em três locais da palete, topo, meio e base. A temperatura do ar foi monitorizada em intervalos de 60 segundos
VIII no interior de bagageiras de 5 veículos e de 5 frigoríficos domésticos. Morango (Fragaria x
ananassa) embalados em cuvetes de 500 g foram armazenados a 0, 5, 10, 15, e 20 °C e
analisados ao fim de 3, 5, 7, 10, 12 e 14 dias. Os frutos foram avaliados quanto à cor, firmeza, teor de sólidos solúveis (SST) e acidez titulável (AT). Um painel de 10 membros avaliaram os frutos quanto ao odor, textura, suculência, flavor e apreciação global, numa escala de 1 a 5. Num dos circuitos, até à entrega no entreposto foram registadas na polpa temperaturas máxima, média e mínima de 27,7, 4,5 e 0,7 °C, respetivamente. No outro circuito, os valores foram, respetivamente, de 35,1, 14,8 e 5,1 °C. Os frutos foram expostos a uma temperatura acumulada de 502,3 e de 588,8 °C h em cada um dos circuitos estudados. Em ambos os circuitos a disposição dos frutos em loja representou a maior contribuição para a temperatura acumulada (273,1 e 281,2 °C h), representando cerca de metade do valor total. Circuito 1 decorreu durante aproximadamente 7 dias e teve uma ATT total de 1172,2 °C h que pode ter levado a uma percentagem de frutos com danos de 42%. Circuito 2 decorreu apenas cerca de 5 dias e teve uma ATT de 941,4 °C h levando a uma estimativa de 35,8% de frutos com danos. Embora tenha havido uma diferença de quase dois dias entre os circuitos ambos levam a estimativas semelhantes de frutos danificados, o que indica que o circuito 2 foi menos eficiente em termos de gestão da temperatura.
As bagageiras atingiram valores de temperatura 20 °C superiores à temperatura exterior e valores absolutos próximos dos 50 °C. As oscilações da temperatura nas bagageiras seguiram o mesmo padrão em todos os veículos, mas com amplitudes diferentes. Veículos estacionados em garagens apresentaram temperaturas inferiores em cerca de 10 °C quando comparado com os que se encontravam estacionados no exterior. A temperatura máxima do ar das bagageiras durante o período do estudo foi registada no dia 3 de julho com um valor de 48,2 °C. Uma vez que a temperatura do ar em Lisboa nesse momento foi de 36,6 °C, o interior do porta-bagagens atingiu uma temperatura 11,6 °C acima da temperatura exterior. Nos outros dias a temperatura máxima atingida nas bagageiras foi de 47,3; 40,3 e 41,4 ° C, nos dias 1, 2 e 3, com uma temperatura máxima registada segundo o IPMA de 24; 26,1 e 28,2 °C, respetivamente. Um dos frigoríficos analisados, com apenas 6 meses de utilização, apresentou ciclos de arrefecimento inferiores a uma hora, com amplitudes inferiores a 0,5 °C e temperatura compreendidas entre 7,0 e 7,5 °C. Os restantes oscilaram em ciclos de 2 a 3 horas com amplitudes de 1,5 a 3,0 °C, mas não mantiveram a temperatura em torno de um valor médio constante. Os restantes frigoríficos não apresentaram ciclos frigorigénios regulares, sendo evidentes vários picos de temperatura relacionados com a abertura da porta por parte dos utilizadores. Foram registradas oscilações de 5,2; 2,5; 4,3; 2,1 e 4,5 °C nos frigoríficos. Essas oscilações são suscetíveis de causar condensação no interior de embalagens o que pode favorecer o desenvolvimento de bolores.
IX As cuvetes analisadas tornaram-se não comercializáveis após armazenadas 3 dias a 20 °C e 5 dias a 15 °C. Os fatores determinantes da qualidade do morango na cadeia de abastecimento são os danos mecânicos e as infeções patológicas, que se expressam rapidamente mesmo que não sejam evidentes após a colheita. As características físico-químicas e sensoriais ficam, no essencial, determinadas no momento da colheita e os efeitos da sua subsequente evolução pós-colheita não se sobrepõe, do ponto de vista de gestão integral da qualidade na cadeia, aos efeitos provocados pelos danos mecânicos e pelas podridões. A rápida evolução das perdas a temperaturas superiores a 0 °C mostra que a gestão da temperatura é fundamental, mesmo no final da cadeia de abastecimento ao nível do retalho e do consumidor. A análise das causas e a evolução dos sintomas das perdas revela que as características iniciais, as infeções latentes, o nível de inóculo e os danos mecânicos na colheita, acondicionamento e transporte são determinantes da satisfação de retalhistas e consumidores. A temperatura representa um peso superior sobre o desenvolvimento de danos do que o tempo de armazenamento, com os retalhistas a poderem aumentar o tempo de venda ou a qualidade potencial no momento de venda em 3 vezes se optarem pela exposição refrigerada em detrimento da temperatura ambiente. A velocidade de manifestação das pisaduras e podridões faz com estes danos latentes possam facilmente surgir no retalho ou em casa dos consumidores mesmo que os lotes estivessem isentos de danos visíveis à saída da central.
Palavras-chave: Cadeia de abastecimento, Morango, Qualidade, Temperatura,
X
Index
Agradecimentos ...III Abstract ... V Resumo ... VI Resumo extendido ... VII Index ... X Figure index ... XII Table index ... XIV Abbreviations ... XV
Introduction ... 1
Literature Review ... 3
Food supply chain ... 4
Temperature controlled supply chain ... 4
Production ... 6
Pre-cooling and storage ... 7
Transportation ... 8
Warehouse ... 9
Store ... 9
‘Last mile’ ...10
Strawberry: Postharvest handling and quality ...10
Fruit morphology ...11
Optimum handling conditions ...11
Losses throughout the strawberry supply chain ...12
Packaging ...13
Quality of strawberry fruit ...14
Material and methods ...19
Part I – Temperature throughout the supply chain logistic circuits ...20
Part II – Temperature effects on strawberry quality and self-life ...22
Fruit material and storage conditions ...22
Sampling schedule ...22
Fruit analyses during shelf-life ...23
Results and discussion ...27
Part I - Temperature throughout the strawberry supply chain ...28
Commercial circuit 1 ...28
XI
‘Last mile’ ...44
Part II – Temperature effects on strawberry quality and shelf-life ...49
Mass loss ...49
Fruit and calyx color ...49
Firmness ...51
Soluble solid content and titratable acidity ...51
Sensorial analysis ...52
Damage development ...54
Part III – Estimation of quality depreciation in the strawberry supply chain ...59
Conclusion ...61
Bibliography ...64
Annexes ...70
Annex I – Tasting Sheet ...71
Annex II – Photographs of the clamshells per temperature treatment ...72
Annex III – Photographs of 5 fruit per temperature treatment (same fruits for each temperature) ...73
XII
Figure index
Figure 1 - Typical food supply chain (adapted from Lakovou et al., 2016). ... 4
Figure 2 - Evolution of per capita fresh fruit consumption in Portugal 2010 to 2015 (INE, 2015a). ... 6
Figure 3 - Effect on cooling delay after harvest on the marketability of strawberries (redrawn from Mitcham et al., 1996). ...11
Figure 4 - Expedition unit with the location of the dataloggers. ...21
Figure 5 - Flow chart to classification of damages. ...25
Figure 6 - Strawberries with dry bruises. ...25
Figure 7 - Strawberries with wet bruises. ...25
Figure 8 - Strawberries with rot without visible hyphae. ...26
Figure 9 - Strawberries with rot with visible mycelium. ...26
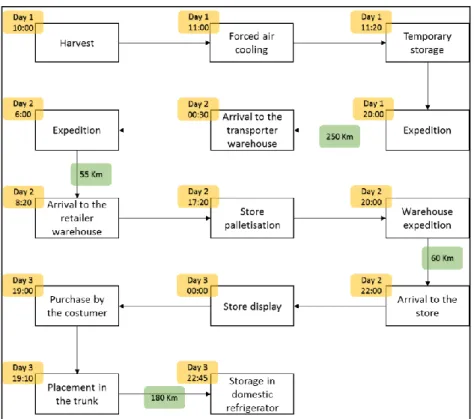
Figure 10- Strawberry supply chain from circuit 1. ...29
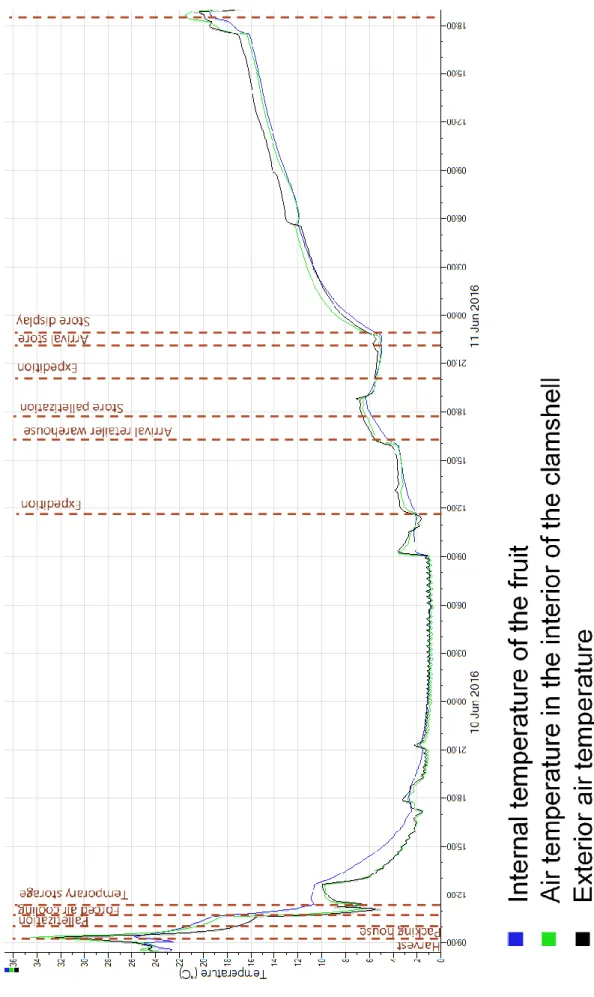
Figure 11 - Temperatures at different places of the clamshell from harvest until storage in consumer refrigerator. ...31
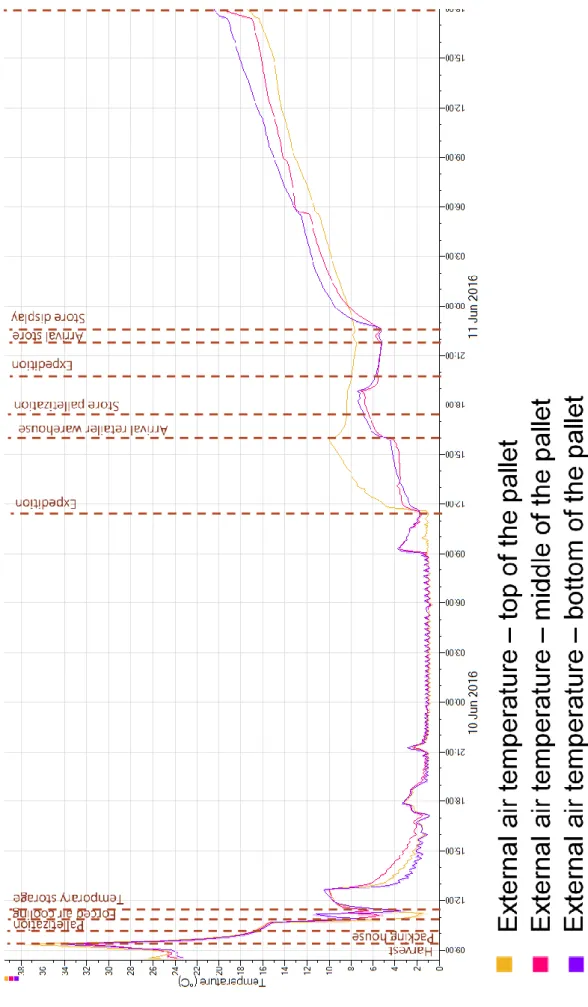
Figure 12 - External air temperature measured from harvest until storage in consumer refrigerator at different places of the pallet...32
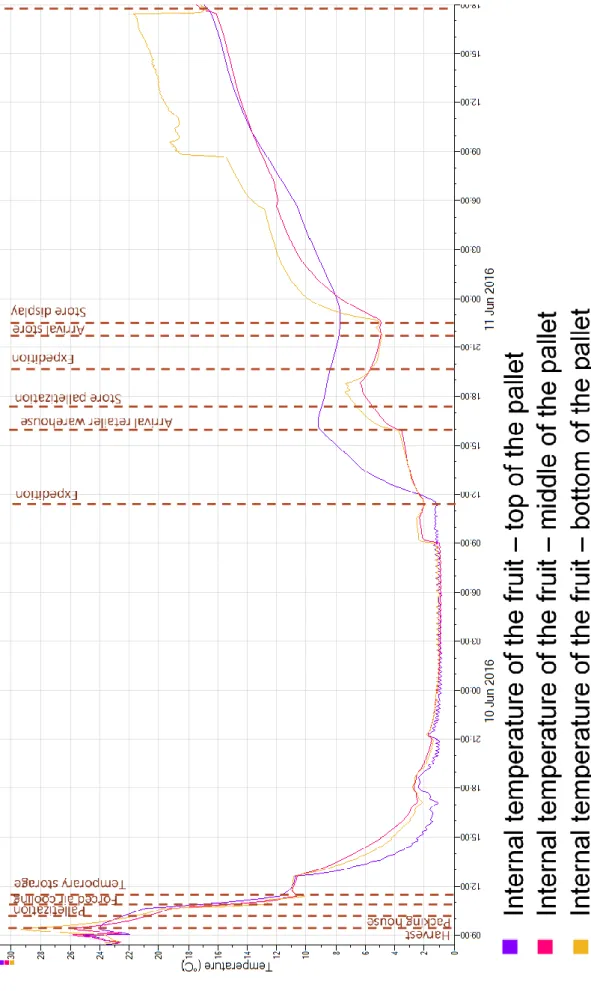
Figure 13 - Internal temperatures of the fruit from harvest until storage in consumer refrigerator at different places of the pallet. ...33
Figure 14 - Strawberry supply chain from circuit 2. ...37
Figure 15 - Temperatures at different places of the clamshell from harvest until storage in consumer refrigerator. ...39
Figure 16 - External air temperature measured from harvest until storage in consumer refrigerator at different places of the pallet...40
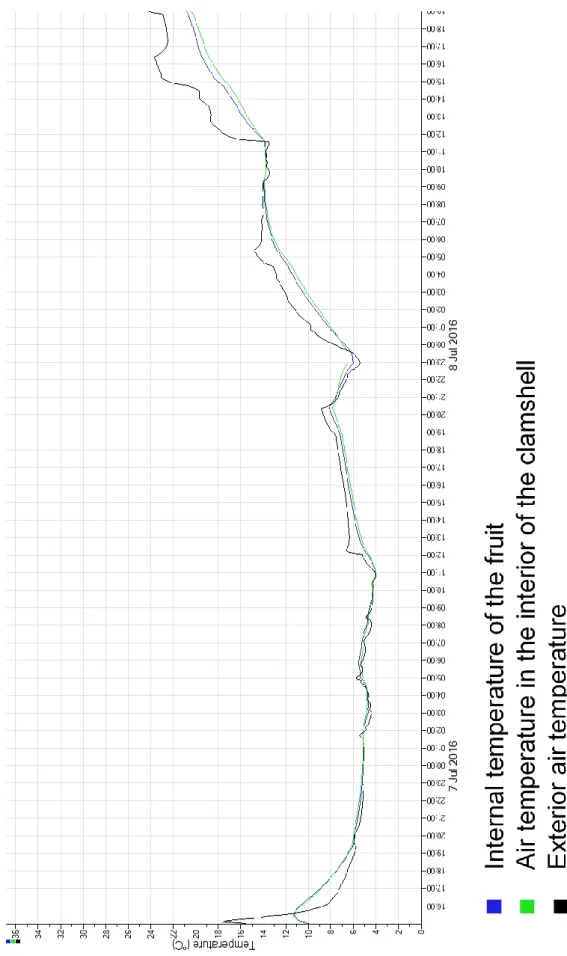
Figure 17 - Internal temperatures of the fruit from harvest until storage in consumer refrigerator at different places of the pallet. ...41
Figure 18 - Temperature measured from purchase at different places of the clamshell in the 1st circuit. ...44
Figure 19 - Temperature measured from purchase at different places of the clamshell in the 2nd circuit. ...45
Figure 20 - Temperatures measured in 5 different personal cars trunks. ...46
Figure 21 - Temperatures measured in 5 domestic refrigerators. ...47
Figure 22 - Evolution of mass loss at different storage temperatures. ...49
Figure 23 - Evolution of fruit and calyx lightness, chroma and hue angle at different storage temperatures. ...50
XIII Figure 24 - Evolution of fruit (a) pick of firmness and (b) depth of maximum firmness at different storage temperatures. ...51 Figure 25 - Evolution of soluble solid content at different storage temperatures. ...52 Figure 26 - Evolution of titratable acidity at different storage temperatures. ...52 Figure 27 - Evolution of Sensorial perception of odor, texture, juiciness and flavor and overall liking at different storage temperatures. ...53 Figure 28 - Evolution of fruits with damages at different storage temperatures (1st study). .55 Figure 29 - Evolution of fruits with damages at different storage temperatures (2nd study). ...55 Figure 30 - Evolution of fruits with damages at different storage temperatures on (a) 1st and (b) 2nd study. ...56 Figure 31 - Evolution of damages by type at different storage temperatures (1st study). ...57 Figure 32 - Evolution of damages by type at different storage temperatures (2nd study). ....57 Figure 33 - Evolution of the incidence of bruises and rots, as a percentage of total fruit at different temperatures depending on the storage time, 1st study. ...58
Figure 34 – Linear regression of the ATT and percentage of damaged fruits for (a) 5 and (b) 7 days of storage. ...60
XIV
Table index
Table 1 - Internal consumption of fruit in 2014 (adapted from INE, 2015b). ... 7
Table 2 - Map of samples testing days. ...23
Table 3 - Summary description and responsible operator of each operation. ...28
Table 4 - (continued) Summary description and responsible operator of each operation. ...29
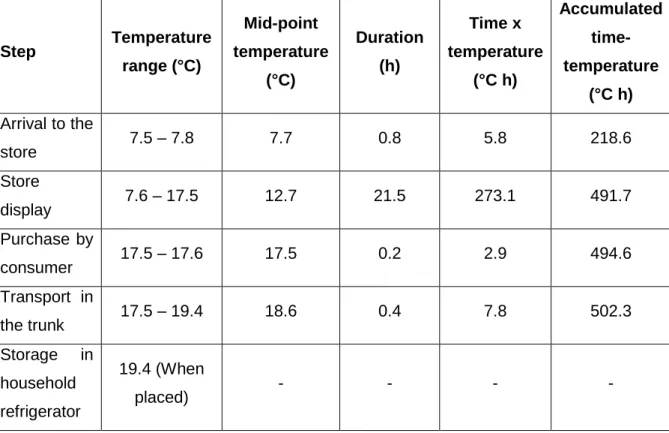
Table 5 - Exterior air temperature range, mid-point, duration, time-temperature (TT) and ATT of each supply chain step recorded on the middle of the pallet from the circuit 1. ...34
Table 6 - (continued) Exterior air temperature range, mid-point, duration, time-temperature (TT) and ATT of each supply chain step recorded on the middle of the pallet from the circuit 1. ...35
Table 7 - Summary description and responsible operator of each operation. ...36
Table 8 - (continued) Summary description and responsible operator of each operation. ...37
Table 9 - Exterior air temperature range, mid-point, duration, time-temperature (TT) and accumulated TT of each supply chain step recorded on the middle of the pallet from the circuit 2. ...42
Table 10 –(continued) Exterior air temperature range, mid-point, duration, time-temperature (TT) and accumulated TT of each supply chain step recorded on the middle of the pallet from the circuit 2. ...43
Table 11 - Minimum, maximum and mean temperature recorded in the vehicles trunks. ...46
Table 12 - Minimum, maximum and mean temperature recorded in the refrigerators. ...48
Table 13 - Accumulated time-temperature (ATT) and mean of the percentage of damaged fruits (%df) from both studies for each temperature and storage time. ...59
XV
Abbreviations
ATT - Accumulated time-temperature C* - Chroma
EU28 - European Union 28 members FAO - Food and Agriculture Organization H° - Hue degree
INE - Instituto Nacional de Estatística
IPMA - Instituto Português do Mar e da Atmosfera L* - Lightness
PET - Polyethylene terephthalate SSC - Soluble Solid Content TA - Titratable Acidity
TCSC - Temperature Controlled Supply Chain
TIF - Transportes Ideal da Freixeira (transportation subcontracted company) TT - Time-temperature
WHO - World Health Organization Wi - Initial weight
1
2 For many years the fruits and vegetables market was dependent on the seasonality of the products and their perishability. The development that occurred on the last decades on the supply chains allowed products to be transported in refrigerated environments and made possible for fruits and vegetables to travel all over the world, while maintaining their quality. Consumers demand for quality products increased considerably and they are not willing to pay or consume products with bad appearance and even slightly damaged, which has led to heavy losses that occur in stores and at their homes every day. This problem has leaded to the evolvement of retailers and world organizations in order to improve supply chains, storage and display conditions and consumer awareness in order to improve product quality and reduce food waste.
Strawberry is one of the most perishable fruit in the market being the main focus of complaints by retailers and consumers. Strawberry losses that occur at the retailer and consumer level are not quantified. However, information gathered from the distribution operators, not empirically confirmed, indicate that the strawberry is the fruit with the highest proportion of breaks in modern distribution. The management of temperature in the whole supply chain is the determining factor.
Although optimal storage temperature to preserve strawberry is 0 °C, in the Portuguese retail stores these are often found at room temperature, instead of the British market where strawberries are mostly found in refrigerated displays. Shelf life at 0 °C is up to 7 days (Mitcham, 2004), and it is shorter at higher temperature.
It is undeniable that the cooling conditions are the key to good management of strawberry postharvest quality. However, if the logistical level there is no doubt about the proper management of temperature (Mitchell et al., 1996) - that does not mean that the recommendations are adopted rigorously - since at the exposure level on the point of sale a dilemma arises. In store if exposed to room temperature (eg, 20-22 °C) is increased the emission of volatile aroma compounds from the fruit which leads to a higher perception of odor by the consumer promoting impulse sale, while refrigerated display (2 to 4 °C) allows the maintenance of strawberries quality, but restricts the aroma released and therefore impulse buying.
The objectives of the studies reported herein were: (1) To evaluate the sensory and physicochemical changes of strawberry as affected by temperature to improve supply chain management; (2) Typify the causes of losses of strawberry at the retail level; (3) Quantify the evolution of these causes during shelf life; (4) Evaluate the environmental conditions during the whole supply chain, from harvest to consumer household and (5) The consequences of the temperatures in the ‘last mile’, in particular, in cars trunks and domestic refrigerators.
3
4
Food supply chain
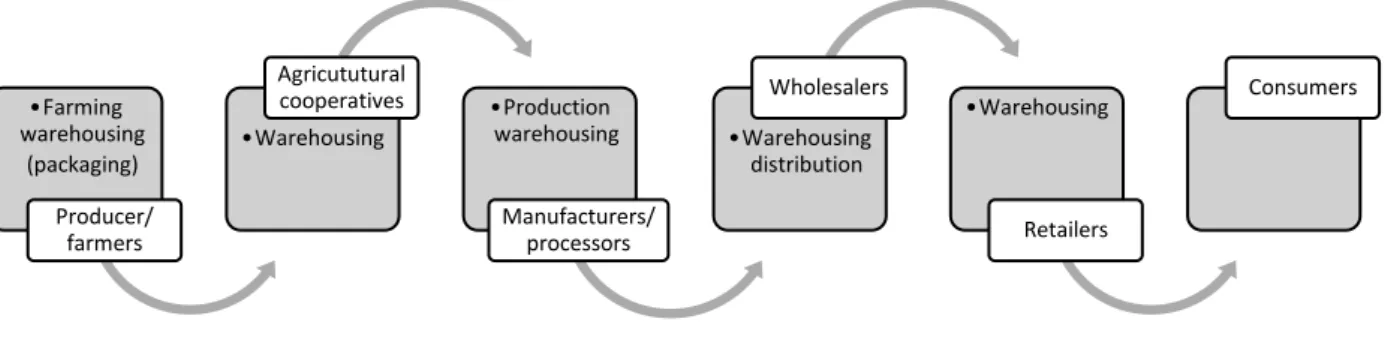
Food supply chains are a series of processes, operations and entities linking suppliers, manufacturers, freight service providers, retailers, and consumers, along with other stakeholders, that take the food from its raw material state to the consumer’s plates (Dani, 2015; Nagurney & Li, 2016). Supply chain management is essential since the consumers are increasingly demanding and food needs to be available at the right time, right quality and right quantity (Dani, 2015), reaching a high level of complexity in international supply chains. A typical food supply chain and its stages are represented in Figure 1.
Figure 1 - Typical food supply chain (adapted from Lakovou et al., 2016).
Modern food supply chains must take into account quality, technology, information technology, regulatory framework, logistics, and consumer behavior (Bourlakis & Weightman, 2004). Logistics is a key component of supply chain management. Logistics is « the operational component of supply chain management, including quantification, procurement, inventory management, transportation and fleet management, as well as data collection and reporting. » (Dani, 2015). Logistic is highly dependent on the information technology systems (Dani, 2015) and have becomes more challenging when all the supply chain needs controlled temperature (Bourlakis & Weightman, 2004).
Temperature controlled supply chain
Some food products need to be maintain in a constant cold environment to maintain its quality and safety to the consumer (Brenner, 2015) during a reasonable shelf life period to ensure proper functioning of the supply chain (Bourlakis & Weightman, 2004). A supply chain operated under refrigerated conditions is called a «cold chain» or, more generally, a temperature controlled supply chain (TCSC).
•Farming warehousing (packaging) Producer/ farmers •Warehousing Agricututural cooperatives •Production warehousing Manufacturers/ processors •Warehousing distribution Wholesalers •Warehousing Retailers Consumers
5 A TCSC is a specific food supply chain where the products need to be maintained at low temperatures throughout the different stages. Though this is a complex and expensive process due to the length and the dedicated distributions facilities and equipment’s to control temperature from the producer to the consumer (Bourlakis & Weightman, 2004; Dani, 2015). There has been an intensification in the investment on the cool supply chains. Given the large capital investments and operating expenses required for cold storage and transportation, there is growing need for articulation among the cool chain stakeholders, which requires a common understanding of the whole cold chain challenges (Cool Chain Europe, 2016)
Cold chains operate at different temperature levels according to the product group. Frozen foods require -25 °C for ice creams, cold chill temperatures for fresh meat, dairy and some fruits and vegetables needing 0°C to +1°C, medium chill temperatures for pastry, butter and cheese requiring +5°C and exotic chill temperatures demanding +10°C to +15°C for potatoes, eggs, exotic fruits and bananas. That leads to a more complex process when products with different necessities and characteristics need to be transported together (Bourlakis & Weightman, 2004). The multi-temperature vehicles can be a solution for mixed loads, when products with different temperature requirements need to share storage or transportation space (Dani, 2015).
According to Dani (2005) there are 6 factors to take into account when designing supply chain for perishable products that need controlled temperature:
1. Guarantee that the temperature required for the specific product can be maintained throughout the entire supply chain;
2. Type of transportation used should be decided according to the cost and shelf life of the product;
3. Food safety must be controlled, traceability guaranteed, and the regulatory requirements applied.
4. Packaging where the product will be transported should minimize the exposure and increase shelf life;
5. Monitoring of temperature, movement, location, humidity and other relevant parameters of the product, if possible in real time, and use the data for analysis and future improvements;
6. Understand the dynamics of the cold chain and assure an effective cost and on-time delivery.
This type of supply chains has specific requirements regarding the strategy behind collaborative logistics projects; failure in implement a collaborative strategy are a barrier to successful supply chain operation (Lakovou, et al., 2016).
6
Production
The fruit supply chain starts at the farm, the organization that assures primary production of fresh fruit produce from the crop. Farms can be a family-owned and run business or be incorporated as small to large corporations.
The agricultural sector maintains the food availability and the sustainability for the population and the economy (Dani, 2015). Therefore, it is specific of every country or region. The Portuguese farming sector is undergoing fast changes. From 1989 to 2005 the number of agricultural holding in Portugal decreased by 46%, yet the average size of these holding increased by 70% (INE, 2007). The average size of the agricultural holdings in Portugal are very similar to the EU28 with 13.8 and 14.4 hectares by farm, respectively. In addition, 46.2% of these farms have less than 2 hectares. These farms are managed by older farmers when compared to the EU28 average with 50% of the owners 65 years old or more in contrast to the 29% of EU28 (Alves, 2014; Eurostat, 2016). However, there has been an increase of qualified people who dedicate to agriculture from 1.8% to 3.2% of the total of producers from 1995 to 2005 (INE, 2007). The population dedicated to the agricultural sector in Portugal its only 2.8% of the total employed population (INE, 2015b).
These structural characteristics of the farming sector in Portugal determine, in part, the structure of supply chains of fruit and vegetables, and their response to the pull driven major operators, such as the modern retailing sector.
Fresh fruit sector in Portugal
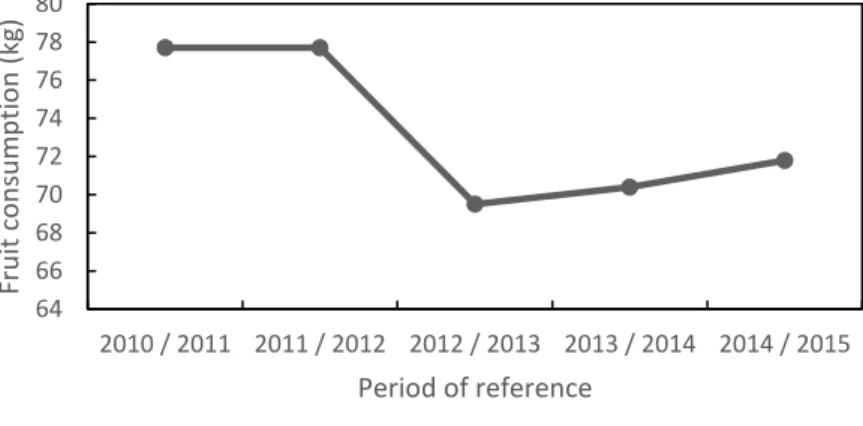
The consumption of fresh fruit decreased throughout the past years but are presenting a small increase rate since 2013 (fig. 2). The food retail companies are making some effort in order to improve the quality of these product and incentive people to buy by appealing with publicity on television and weekly promotional flyers.
Figure 2 - Evolution of per capita fresh fruit consumption in Portugal 2010 to 2015 (INE, 2015a). 64 66 68 70 72 74 76 78 80 2010 / 2011 2011 / 2012 2012 / 2013 2013 / 2014 2014 / 2015 Fru it con su m p tio n (k g) Period of reference
7 The Portuguese market regarding to supply balances of fresh fruit had 76.8% auto provisioning capacity (2013/2014), below of the internal needs that must be met by imported fruit (INE, 2015a). Table 1 presents the internal consumption of fruits and of the most marketed fruit types.
Table 1 - Internal consumption of fruit in 2014 (adapted from INE, 2015b).
Item Internal consumption Proportion of total Total of fruits 1,175,000 t 100% Apples 305,000 t 26% Citric fruit 196,000 t 17% Pears 99,000 t 8% Peaches 71,000 t 6% Table grapes 57,000 t 5%
There a few fundamental drivers for fruit and vegetable consumption that require responses from the supply chain. The low consumption of fruits and vegetables is commonly associated with obesity (WHO, 2016). A reduced risk of mortality from all causes, particularly cardiovascular diseases, can be archived with an increase consumption of fruits and vegetables (Wang, et al., 2014). However according to the WHO an estimated 5.2 million deaths worldwide in 2013 could have been prevented by increasing the fruits and vegetables consumption (Anon, 2016).
Fruits and vegetables are commonly associated with health and good eating habits. The Portuguese market however has still a lot of space to grow since their consumption remains below the WHO recommendation with only 72% of the Portuguese population consuming fruits and 55% vegetables on a daily base (INE, 2016). The WHO suggest people to eat at least 400 grams of fruits and vegetables per day to improve their overall health (Anon, 2016) and has developed in 1988 a worldwide campaign “5 a day” with the goal of improving the consumption of fruits and vegetables for at least 5 servings a day (WHO, 2003).
Pre-cooling and storage
The fruit sector handles products that start losing value immediately after harvest (Dani, 2015). The removal of field heat as soon as possible is essential to maintain the quality and product shelf life (Welby & McGregor, 2004). Every product that is going through the cold chain should be precooled before placed at the storage temperature (Almeida, 2005). The removal of field heat can be done in normal storage rooms but has numerous advantages when held in a rapid
8 cooling chamber. The precooling requires increased power and air flow rate in order to remove the heat in a faster way than what a cold room can supply (Almeida, 2005).
The precooling can help extend the product life by reducing the respiration rate, the rate of ripening, the moisture loss, the ethylene production and the spread of decay. The success of this step depends on: the time between harvest and precooling; the type of shipping container; the use and type of packaging; the initial temperature of the product; the velocity or amount of cold air, water or ice; the temperature desired; the sanitation of the air or water and the maintenance of the temperature of the product before (Welby & McGregor, 2004).
To meet with consumer requirements there has been an increasing investment on long-term storage facilities since they can add value to products by increasing their selling life and allowing to have some products available off season (Williams, 2014). However, the storage of perishable products evolves costs, so the consumer need to value this cost on the product to obtain return on the investment (Williams, 2014).
Transportation
Transport is a key element on the supply chain, connecting different stages and allowing the product to go from the producer to the consumer. Transportation is associated to high costs that may represent a large share of the total supply costs and one of the main sources of quality depreciation (Almeida, 2005). However, moving products from one place to another is warranted whenever it adds values, as happens with every logistic operation.
The most frequent problems found during transportation are associated with the displacement of the load and the compression of the products. Vibrational damages, mishandling, and waiting times under non-refrigerated conditions on the loading dock can also lead to high quality or even commercial losses. However, the lack of temperature control is what leads to the biggest quality problems during fruit and vegetable transportation. The refrigerated transportation equipment should not be used to remove field heat since it does not have the refrigeration capacity to cool down products (Welby & McGregor, 2004; Almeida, 2005). When loading the products for transport it is important to guarantee that they can be mixed and are compatible. Further challenges arise when transporting fruit and vegetables that can have negative effects on each other (Brenner, 2015). The recommended temperature and relative humidity, the production and sensitivity to ethylene and the production and absorption of odors are characteristics that need to be taken in account when preparing a load to ship (Welby & McGregor, 2004; Almeida, 2005).
9 It is crucial to maintain optimal temperature conditions during transportation but also the frequency and extend of temperature deviations encountered in transit should be taken in account (Brenner, 2015). When choosing the type of equipment, the follow factors must be considered: the destination; the value of the product; the degree of perishability; the volume transported; the temperature and humidity recommended; the exterior temperature throughout the transport; time in transit to reach destination by air, land or ocean transport; freight rates negotiated with the carriers and the quality of the service (Welby & McGregor, 2004).
Warehouse
A warehouse is a temporary place where products are stored and dispatched as quickly, effectively and efficiently as possible to reach the stores in a timely and cost-effective manner (Richards, 2014). Large retailers have their own distribution centers where producers deliver the products and then are distributed to individual retail stores (Dani, 2015). Usually these facilities are located near industrial centers, urban areas and nearby major transport routes (Zajac, 2016).
Warehouses represent an average 22% of the total logistics costs to the companies. When managing products that need to be maintain refrigerated the demand of energy is enormous as the costs associated (Zajac, 2016).
Nowadays the retail companies are investing on the quality of fresh products and most retailers do not have stocks of fruits and vegetables overnight. The current trend is to move the products from warehouses as faster as possible, optimizing the warehouse managing (Gustafsson, et al., 2006).
Store
The final selling point is where the consumer meets the fruit handled by the supply chain. Various types of outlets can fulfil this role in a supply chain, but in developed countries a large percentage of fruit are sold to the consumer in retail stores from modern distribution companies that operate a large number of stores in one or various countries.
An attractive produce department is regarded by many retailers as the best way to give a positive quality image of their stores. Fruit and vegetable sensory attributes, such as color, texture, and aroma are easily perceived by the consumers and significantly affect their purchase decision. Some fresh products as fruit and vegetables need to be in a refrigerated displayer in order to maintain their quality.
10 Fruits and vegetables are often handled under adverse environmental conditions, resulting in produce with poor quality and shorter shelf life, and increased waste at the retail and consumer levels.
‘Last mile’
‘Last mile’ is the stage between store and the consumer domestic refrigerator. While the stages of the supply chains from the producer until the product gets to the store has been the focus of a lot of studies, the path that the fruits take after being purchased is still understudied. Even though all intervenient of the supply chain are able to maintain the fruits under constant temperature problems can occur in the ‘last mile’. The biggest problem of the ‘last mile’ of fruit and vegetable is the difficulty to control the temperature when the products are in consumer’s hands.
Consumer’s cars are not refrigerated and most do not use insulated bags to transport the fruits home. In the Summer temperatures can get very high and in most trunks the temperature can reach values of 50 °C leading to possible deterioration of the fruits compromising the entire effort made until then.
Refrigerators and appliances that allow to control fruit and vegetables storage temperature at the end of 'last mile', have operating systems and temperature control capabilities that vary widely. The consumer does not have the capacity to control the temperature in a precise way inside the refrigerator, neither has (in the great majority of the cases) a display to know the temperature at which the refrigerator is in that moment.
Strawberry: Postharvest handling and quality
Strawberry was chosen to address the supply chain temperature effects on quality and losses. This sections, reviews and summarizes the major issues related to postharvest strawberry handling and quality.
Strawberry temperature and relative humidity play the biggest role when addressing to quality and deterioration control. The temperature management can control ripening, softening, textural and color changes, moisture loss, and spoilage due to fungal invasion (Hardenburg et al., 1986). Changes in color and development of visible decay are the main causes of changes in strawberry visual quality. Being these characteristics evolution dependent on increased time and temperature (Nunes, 2008).
11
Fruit morphology
Strawberry, Fragaria x ananassa, belongs to the Rosaceae family. Although commonly being referred as a fruit, strawberry is derived from receptacle containing multiple achenes (the actual botanical fruit). However, from the standpoint of ripening and postharvest behavior, the strawberry receptacle behaves like an actual fleshy fruit (Mitcham, 2014). According to Szczesniak and Smith (1969) the strawberry has 5 tissue zones: Epidermis, consisting of polygonal cells and long, pointed, thick-walled hairs; hypodermis, composed of meristematic cells with no intercellular spaces; cortex or true flesh, consisting of rounded cells with intercellular spaces; bundle zone, comprising spiral and annular vessels; and the pith, consisting of thin-walled cells which often separate during the growth of the berry leaving large cavities.
Optimum handling conditions
Strawberries should be ideally stored at 0 ± 0.5°C with 90 to 95% relative humidity in order to reduce the produce deterioration rate and raise the potential market life (Mitcham et al., 1996). It is essential to pre-cool the fruits as fast as possible after harvest by removing the field heat. The marketability can be extremely reduced with the cooling delay (fig. 3). The pre-cooling should be done by forced-air cooling although sometimes the fruits are placed in room-cooling (Mitchell et al., 1996). The reduce of marketability is mainly due to decay, weight loss, changes in color, decreased firmness and soluble solid content (Nunes et al., 1995). The incidence and severity of decay, mainly caused by Botrytis cinerea and Rhizopus stolonifera, can be reduced by 25% and 24%, respectively if the fruits are properly pre-cooled (Nunes et al., 2005).
Figure 3 - Effect on cooling delay after harvest on the marketability of strawberries (redrawn from Mitcham et al., 1996).
If stored at 0 °C fruits can be kept for 7 to 10 days with good quality. When exposed to higher temperatures the exposure time and the temperature raise are both relevant to the possible deterioration (Kader, 2002). A 10 °C raise on the temperature can increase two to four folds
0 20 40 60 80 100 0 2 4 6 8 % M ar keta b le
12 the rate of deterioration (Mitchell et al., 1996) as the respiration rate increases and the sugars and acids decrease (Moraga et al., 2006). According to Shin et al. (2007) fruits stored for a short period of time, 4 days, can be kept at 10°C with no significant difference on the fruits quality.
It is essential to keep the temperature as closed to 0 °C throughout the whole supply chain and minimize temperature fluctuations that can lead to water condensation. In order to reduce the water loss and condensations, the relative humidity should be maintained as closed to 90 to 95% as possible. The condensations can enhance the expression of bruising, increase weight loss and accelerate decay. Whenever compromises are required, it is better to expose the fruits to optimal temperature only at some stages of the chain than maintaining the fruits at a higher and constant temperature (Nunes et al., 2003).
Losses throughout the strawberry supply chain
The control of food waste is an issue that concerns more and more people and institutions worldwide. Close to one-third of food produced for human consumption is wasted every year, in the fruits and vegetables chain more than 40% is wasted (Sonesson & Meybeck, 2011). Good management of the entire supply chain is crucial, but challenging. Sometimes growers have peaks of production that the market cannot absorb generating high volumes of waste. Selling point promotions are used to drive demand, and can raise the sales for up to 50%, although retail companies may not be able to organize promotions quickly enough to respond to surpluses. Planning fruit production is therefore fundamental to meet with the demand (Terry et al., 2011).
According to Terry et al. (2011), strawberry waste occurs mainly due to disease, physical breakdown and handling, with varietal selection, adequate temperature and relative humidity management being crucial to reduce waste.
A survey in the United Kingdom revealed that strawberry losses in the supply chain occur mainly at harvest, reaching 20% of the entire production (Terry et al., 2011). Undersized and diseased berries; varietal selection; inadequate removal of field heat; and high temperature and relative humidity are the main causes of field loss and waste. Hot weather tends to increase the percentage of fruits in the field that become darker and are more prone to bruising, which can lead to an increased waste in the field or in later stages of the supply chain. A big problem are the fruits that have no market, as class II fruits or damaged fruits, who are not always picked up leading to an increased level of pathogen load in the field and therefore an increase disease incidence in the remaining fruits (Terry et al., 2011).
13 After harvested the strawberries are usually transported to the packing house where they are cooled and stored until shipped. At these stages the waste was estimated at 3% with the main causes of deterioration being softness, bleeds, molds and internal breakdown; different interpretations on product specifications by suppliers; and customers inflexibly that cannot turn promotions on quickly enough (Terry et al., 2011).
More than 85% of the complaints from retailers are due to fruits breakdown and mold development. To avoid losses, it is essential to maintain strawberries as close as possible to their optimal temperature (0 °C) from harvest until consumption. However, sometimes in Summer and during promotions retailers have no refrigerated space or choose to display the fruit in non-refrigerated areas to increase sales. This practice can lead to higher losses not only in store but also in the costumer household. At retail stores the waste was estimated in the United Kingdom at 2 to 4%, mainly due to insufficient temperature control capacity in-store and back- of-store (and wholesale) especially for high promotion volumes (e.g. gondola ends) during the Summer; inappropriate stacking (side stacking) of clamshells; and inaccurate forecast of demand and demand fluctuations (Terry et al., 2011). Demand for strawberry in the United Kingdom can increase by 40% when the hot weather is installed (Terry et al., 2011). A large percentage of the waste at retail level is avoidable. In many instances, a clamshell is discarded in the store if it contains one single damaged fruit; even though most fruit in the package are fit for consumption, the cost of repacking leads to the rejection of the whole selling unit (Terry et al., 2011).
The percentage of fruit wasted at the consumer household level can be large. In Europe, most of the total supply chain waste occurs in the field followed by the consumers households (Sonesson & Meybeck 2011). However, close to 15% of the wasted fresh fruits could be avoidable. The major cause of waste that occurs in the consumer house is due to excess storage time after purchase with 80% of the consumers admitting not consuming the purchased fruit in time (Murphy & Quested, 2014). In Portugal close to 10% of the fruits produced are wasted at consumer level (Batista et al., 2012).
Packaging
Strawberries are very sensitive to compression and vibration damage and very susceptible to water loss. Therefore, packaging must be chosen to provide physical protection to the fruits. Postharvest life can be increased by the package type and the packaging method (Jobling, 2000). Generally, strawberries are harvest to polyethylene terephthalate (PET) or recycled PET clamshells with a clip-on lid or a heat seal film. The bottom of the clamshell is usually
14 padded with a bubble wrap to minimize vibrational damages. These clamshells (primary packaging) are usually placed in returnable plastic trays (Terry et al., 2011).
One of the biggest consequence of the temperature fluctuation is the condensations inside the clamshells that increase the potential for fungal disease infection (Mirzaee & Bishop, 2010). The clamshells must be vented to allow air circulation through the fruits to minimize possible condensations (Linke & Geyer, 2013).
Quality of strawberry fruit
To properly address quality, it is important to distinguish objective quality from perceived quality. While objective quality may be described as “the measurable and verifiable superiority on some predetermined ideal standards”, perceived quality is linked to the consumer’s perception of the product. Consumer perceived quality depend on prior experience, purpose of use or quality consciousness (Hansen & Solgarrrd, 2004).
Characteristics of quality
Strawberry is a non-climacteric that does not ripe after harvest (Thompson, 2015). Ethylene production rate of strawberry is very low and remains relatively unchanged during ripening. Exposure to exogenous ethylene do not enhance ripening but can increase disease development and decay incidence (Mitcham et al., 1996).
It is essential to harvest the fruits at their optimal maturity, fully ripe, or with at least 3/4 of the fruit showing red color. For high quality the fruits must be uniformly red, firm, flavorful and free of defects and disease (Mitcham, 2014). For consumer acceptable flavor, the fruit should have a minimum of 7% soluble solids and not more than a 0.8% titratable acidity (Mitcham et al., 1996).
Appearance is a dominant aspect in the perception of freshness by the consumers; withered sepals, bruises, and decay are major appearance defects (Péneau et al., 2007). In addition, fruit shape and uniform size of the batch are key to the overall appearance of the selling unit. Flavor, and the related taste and odor, are also essential quality characteristics. Fermentation odor, spongy texture, sour and fermentation flavor negatively affect quality perception (Péneau et al., 2007).
15
Weight loss
Weight loss in strawberries can lead to poor appearance due to development of shriveling, dryness of the calyx, and darkening red color (Nunes et al., 2005). Water is the main component of strawberries, accounting for 91% of its total weight (INSA, s.d.). Water loss can be rapid if the fruit is not stored at low and constant temperature (Nunes et al., 1998).
According to Nunes and Emond fruit stored at 20 °C in just 2 days lose twice as much weight (6% of their initial weight) than fruit stored at 0, 5, 10 and 15°C that may lose an average of 3% (Nunes, 2008). Weight loss can be minimized by packaging the fruits in clamshells immediately after harvest (Paraskevopoulou-Paroussi et al., 1995), however, closed packaging under variable temperatures can lead to condensations and consequently increase the incidence of fungal diseases (Berrie et al., 2002).
Weight loss on strawberries stored in fluctuating temperature was higher than in constant temperature (Nunes & Emond, 1999; Nunes et al., 2003; Mehrdad et al., 2008) increasing as temperature increased from 1 to 20°C (Nunes et al., 1998) According to Robinson et al. (1975) strawberries with more than 6% of weight loss become unmarketable.
Fruit and calyx color
Color is one of the most important quality attributes to consumers (Péneau et al., 2007; Crecente-Campo et al., 2012). Although red color may increase after harvest, in some cultivars, fruits harvested with less than 3/4 red color will not reach the same visual as those harvested at the proper maturity stage (Nunes et al., 2006).
Strawberry color is determined by anthocyanins. Pelargonidin-3-glucoside is the major strawberry anthocyanin, accounting for approximately 91.5% of the total anthocyanins, followed by cyanidin-3-glucoside; together these two anthocyanins account for 96% of the total (Crecente-Campo et al., 2012). Pelargonidin-3-glucosid is an unstable pigment and this can lead to a rapid fruit color loss (Cash & Sistrunk, 1970). Surface browning can develop during shelf-life due to anthocyanin degradation and oxidation of soluble phenolic compounds, possibly caused by an increase in polyphenol oxidase activity as a result of water loss (Nunes et al., 2005).
According to Collins and Perkins-Veazie (1993) after 15 days of storage, independent of the temperature, the Chroma and the hue angle of fruit decrease from 30 to 25 and 21° to 13°, respectively, indicating loss of brightness and color shift from orange-red to red.
The calyx color darkens over time regardless of storage temperature and browning may occur in the crown of the calyx at the point of pedicel attachment (Collins & Perkins-Veazie, 1993).
16
Firmness
Firmness is an important attribute to consumers when assessing fruit freshness (Péneau et al., 2007). Firmness of strawberry is not only important for their eating quality but also for their shipping ability. Soft fruit cannot be shipped over long distances without substantial losses due to physical injuries (Chandra et al., 2015).
Strawberries tend to soften when exposed to fluctuating temperatures during handling (Nunes & Emond, 1999) and when transferred from low to higher storage temperature (Luoto, 1984). Under a fluctuating temperature regime strawberry fruit become softer throughout most of the handling process indicating the advanced senescence of the fruit (Lai, 2010).
According to Nunes and Emond (1999) strawberry firmness decreases during storage, regardless of the temperature. Exposure to higher temperatures during storage may be the cause of greater softness (Collins and Perkins-Veazie, 2003). Fruit can become unacceptably soft after 2 days at 20 °C (Nunes, 2008). Firmness measured by deformation test decreases during shelf-life, at a higher rate at 21 °C than at 1 or 6 °C; the instrumental differences in firmness are perceived by a sensory panel (Lai, 2010). However, Shin et al. (2007) reported that the firmness of strawberries stored at 0.5, 10 and 20 °C increased over time, an observation that the authors attributed to an increase in pectin viscosity (the gelling behavior).
Soluble solids content (SSC)
The sugar content at harvest depends on the cultivar and growing conditions (Wang and Camp 2000). Strawberries harvested at early stages of color development have lower sugar content and the sugar levels do not change after harvest to make them suitable for fresh consumption (Kalt et al., 1993). Changes in the soluble solids content of strawberries during storage depends on temperature and initial ripeness (Nunes, 2008).
The postharvest evolution of SSC is not linearly related with temperature and depend on factors other than storage time and temperature. SSC of strawberries stored at 0, 5, and 10 °C were steady until day 5 but decreased drastically afterwards (Ayala-Zavala et al., 2004). Lai (2010) reported that soluble solids content of strawberries stored at different temperatures decreased regardless of the temperature and that the decrease in SSC was significantly faster in strawberries stored at 21 °C then in fruit stored at 1°C. However, according to Nunes et al. (2006), some strawberry varieties showed an increase SSC when stored for 8 days at 1°C leading to an increase of 9%.
17 Shin et al. (2007) reported an increase in strawberry SSC stored at 0 °C but measured reductions in SSC of fruits stored at 10 and 20 °C; this decrease reached 6.3% on the third day of storage.
Titratable acidity (TA)
Several studies show that changes in strawberry acidity depend upon fruit maturity at harvest and storage temperature (Nunes, 2008). The TA of fruits harvested at three-quarters color decrease during storage at 1 °C reaching the same acidity as fruits harvested at the full-red stage (Nunes et al., 2006).
TA tends to decreased regardless on the storage temperature with fruits stored at 10, 15 and 21 °C showing a faster and higher reduction then those stored at 0 and 5 °C (Lai, 2010). However, Colling and Perkins-Veazie (1993) reported that total acidity of strawberries when stored at 1 and 5 °C did not changed significantly. These lack of changes in acidity during storage has also been observed by Cordenunsi et al. (2003) and Ayala-Zavala et al. (2004).
Decay development
Although physicochemical characteristics play a large role in the consumer acceptance and quality evaluation of strawberry, decay is a major concern for supply chain operators and the main cause of postharvest losses.
Botrytis and Rhizopus rot are the greatest cause of postharvest losses (Mitcham et al., 1996; Mitcham, 2014). While Rhizopus rot, caused by Rhizopus stolonifer, can be controlled by temperature since the fungus does not grow under 5 °C, Botrytis cinerea can grow even at 0 °C causing large postharvest losses (Mitcham et al., 1996). Botrytis cinerea can infect the fruit before harvest, remaining as a latent infection, inoculate wounds during harvest or colonize the fruit after harvest by contact with diseased fruit, a process called nesting (Nunes et al., 2012; Mitcham, 2014).
Botrytis cinerea can remain quiescent infection in immature strawberry fruits and only develop
when the fruits become ripe (Jerch et al., 1989). Immature strawberries are more resistant to fungal attack than ripe ones (Jerch et al., 1989; Nunes et al., 2012); therefore, fruit harvested with a white tip show a lower rate of mold development regardless of the storage temperature. Disease incidence and severity increase with inoculation and higher storage temperature (Nunes et al., 2012).
18 Storage temperature has a strong effect on decay incidence and development. Takeda et al. (1990) reported more than 35% of affected fruits after 2 days storage at 18 °C. Decay development becomes faster and more severe as the temperature increases above 1 °C (Lai, 2010). Sommer at al. (1973) observed a high incidence of mold development in fruits stored without refrigeration, increased in wounded fruits, contrasting with fruits stored at 0 °C in which no lesion development was observed. Fruits stored at 10 and 20 °C showed an increasing decay incidence with higher relative humidity as storage temperature increased (Shin et al., 2007).
Prevention of mechanical injuries to the fruit is paramount to control postharvest decay. Wounded strawberries are more susceptible to fungal development that can later spread the disease to nearby heathy fruit. It is essential at harvest to avoid placing damaged fruits in the trays and during transport prevent vibration damages of the fruits (Mitcham et al., 1996).
19
Material and methods
Part I – Temperature throughout the supply chain logistic circuits
Part II – Temperature effects on strawberry quality and self-life
20 This thesis contains two experimental sections that will be described separately. Section I addresses the actual temperatures in the strawberry supply chain, from farm to the final selling point and household refrigerator. Experiments in section II were performed under controlled conditions to assess the effect constant temperature at different values on quality changes of strawberry fruit.
Part I – Temperature throughout the supply chain logistic
circuits
Two logistic circuits were chosen to monitor fruit and air temperature from farm to retail outlet. The experiments were conducted in 9th June 2016 in a load of strawberries harvested in a farm
located in Santa Catarina, Caldas da Rainha and delivered to a retail store from a major distribution chain located in Amadora, and in 6th July 2016 in another load harvested at São
Teotónio, Odemira, and delivered to the same retail store.
Operations performed upon the fruit on the supply chain were described and the period between operations and steps in supply chains were registered. Fruit, package and air temperature was monitored in two circuits.
Strawberry packaging
Primary, secondary, and logistical packaging and unitization were the predominant in the supply chain of the retailer.
Strawberry used in these experiments were packed into vented 500 g lidded PET clamshells, the dominant primary package for strawberry in the Portuguese modern distribution in 2016. Primary packages were placed inside reusable polypropylene trays (400 × 600 mm) containing 10 primary packages as shown in figure 4.
The secondary packages were palletized onto an 800 × 1200 mm wood pallet to a high of 18 trays (fig. 4).
Temperature measurement in the strawberry load
Temperature was measured with Tinytag talk 2 dataloggers (Gemini data loggers, Chichester, West Sussex, UK). Model TK-4014 without a probe was used to measure air temperature and model TK-4023 containing a fruit probe used to measure temperature inside the fruit. Gemini
21 Tinytag talk 2 dataloggers have a resolution of 0.05 °C and were programmed to register the temperatures at 30-second intervals throughout the whole supply chain from the grower to the consumer household.
In each commercial circuit analyzed, the temperature was measured on tree clamshells inside CHEP boxes of one expedition unit with the following distribution:
One datalogger to measure the air temperature;
One datalogger to measure the air temperature inside the clamshell; Two dataloggers to measure the temperature inside the fruits.
The clamshells with the dataloggers were located in the top, the middle and the bottom of the palette (fig. 4).
Figure 4 - Expedition unit with the location of the dataloggers.
The dataloggers were placed in the load at harvest and collected at the consumer household. The data were transferred from the datalogger to a computer using the Tinytag Explorer 4.9 software interface (Gemini, UK) and used for subsequent analyses.
The accumulated time-temperature (ATT) was calculated for each stage by multiplying the average temperature by the duration of the stage and adding all the partial results along the supply chain.
Temperature measurement in car trunks and domestic refrigerators
The air temperature was recorded in trunks of five private vehicles and five domestic refrigerators in Lisbon between June 30th and July 4th, 2016. The vehicles were all dark in color:
(1) Toyota Yaris 2015; (2) Audi A4 2014; (3) Renault Megane Break 2007; (4) Citroen C5 Tourer 2009; (5) Skoda Octavia Break 2012.
Legend:
Strawberry clamshell (20x12 cm) CHEP box (60x40 cm)
22 The domestic refrigerators analyzed were: (1) Balay (with no further data); (2) AEG Electrolux C6 18 40 4i class: A +; (3) Bosch KGD36VI30 class: A ++; (4) AEG Electrolux Santo N81840-4i class: A; (5) Hoover HDCF 184 X / 1, class: A +.
The temperatures were measured continuously at intervals of 1 minute with registers Tinytag Talk 2, TK-4014 (Gemini data loggers, Chichester, West Sussex, UK). The dataloggers were placed inside the trunks with free movement and in the front of the bottom shelf, on the door opening side of the refrigerator.
Part II – Temperature effects on strawberry quality and
self-life
Fruit material and storage conditions
Strawberry (Fragaria × ananassa ‘Portolas’) fruit were harvested in April at the full red color stage. The fruit were packed into 500 g vented clamshells, forced air-cooled to 7.5 °C and transported to the laboratory in refrigerated temperature.
Each clamshell was weight and then placed in walk-in rooms set at five different storage temperatures:0, 5, 10, 15, and 20°C. Actual storage air temperature and relative humidity, were monitored throughout the trials and found to be 1 ± 1 °C, 90 ± 2 %; 5 ± 2 °C, 90 ± 2 %; 10 ± 1 °C, 85 ± 5 %; 14 ± 1 °C, 90 ± 3 %; 20 ± 2 °C, 90 ± 3 % for 0, 5, 10, 15 and 20 °C, respectively.
The experiment was repeated in July 2016 with ‘Candonga’ strawberry handled as described.
Sampling schedule
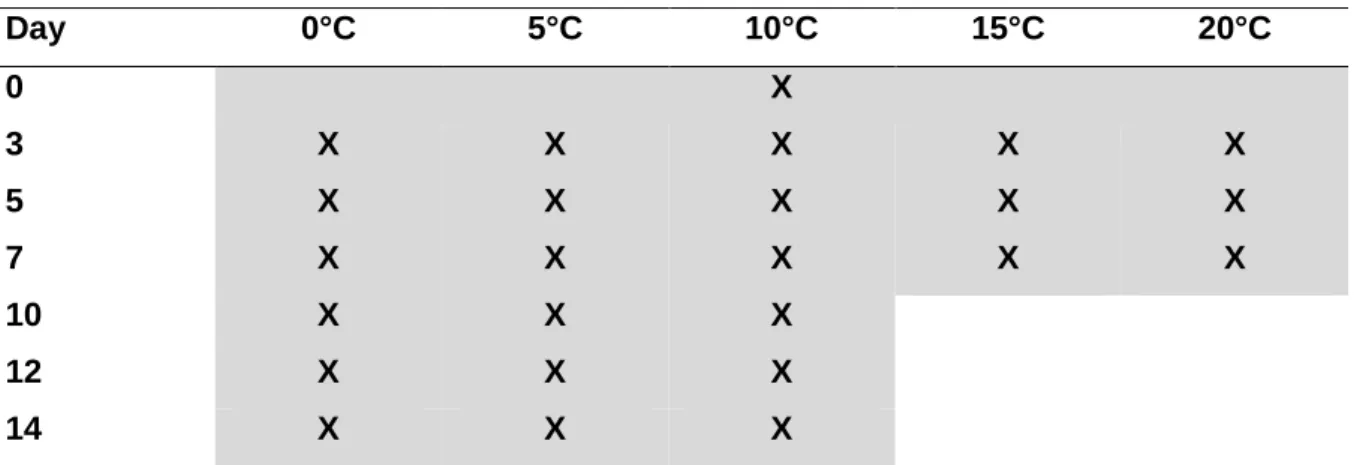
Before the beginning of the temperature trials (day 0) five clamshells of strawberries were analyzed to characterize the initial conditions of the fruit. Five clamshells of strawberries per temperature treatment were analyzed on days 3, 5, 7, 10, 12 and 14 for 0, 5 and 10°C and on days 3, 5 and 7 for 15 and 20°C (table 2).
23 Table 2 - Map of samples testing days.
Day 0°C 5°C 10°C 15°C 20°C 0 X 3 X X X X X 5 X X X X X 7 X X X X X 10 X X X 12 X X X 14 X X X
Fruit analyses during shelf-life
Strawberry quality was accessed during shelf-life under each storage conditions based on the following dependent variables: Weight loss; fruit surface color; calyx color; firmness; soluble solid content, and titratable acidity.
Analyses were performed 5 fruit in each of 5 clamshells until the development of rot or mold rendered the unit unsuitable for the experiment, at which time it was discarded.
Weight loss
Individual clamshells were weighted in an accuracy balance (Kern PFB 2000 - 2, Kern & Sohn GmbH, Germany) with 0.01 g precision. replicated measurements were made at each sampling time. The weight loss was calculated using Equation 1 and expressed as percentage of the initial fresh weight.
𝑊𝑒𝑖𝑔ℎ𝑡 𝑙𝑜𝑠𝑠 =𝑊𝑖−𝑊𝑡
𝑊𝑖 ×100 [Eq. 1]
where Wi is initial weight and Wt weight at the testing day.
Fruit surface and calyx color
Five representative strawberries were selected from each clamshell and the calyx carefully separated from fruit. Fruit surface color was measured in the middle of equatorial region and the calyx color on the top of the sepals.
Color was measured in the CIELab color space (L*, a*, b*) with a tristimulus colorimeter (Chroma Meter CR-400, Konica Minolta, Japan) using the C illuminant and observer at 2 °.