Universidade Católica Portuguesa Master of Science in Economics
SUSTAINABILITY REPORTING AT THE PROJECT LEVEL
by
Tiago Santos
Dissertation submitted in partial fulfillment of the requirements for the degree of MSc in Economics, at the Universidade Católica Portuguesa, June 30th, 2011
Abstract
Currently, sustainability is a core strategic priority of business management. Despite the recent global economic crisis, businesses‟ commitment to sustainability has grown in past years. Businesses increasingly measure and communicate the sustainability performance of the whole organization, in a common practice referred to as sustainability reporting. However, businesses feel challenged when trying to quantify and analyze their sustainability performance. This difficulty businesses face is further hampered by a lack benchmarks for the practice of sustainability reporting.
This paper addresses these lacunas by proposing a sustainability reporting approach that focuses on the level of project activity instead of the whole organization. Data regarding 15 consulting projects of a professional services firm is sourced for the application of business intelligence methodologies. This project-level approach allows the construction of a sustainability analysis and reporting system with added perspectives on sustainable performance. Results reflect the environmental and social dimensions of sustainability in those 15 projects and enable the quantification of sustainable performance and progress. This paper also shows that, although inherent problems regarding the finding of relevant data subsist, internal benchmarking is feasible. Furthermore, results point to the possibility of establishing industry-wide benchmarks, for the broad class of service-providing firms whose activity is similar to the one of the analyzed firm.
TABLE OF CONTENTS
1. INTRODUCTION ... 1 2. LITERATURE REVIEW ... 3 3. METHODOLOGY ... 7 3.1. Indicators ... 7 3.2. Models Definition ... 93.3. Data Sources and Integration ... 15
3.3.1. Data Sources ... 16
3.3.2. Data Integration: Extract, Transform and Load (ETL) ... 16
3.4. Data Storage and Analysis ... 19
3.5. Sustainability Dashboard and Reporting ... 21
4. RESULTS ANALYSIS ... 23
5. CONCLUSIONS... 25
6. FUTURE WORK ... 27
REFERENCES ... 29
1. INTRODUCTION
The widespread public attention and debate over sustainability has been significantly growing in recent years (Berns et al. (2009)). Businesses have responded accordingly, as sustainability concerns increasingly influence management practices and translate into brand-building, efficiency and even financial gains. As such, companies attempt to follow the philosophy of “what gets measured gets managed” and assess the progress of their sustainability programs.
Traditionally, sustainability reports focus on the level of the whole organization. According to KPMG (2011), “there is a growing demand for the design of systems, processes, controls and governance frameworks that can properly measure and analyze sustainability metrics”. Despite the development of standards like the Global Reporting Initiative (GRI) for sustainability reporting (GRI (2011)) and the Greenhouse Gas Protocol (GHG Protocol) for greenhouse gas emissions reporting (GHG Protocol (2011)), companies still struggle to gauge, measure, analyze and benchmark their advancement towards sustainable goals (The Economist (2008), KPMG (2011)). Identifying and measuring financial benefits of the sustainable business paradigm is still a hurdle (Haanes et al. (2010)).
To address these issues, we propose a sustainability assessment and reporting system based on consulting projects, the most granular level of the activity of professional service corporations. Our project-level approach will allow for measurement and multidimensional analysis of sustainability. In contrast to the approaches described in current scientific papers and company reports (Nordheim, E. and Barasso, G. (2007), Deloitte (2010)), our methodology will enable further transparency and benchmarking of sustainability within both project and organizational management. Additionally, the general activity profile of professional service corporations provides a solid standpoint to extend our sustainability framework to a wide range of other firms and industries with similar activity profiles, hence why we choose them as basis. Although we will evaluate the sustainability performance of the professional services firm we studied, the core objective of this paper is to rather focus on the development of the sustainability reporting system itself. A detailed breakdown of the underlying causes and effects of sustainability practices implemented by the firm we studied is not the aim of this paper.
To achieve this paper‟s goals, we put business intelligence methodologies to use. In doing so, we transform the project‟s activity data, stored as hours per employee involved in a given project, in sustainability indicators and measures. We start by identifying relevant environmental and social indicators of sustainability within the company. Then, we develop models to transform the source activity data of the projects into those indicators and to enable the multidimensional storage and analysis of those same indicators.
The results enable us to quantitatively discuss and benchmark the sustainability performance of the source projects, within the context of the professional services company we studied and its specific structure and modus operandi. Results also quantify consequences of management decisions that specifically address sustainability of the business in some way. Furthermore, we identify how such a sustainability reporting model could be further developed in course of future research.
This paper is structured as follows. We start by reviewing existing literature. Then, we proceed to define the several sustainability indicators, as well as the models that calculate them and put them into their dimensional context. Subsequently, we detail the process that transforms the source data into the underlying framework that serves as basis for data analysis and reporting. In the chapters that follow, we discuss data storage and analysis and our reporting solution. We then analyze results, summarize and conclude the paper and identify future lines of work.
2. LITERATURE REVIEW
The sustainability reporting challenge begins with agreeing on the very definition of sustainability. When trying to define sustainability, scientific papers and reports propose or at least recognize the existence of a context-sensitive working definition, as is the case with Maclaren (1996) or The Economist (2008). Part of the difficulty in pinning down a general definition comes from the vast number of industries the sustainable development concept is being applied to. These areas range from sustainability in the tourism industry as studied by Choi and Sirakaya (2006) to sustainability in the aluminum industry as researched by Nordheim and Barasso (2007). Despite there being no universally agreed upon definition of sustainability, the very influential paper by Brundtland (1987) defined sustainable development as “development which meets the needs of the present without compromising the ability of future generations to meet their own needs”. Another commonly cited definition is the so-called “triple bottom line” or “triple impact” (Elkington (1998)). Notable papers which cite the “triple bottom line” definition include, but are not limited to, Dyllick and Hockerts (2002), Norman and MacDonald (2004) and Bansal (2005). According to Elkington (1998), “the triple bottom line agenda focuses corporations not just on the economic value that they add, but also on the environmental and social value that they add – or destroy”.
These two fundamental definitions form the basis of the sustainability program of organizations. What is also common to corporate organizations across sectors is the awareness of sustainability issues and of their potential impacts to financial performance (e.g. The Economist (2008), Berns et al. (2009) and Haanes et al. (2010)). The authors point out that, despite the adverse global economic setting, companies show an increased financial and strategic commitment to sustainability. Main drivers behind this tendency are brand building, risk management and competitiveness on costs and innovation, according to the papers listed above. However, companies still have difficulties in sustainability measurement and reporting, as they struggle to quantify the value of certain sustainability strategies.
What is sustainability reporting and what are its advantages for organizations? Organizations measure and communicate their impact on the economy, environment and society as well as their performance in regards to sustainable development in general in a framework referred to as “sustainability reporting”. Székely and Knirsch (2005) and the G3.1 Guidelines (2011)
indicate that the main drivers behind sustainability reporting are the identification of financial benefits and the fulfillment of stakeholder information and transparency demands, as well as brand reputation and ethical considerations. According to KPMG (2008), sustainability reporting is the norm nowadays, as “nearly 80 percent of the largest 250 companies worldwide issued reports, up from about 50 percent in 2005”.
Nevertheless, as mentioned before, a problem of sustainability reporting is the definition of indicators and how to measure sustainability or progress towards a more sustainable business environment (KPMG (2008) and Haanes et al. (2010)). To counteract this issue, multiple reporting standards were developed. We review the most prominent of them below.
The Global Reporting Initiative (GRI) is the organization that took the lead in developing a sustainability reporting framework. GRI aims to mainstream and standardize the disclosure on and evaluation and measurement of environmental, social and governance performance of organizations (GRI (2011)). Over 1800 sustainability reports following the GRI framework were published in 2010, a 22% increase from the previous year (GRI (2010)). As an integral part of sustainability reporting, the GRI sustainability reporting framework encompasses the identification of greenhouse gas emissions. To calculate greenhouse gas emissions, GRI directs readers of their guidelines (G3.1 Guidelines (2011)) to the Greenhouse Gas Protocol Initiative. The Greenhouse Gas Protocol Initiative is a globally used accounting framework and tool for governments and businesses to assess, quantify and manage greenhouse gas emissions (GHG Protocol (2011)). Over 1000 businesses and organizations worldwide developed their GHG inventories using the GHG Protocol. In 2008, the majority of Fortune 500 companies based their assessment of investment-related risks and opportunities related to climate change on GHG Protocol‟s framework, as surveyed by the Carbon Disclosure Project (GHG Protocol (2011)). The Carbon Disclosure Project is another such global organization which holds the largest database of primary corporate climate change information in the world. The Carbon Disclosure Project collaborates with GRI and GHG Protocol so that companies can measure and disclose their greenhouse gas emissions, water use and climate change strategies (CDP (2011)). The United Nations Global Compact (UNGC) also provides a framework for developing, implementing, disclosing and sharing sustainability policies and practices (UN Global Compact (2011)). The UNGC is a strategic policy initiative for businesses which commit to align their operations with ten universal principals of human rights, labor, environment and anti-corruption (UN Global Compact (2011)). The UNGC is
globally overarching and counts over 8000 participants from over 130 countries. Like the UNGC, the World Business Council for Sustainable Development (WBCSD) aims to provide a platform of developing and sharing experiences and best practices of sustainable development, though focusing exclusively on advocating business and sustainable development. The WBCSD is a CEO-led, global association of some 200 companies from more than 30 countries and 20 major industrial sectors and benefits from a global network of some 60 national and regional business councils and regional partners (WBCSD (2011)). These standards are broadly used by organizations around the globe as fundamental frameworks for sustainability reporting, for measuring and reporting greenhouse gas emissions and for benchmarking purposes.
Despite these efforts to standardize sustainability reporting, corporate entities have not yet fully realized the quantitative sustainability appraisal and benchmarking benefits a standardized definition and approach of sustainability reporting could bring. Székely and Knirsch (2005) assert that the benchmarking potential of the GRI standard is limited due to differences from company to company in the range and scope of what is measured and how. Although all standards have evolved since 2005, KPMG (2011) adds that companies still find it challenging to generate relevant data and benchmarks. For the firms wishing to benchmark their sustainability performance within their respective industries, KPMG (2011) recommends that firms should review their industries‟ metrics as published by the WBCSD or share relevant data and best practices through their industries‟ bodies. This, again, hints at the need of standardized benchmarking practices.
Furthermore, there is businesses‟ necessity to measure sustainability, a necessity which we try to cover in our sustainability framework. This need is at the core of the papers of Azapagic (2004) and Choi and Sirakaya (2006). These papers resort to the GRI standard to develop their own industry-specific framework of indicators in order to better measure and analyze sustainable performance in the mining and minerals and tourism sectors, respectively.
A more recent example from the corporate world is that of SAP AG, a global software corporation. The company made use of the GRI G3 reporting framework indicators (SAP AG (2009)). In doing so, SAP AG adapted several of those indicators to better reflect its sustainability performance in the context of the high tech industry. For instance, SAP AG compiled the so-called Business Health Culture Index, an indicator that reflects stress and
engagement level of employees, instead of tracking injury and disease rates. The company used this index for example to measure the accident rate per 1 million hours worked (SAP AG (2010)). We note that this adaptation of existing standards and indicators is an approach which we will borrow in our paper.
We finally review our approach against a paper by Keeble et al. (2003), whose objective includes analyzing sustainability at the project level. Keeble et al. (2003) stress the importance of combining organization specific sustainability indicators with general indicators to more accurately reflect the values and business environment of the organization. They present an analysis tool for establishing sustainability indicators at the corporate and project level, the latter for the benefit of aligning project planning with principles of sustainable development and for increasing project stakeholders‟ awareness of sustainability issues.
While the approach by Keeble et al. (2003) focuses on the process of choosing indicators and on outlining a qualitative based sustainability appraisal of a project, we set out to quantitatively model and measure sustainability of consulting projects in particular. We draw knowledge from the business intelligence field to address the measuring of sustainability, the generation of relevant data and the benchmarking problems of sustainability reporting we listed above. Our approach also entails choosing and tailoring appropriate GRI based indicators and may assist sustainable project management and goal setting, like Keeble et al. (2003)‟s. In contrast to Keeble et al. (2003), however, it enables additional transparence through multidimensional analysis of project sustainability, within a framework general enough to be applied to other types of organization within the services sector.
3. METHODOLOGY
This paper presents a framework to assess and analyze sustainability of professional service projects, to objectively model and measure their environmental and social impacts. To achieve that, we rely on methodologies from the business intelligence field to identify, extract, analyze, benchmark and report relevant data about 15 professional service projects. This paper will follow the classical Hub and Spoke architecture (Wortmann F. (2010c)), where data is firstly populated (i.e. sourced). Then, the source data is transformed and loaded into a database. Finally, data is analyzed and prepared for reporting.
Here lies a core focus of this paper: to prepare an underlying framework that allows for thorough and quantitative sustainability analysis. The process of creating a multidimensional data model for the granular project data is the foundation which enabled us to perform such sustainability analyses and benchmarks. The main purpose of this paper is to develop a sustainability reporting and assessment framework. However, we will also conduct such an assessment based on the developed framework for exemplary purposes.
To develop the sustainability reporting and assessment framework we conduct the following main steps: first comes the groundwork of identifying key performance indicators. Then, the development of the models for the environmental, social impacts and database models for posterior data storage and analysis follows. Next, relevant data sources are identified and collected. The phases of integration and subsequent data storage and analysis are presented in chapters 3.3.2 and 3.4, respectively. Finally, the results of our study are presented and discussed.
3.1. Indicators
The sustainability indicators and models that translate the reality of the activity of professional service projects into a sustainability assessment that encompasses the environmental and social fronts form the underlying, fundamental theoretical construct. The first step to build these constructs is the identification of indicators relevant to sustainable performance. Defining the data model, whose primary function is to determine how data
relates to each other and is organized and stored within a database, follows. We then proceed to develop the models for resource consumptions, employee travels, CO2 emissions and social
impacts that transform the source data into the indicators we considered.
Identifying what are the relevant indicators with respect to the environmental and social dimensions is the first key step to assess sustainable performance of a project. Using SAP AG (2009) and the GRI Index from G3.1 Guidelines (2011) as guidelines, we firstly answer the “What is it that we want to measure?” question. In this paper, we consider the environmental and social impacts of a project‟s activity for defining relevant indicators.
The activity of a professional services project typically consists of employees working on a computer, in an illuminated and air-conditioned office. In the course of their daily activities, employees consume water and utilize paper for various purposes. To get to their offices (or the project client‟s offices), employees use public or private means of transportation. Thus, under the rubric of environment, we inventory energy, paper and water consumption indicators as well as transportation indicators.
The energy consumption indicators we list are components of the G3.1 Guidelines (2011) EN3 indicator (direct energy consumption of the organization) and the EN4 indicator (indirect energy consumption of the organization). These components include electricity consumption as well as the heating (and cooling) energy consumption. For instance, Nestlé (2008) and SAP (2010) report on those components and aggregate them to the EN3 and EN4 GRI indicators, using internal data from their buildings‟ energy consumptions. Since such detailed data is not available, we assume that projects‟ energy consumption resulted through computer use,
illumination and heating and cooling of the office. These 3 energy consumptions form our 3
energy indicators, which are given in kilowatts hour.
We abide by G3.1 Guidelines (2011) once more to define a set of transportation indicators. These indicators are used to represent employees‟ trips to and from the client. There is one indicator for distance covered, in kilometers, per transport type.
The water consumption indicator is represented in liters whereas paper use is tallied by the number of sheets used.
Indicators used to measure social impacts should include, inter alia, employment practices, labor/management relations, occupational health and safety and training and education, according to G3.1 Guidelines (2011). As G3.1 Guidelines (2011) suggest, we implement organization-specific indicators to more accurately reflect the consulting projects praxis. We implement employees‟ daily extra hours as a social indicator to model employees‟ stress levels, analogously to SAP AG (2009)‟s Business Health Culture Index. To measure training and education, the internal indicators PABs per year and employees‟ training hours per
year are set up. While the latter is self-explanatory, the former is an acronym that is internal
to the professional services firm that is subject of this paper. A PAB is the process of a staff employee receiving feedback from management levels concerning his performance in a certain project. These can happen multiple times throughout a year. Measuring PABs per staff employee should therefore serve as another indicator of training and education.
Below, in table 1, we present an overview of the environmental and social indicators.
Table 1 here
3.2. Models Definition
In this chapter, we discuss the models we developed. We firstly define our multidimensional data model, which will determine how data will be stored for later sustainability analysis. Secondly, we describe the consumption models. These models establish how the project‟s activity data is transformed into several environmental resource consumption indicators. The modeling approach to estimate employees‟ travels is described next. Then, a description of the CO2 models follows, to detail how the CO2 equivalents of the resource consumptions were
calculated. Lastly, we explain our social model.
A database is the “collection of persistent data including its description (metadata)” (Wortmann 2010a). The data model is the theoretical construct which determines how data, from various sources, is stored, organized and can be manipulated in a database. In this paper, we implemented a multidimensional data model, which is a multidimensional structure to organize data and express the relationships between said data.
A multidimensional model consists, in general, of “measures, which represent business figures, dimensions (e.g. time, geography), which provide different “perspectives” on measures and facts, which put measures into their dimensional context”, as defined by Wortmann (2010b). The term hypercube, or simply data cube, is used to describe the structure that originates when facts can be scrutinized according to n dimensions.
As general guidance to design our multidimensional data model, we resort to Kimball R. and Ross M. (2002). In our multidimensional model, two data cubes were defined. The first cube contains the multidimensional structure with environmental facts. The second cube incorporates an analogous multidimensional structure with social facts. The measures – which define the environmental and social facts of our model – are the several indicators we listed above. Establishing the dimensions is an essential stage of our sustainability assessment, for these theoretical constructs are enablers of the diverse analysis possibilities of sustainability.
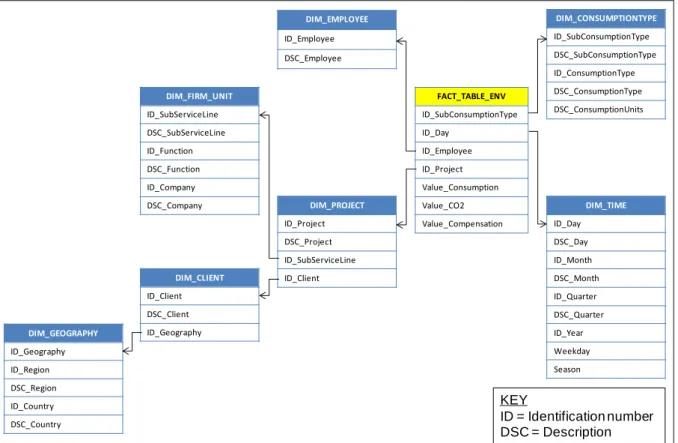
Below, in figure 1, is an overview of the cube for the environmental facts. In figure 1, the dimensions we consider and the connections between them and to the environmental fact table itself are depicted. Each dimension represents an analysis and aggregation possibility of the several indicators. In our approach, we make use of employee, firm subservice line,
project, client, geography, time and consumption type dimensions. The dimensions firm subservice line, geography, time and consumption type follow a hierarchical structure. For
example, days aggregate to months and months to years in the time dimension; several subservice lines group into a function in the firm subservice line dimension. The dimension
consumption type comprehends the several resource consumption and transportation
indicators. The internal structure of the professional services firm we analyze is reflected in the firm subservice line dimension. The content of the project, client, geography and time dimensions dispenses further explanations. In figure 1, the dimensions are highlighted in blue and the fact table is marked in yellow.
Figure 1 here
An exemplification of an environmental fact follows in figure 2.
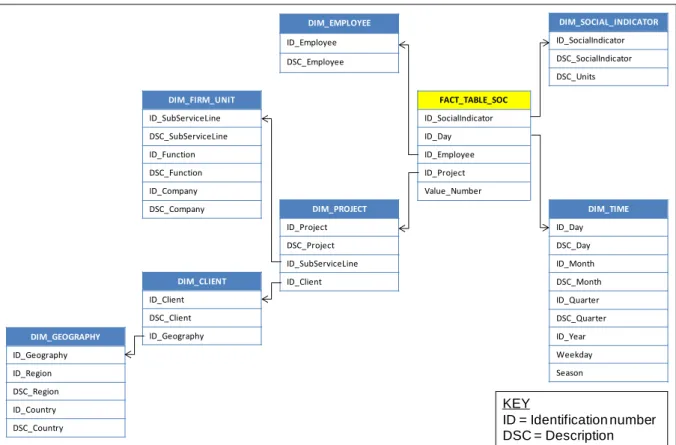
Figure 3 depicts the cube that contains the social facts. This cube‟s scheme is analogous to the previous one, differing solely in the fact table‟s measures and corresponding link to the social
indicator dimension, where details of the social measures are stored.
Figure 3 here
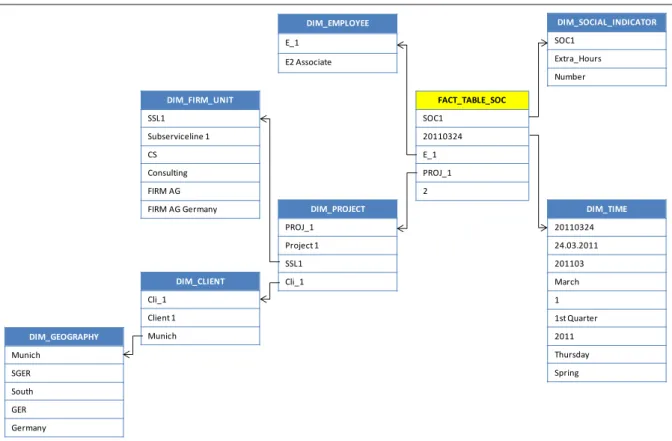
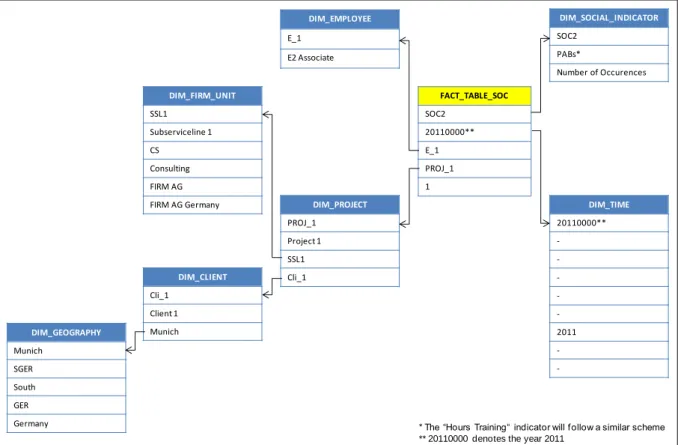
Note in figure 4 a social fact example. Figure 5 exemplifies the different data relations the social indicators PABs and training hours indicators imply.
Figures 4 and 5 here
Due to the unavailability of precise information from employees regarding employees‟ daily consumptions of each type of resource that we considered as indicators, the consumption
models have to be developed on basis of specific assumptions. These models are developed to
obtain estimates on those resource consumption values. The following paragraphs dissect those models and assumptions by indicator.
The consumption of energy through the use of a computer, in watts hour, ensues from two different types of laptops which are awarded to employees depending on their seniority within the company. We assume that all associates, the least senior employee rank among the ones we collected data from, use the “Dell Latitude D630” and all others the “Lenovo 2522AC1” laptops. This is not always the case as some associates use the “Lenovo 2522AC1”, but those are the exceptions and not the rule, and this assumption follows our general underestimation assumption, seeing as the “Lenovo 2522AC1” laptops consume on average 49 watts per hour while the “Dell Latitude D630” laptops consume on average 39 watts per hour. To obtain these values, we compare the hardware specifications of these two laptops with the ones listed by University of Pennsylvania Information Systems and Computing (2011).
To model the energy consumed in the heating and cooling of the workspace environment, we source two estimates. For the heating energy estimate, an average of heating energy consumed per square meter per year in Germany is used. The second estimate we source regards the average wattage consumed per hour by average cooling equipment for the cooling energy. We combine these two estimates by dividing the year into seasons and assume that the heating consumption would be double the average in winter, average during fall and
spring and zero in summer. A similar reasoning guides the cooling energy consumption model. We assume zero cooling energy consumption during winter, half of the average during fall and spring and average during summer, due to the average value we have for the cooling energy not referring to the year as a whole. We define winter as the period from December 22nd to March 21st, spring as the period from March 22nd to June 21st, summer as the period from June 22nd to September 21nd and fall as the period from September 22nd to December 21st. For each season, heating and cooling values are broken down by day and not further broken down into hours, unlike all other indicators. We assumed this due to offices‟ cooling and/or heating equipments running 24 hours per day in general, to maintain temperature at comfortable levels at all times. The estimates we use for the heating and cooling values are Wirtschaftskammer Österreich (2003), Energiesparen im Haushalt (2007) and internal available data. These estimates amount to 100 kilowatts hour per year per square meter for the heating energy and 1 kilowatt hour per day for the cooling energy. From these source values, the average values of 2739.726, 200 and 1469.863 Watts per hour per employee are derived for climatisation indicators for the Winter, Summer and Spring/Fall seasons, again basing on available data.
Available data indicates a lighting consumption of 42.4 watts per hour per capita.
An empirical observation and data gathering is carried out for the paper and water consumptions. We estimate daily water consumption at 5 liters of water per day. This value is derived from the empirical observation of a minimum 1 liter of drinking water consumed plus one bathroom trip (4 liters of water) per employee per day. The value for the water consumption through bathroom trips is sourced from The ABCs of Toilets (2011). The value of 5 sheets of paper used per day per employee results from direct empirical observation of paper consumption in a project office. Due to the nature of how these estimates are created, results‟ analysis of these two indicators will serve an indicative purpose only.
Table 2 presents an overview of the energy, paper and water indicators and the consumption values we associated with each of them.
Table 2 here
Employee travels will populate the fact table with transportation indicators. Employees are
to the employees‟ exact home addresses not being available for obvious privacy reasons, employees‟ daily trips to the clients‟ offices are assumed to start from the firm‟s offices that are nearest to the clients‟. Should there be no firm offices in the client‟s town or within 50 kilometers of the same, then we assume that employees‟ daily commuting trips would originate in the center of the client‟s town. This assumption is based on the study by Kloas, J. and Kuhfeld, H. (2003), where results showed that more than 95% of daily commutes in Germany do not exceed 50 kilometers.
Additionally, it is common that projects in a certain town employ human resources from various others. This phenomenon causes affected employees – the so called “Wochenendheimfahrer” in German, or weekend commuter in English – to return to their home towns on the weekends. We model these weekend commutes by stipulating that employees‟ home towns are the ones of the firm‟s office they are associated with. Let us look at an example. Consider an employee which is associated with a firm office which is not the one closest to the client or that is more than 50 kilometers away. On any given Friday, we will suppose this employee will have a morning trip from the firm‟s office that is closest to the client (or from the client town‟s center) and an after-work trip from the client to the firm‟s office he is associated with. The analogous will happen on the subsequent Monday.
We assume employees‟ means of transportation for daily commuting trips, i.e. trips shorter than 50 kilometers, are a 50/50 mix of bus and metro, given that we possess no data on employees‟ transportation means of choice and commuting habits and that those are commonly used public means of transportation. For those weekly trips that are longer than 50 kilometers but shorter than 483 kilometers we assume the train was used, due to an agreement between the professional services firm we studied and the domestic railway company. This agreement will be detailed later on. For trips between 483 kilometers and 1126 kilometers, we assume a short haul flight was made, and did not consider weekly trips that were any longer than that. The reason for these seemingly arbitrary numeric boundaries for associating distances with a transport type will be explained later on.
For those specific cases where an employee declared working on several different projects in the same day, as is the general case with employees at the upper management levels, we model their several daily trips as being from the firm‟s office (or town center) to the client‟s office without considering trips between the several clients. Justification of this approach is
that on the one hand, we cannot know which trips they actually undertake or where they actually work from (as e.g. it can often be the case that the manager worked from a firm‟s office on the different clients‟ projects) but on the other, we do want to model, to some extent, the business trips to several clients managers usually have to make and the resulting carbon footprint.
An overview of the transportation indicators and the distances they are associated with is presented in table 3.
Table 3 here
The CO2 model enables, through the use of so-called emission factors, the calculation of the
CO2 emissions that results from certain consumption of resources. Sources of CO2 emissions
are, in our model, energy and paper consumption and transportation. Most emission factors we used are sourced from World Resources Institute (2008) and from SAP AG (2009)‟s internal portal, the latter due to its application of some Germany-specific emission factors.
The emission factor for all employee train trips is zero due to an agreement of the firm we studied with the domestic railway company, where the firm assured that energy used by the railway company‟s trains in its employees travels is generated from renewable, non-CO2
emitting sources.
As far as the modeling of the CO2 emissions generated by all trips longer than 50 kilometers
is concerned, the emission factors the World Resources Institute (2008) provides for airplane travel are grouped into domestic, short or long haul trips. A domestic flight is any flight where the distance flown is shorter than 300 miles or 483 kilometers. Short haul is associated with any distances in the 300 to 700 miles, or 483 to 1126 kilometers, range. Finally, long haul airplane trips are trips where more than 700 miles or 1126 kilometers were flown. As mentioned before, we assume employees used the train for any distances smaller than 483 kilometers due to the agreement with the domestic railway company. For distances greater than 483 kilometers, the emission factor for the short haul airplane trip is used. The seemingly arbitrary limits we noted in the previous chapter are thusly justified. The emission factor for paper consumption is derived from John Heinz III Center for Science, Economics, and the
Environment (2006) and Environmental Energy Technologies Division (2010). Water is not associated with CO2 emissions. Table 4 summarizes the CO2 conversion factors we used.
Table 4 here
For reference, we provide a CO2 compensation cost, given by the market price of the CO2 ton
in Euros as indicated by Ecoprogresso (2011) of 16.8€/ton CO2.
The description of the social impacts model ensues. Modeling the extra hours per employee follows a very simple algorithm, where, in each day that an employee declares having worked x hours in a certain project with x strictly greater than 8, he would have worked a total of x-8 extra hours.
We obtained data regarding PABs and training hours per employee. For the roughly 80% of the cases where data regarding the PABs per employee indicator is not available, if an employee declares more than 80 hours on a project, then he is assumed to have had a PAB. If the project's duration is greater or equal than a year, then he is assumed to have had 2. This assumption relies on internal sources and common practices. No model is developed for missing training hours per employee data, since training hours per employee truly and greatly vary from employee to employee.
Table 5 provides an overview of the three social impacts indicators and their respective units.
Table 5 here
3.3. Data Sources and Integration
In this chapter we discuss and present the actual procedure of gathering source data and preparing it so that our models can be applied, our fact and dimension tables populated and, later on, the resulting data stored in our database.
3.3.1. Data Sources
A fundamental data source was one Excel file containing data about 15 consulting projects associated with the Munich office of the professional services firm we studied. This Excel file originated from the firm‟s internal SAP system. Furthermore, that file contains the projects‟ associated service lines as well as client addresses. The other fundamental data sources are 15 separate Excel files, one per project, where the days and hours worked by each employee as well as their associated offices are detailed. All those 15 files follow an equal structure, which is naturally advantageous to streamline data integration. All data of our database is either directly derived from these sources, the firm‟s internal portal or defined by us, in a process we will clarify in the following chapter.
3.3.2. Data Integration: Extract, Transform and Load (ETL)
In this chapter we will present the dataflow processes that extract, transform and load the source data into the database. To elaborate this data transformation step, methodologies are sourced from Kimball R. and Ross M. (2002), Ariyachandra T. and Watson H. (2005) and Wortmann F. (2010c).
The extraction of the data is a phase of the dataflow process where the source data is gathered from sources outside the process, e.g. from the Excel file with the 15 projects‟ information. The transformation of the extracted data, which is the core process that adapts it to our future reporting needs, follows, and, finally, data is loaded in our sustainability database.
The tools we use to technically design and implement the ETL process are a combination of the Microsoft Office Access and Excel applications. We leverage the data manipulation properties of Access SQL, a computer language for querying databases, and of Excel functions and VBA, a computer language present within Office applications, where necessary.
Before beginning with the ETL process, the data sources are subject to preliminary data quality analysis and tests. Data quality is a term that comprises data‟s consistency, correctness, completeness, exactness, reliability, understandability and relevancy properties, as listed by Wortmann F. (2010c). As such, when examining our data sources, we find multiple instances of data quality issues, most notably regarding consistency, correctness and
completeness. The most prominent example thereof was specifically in the individual project files. There, employees submitted two different data entries for working in the same project in the same day, when there should have been only one. To exemplify, if employee x declares he worked 4 hours in project y in day z and 4 hours in (the same) project y in (the same) day z in two separate data submissions then he should have simply declared 8 hours in project y in day z. These data quality problems (among others) we identify have to be corrected, for example by combining and aggregating those wrongly separate data records of the same employee into an unique one. This process is referred to as “data cleansing” and follows the identification of data quality issues.
We define one ETL dataflow process per dimension and per indicator. There are ETL dataflow processes where the only transformation step involved is rendering the anonymity of the source data and there were many others, which we explain in the following paragraphs, where more advanced data manipulation, demanding several more steps, is required.
Those transformation processes which only required rendering the data source anonymous are the ones of the client, employee and project dimensions. This is a requirement for upholding not only the firm‟s privacy regarding sensitive data but also the clients‟. It involves characterizing all employees, projects and clients as employee 1, employee 2, …, project 1, project 2, … and client 1, client 2, …, respectively, instead of using each one‟s respective real names. We also conceal selected information, such as employees‟ associated offices and exact specification of clients‟ addresses, to protect their identities.
The dimensions time, consumptiontype, socialindicator and FIRM_unit are not derived from the data sources, as we define them as Excel tables instead. We refer to the firm‟s internal portal to depict the firm‟s internal structure and hierarchy in an Excel table. A similar procedure is implemented for the geography dimension, as the clients‟ exact addresses are concealed and only their respective cities considered. The firm‟s internal portal is used as a reference to assign each of those cities to a German region as internally defined by the firm.
Almost all environmental indicators which are not related to transportation are the result of a linear transformation either of the hours or of the workday declared by each employee in each project‟s Excel file. Thus, the transformation process for energy, paper and water
certain project in a certain day by a set factor, respective to the several indicators and the consumption models associated with them. The exception is the climatisation indicator, where the linear transformation it consists of relies on employees‟ declared workdays instead of hours, due to the modeling approach we chose for this particular indicator. For the paper consumption indicator, only integer amounts of paper use are considered, so results are rounded up.
The extraction and transformation process for the transportation indicators merits a more detailed breakdown of the numerous iterations involved. To compute employees‟ daily commuting distances, we refer to both employees‟ and the clients‟ exact office addresses. The next step is to calculate distances between the origin and destination pairs. For this task, we rely upon the Google Directions API (2011), where API stands for Application Programming Interface, to calculate relevant distances. This service Google offers enables a user that provides an origin and a destination point to obtain distances between them and driving directions. The advantage of using this API is its potential to accept automated user input and also automatically return calculated distances. This is invaluably helpful in avoiding the potential burden of having to manually type hundreds of addresses in a web service like Google Maps and saving distances between them. We store the origin and destination addresses in an Excel sheet and write a VBA routine that accepts 2 addresses as input, generates a valid URL for a Google Directions API call and saves the distance, between the two addresses the API outputs. We provide the commented VBA source code in the following code snippet:
Code Snippet 1 here
The result of this round of Google Directions API calls are the distances of the weekend commutes since, according to our employee travel model, daily commuting distances should not be greater than 50 kilometers. For the cases where the employees‟ associated offices are located more than 50 kilometers away from the clients‟ offices, the firm‟s office of the client‟s town is identified. As described in the employee travels model, the center of the client‟s town is used as the origin of the commute in the absence of a firm‟s office in the client‟s town. These new origin addresses, together with the clients‟ addresses like before, form new pairs of addresses and the distances between them are calculated via another round of Google Directions API calls. Therefore, we then had all the daily and weekly commuting
distances we needed. These distances are then associated with the several transport indicators in the manner we defined in the employee travels model chapter.
Having thus calculated consumption values for all environmental indicators, we then proceed to apply the respective emission factors given by World Resources Institute (2008) and SAP AG (2009), to compute the associated CO2 footprint where applicable. The CO2
compensation cost calculation follows, using the market value of a CO2 ton Ecoprogresso
(2011) provided.
The separate extraction and transformation processes for the social indicators ensues. To derive the extra hours indicator, the simple linear transformation of subtracting, by 8, the employees‟ declared hours for a certain day and project is carried out. For the PABs indicator, a source file with data regarding PABs and training hours per employee is combined with the model we outlined in the social models chapter. The training hours indicator results from direct extraction from said source file.
Finally, to complete the ETL, all the extracted and transformed dimensions and indicators are sequentially loaded into our sustainability database in Access, through direct importation of Excel tables into the Access database and/or via a simple SQL query to append data records. The resulting Access database can be found among the files we submitted with this paper.
Below, Figure 6 presents not only an overview of the ETL process for the indicators, but also the data analysis and reporting processes we will discuss in the next chapters. The dimensions which are not depicted are either rendered anonymous and loaded or simply created from scratch and then loaded, as previously pointed out in this chapter.
Figure 6 here
3.4. Data Storage and Analysis
For the files mentioned in this chapter, refer to the Technical Appendix section of the Appendix.
The data storage and analysis step follows the ETL (Wortmann F. (2010c)). Besides providing the dimensions and fact tables in a database file, we construct two cubes, one for the environmental facts and the other for the social ones, for the purpose of data analysis. Since we store our two cubes and primarily conduct our data analysis in Excel, the database‟s dimensions and facts which compose the cubes have to be prepared in such a way that would allow us to better realize Excel‟s data analysis potential and tools. To that effect, all the dimensions are linked with the facts in the way we conceptualized and exemplified in the data model chapter, by using the two following SQL queries for the environmental and social cubes respectively:
Code Snippet 2 and 3 here
The resulting cubes are loaded into two separate Excel files. The two separate data cubes are then copied into one Excel worksheet in our reporting and dashboard files which will be discussed next. Although this can be misleading due to differences between the
consumptiontype and socialindicator dimensions, this step effectively enables the connection
of the two cubes and their simultaneous analysis. Thus, a project can be analyzed with respect to its environmental and social facts at the same time.
Our data analysis then consists of standard multidimensional cube analysis. We perform aggregations, rotations (switching of dimensions), slices (reducing of dimensions) and dices (selecting subsets of data) of the data cubes over combinations of the various dimensions and indicators (Wortmann (2010b)).
The numerous results of our evaluations can be found in the reports we made available. These allow us to understand how to better present, communicate, compare and benchmark the data, and to derive indicators, from the ones we already have, to better serve those same purposes. This is the fundamental basis that supports the two data visualization options we propose in the following chapter.
3.5. Sustainability Dashboard and Reporting
In our report files, we divide our reporting solution into two worksheets, a management summary with an overview and a detailed analysis and a project dashboard. The goal is to prepare exemplary reports that would cater to different informational needs. The project manager‟s informational needs naturally focus on the project level. A higher management level might be interested in reports that take the organization as a whole (or a subset of the latter) into account (Wortmann F. (2010c)).
In general, the reasoning behind the evaluations and graphics we present is that we attempt to showcase all relevant dimensional analysis possibilities, with comprehensible, easy to communicate indicators.
Figures 7, 8 and 10 depict selected screenshots of the reports we prepared.
Figures 7, 8 and 9 here
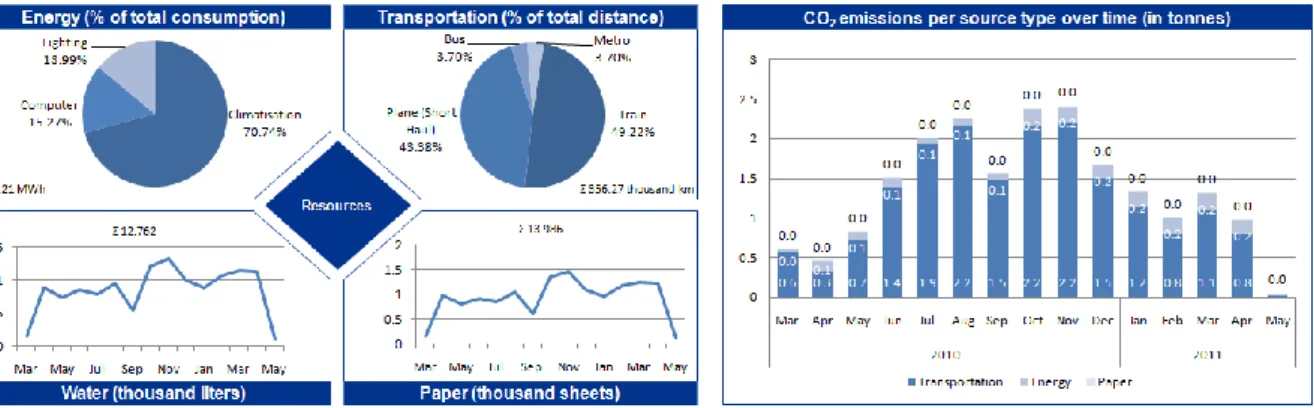
The objective of preparing the information for the different (management) levels within a company explains why we implemented a more aggregated, general and summarized overview of the sustainability evaluation in the first part of the static management summary report. In the detailed analysis part of the management summary report, we try to exhibit the what, how, where, when and why of both environmental and social resource drains and to answer those questions in a graphical way, subject to the specific dimension under examination.
We chose the dashboard format to report on the project level due to the dashboard‟s interactivity. This interactivity allows a user to choose one of the 15 projects, benchmark and compare them with each other or all others over all indicators. We consider The Dashboard Spy (2011) and Excelcharts (2011) as sources for the creation of our dashboard. We depict indicators based upon the ones already stored in the database, such as extra hours per employee per month. The purpose thereof is to ensure comparability between projects on the environmental and social fronts, despite considerable differences in their fundamental characteristics such as total duration or number of employees. The benchmark of the projects ensues also through comparisons with average, minimum and maximum value references, over the time dimension too.
4. RESULTS ANALYSIS
In this chapter, we will highlight selected results our sustainability system reported.
Starting with the overview in the management summary, we firstly see how are the transportation and energy indicators distributed by subtype, or, for the water and paper consumption indicators, how they develop over time. Comparing our energy consumption model with Wirtschaftskammer Österreich (2003)‟s assessment, which points to an energy consumption that is equally split between heating and electricity, we recognize that the weight our model puts on energy consumption through climatisation is perhaps too high.
As far as the transportation indicators are concerned, we deem the following result interesting. Our models imply that metro and bus are used on a daily basis by every employee and that not every project or employee is associated with weekly trips with train or airplane. Nonetheless, the latter group of transport indicators represents the overwhelming majority of the total distance traveled. This result reflects the overall weight that deploying human resources not locally has. Thus, from the sustainability point of view, this conclusion supports the importance of GRI‟s focus on sustainability indicators which reflect the use of resources in the organization‟s local areas (G3.1 Guidelines (2011)).
The social performance summary shows that the staff employees of these 15 projects are getting feedback in accordance to the firm‟s internal guidelines we described in the social model chapter, as staff employees have had on average at least one PAB in the 15 months in scope. We do not have such guidelines for the evaluation of the results regarding the “extra hours” and “training hours” indicators. Further interesting conclusions to be drawn from this graphical depiction could be derived from framing it in the kind of contextual analysis for which we do not possess data, such as a comparison with homologous periods or between other professional services firms.
The detailed analysis graphic of CO2 emissions per employee type yields the counter-intuitive
result that staff employees emit a lot more CO2 than managers. This is a direct result not only
of the lack of data and the model‟s particularities we already detailed but also of an extra degree of missing data. Firstly, managers declare significantly fewer daily hours than
employees per project, since they allocate their daily schedules to several projects, which can quite possibly not be one of the 15 projects we have data of. This missing data causes their energy and paper consumptions and therefore CO2 emissions to be naturally lower than they
really ought to. Furthermore, besides our assumptions regarding managers‟ travels, source data referring to business trips which cannot be attributed to an ongoing project was not available.
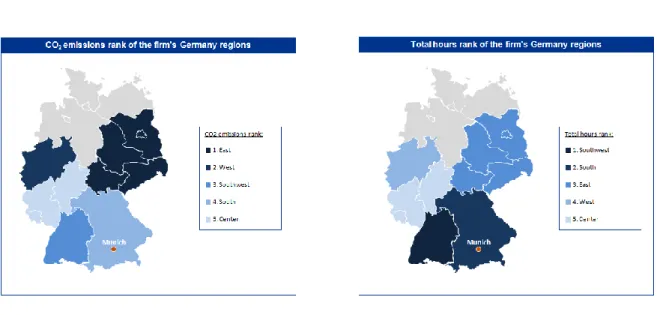
We base ourselves again on the knowledge that most employees are associated with the firm‟s office in Munich to illustrate, in the graphics of Germany‟s regions, the weight employee travels have on the CO2 footprint. The regions that cause the highest CO2 footprint are not the
ones where the highest amount of activity, as measured by the total hours worked in a region, is.
The significantly positive effects for the environment brought on by the firm‟s agreement with the domestic railway company are made clear with the side-by-side comparison of the pie with the breakdown by transportation indicators with the pie with the breakdown by CO2
emission sources. Close to 50% of the distance the employees covered does not imply any CO2 emissions. This results in hefty savings both in CO2 emissions as well as the respective
compensation sums.
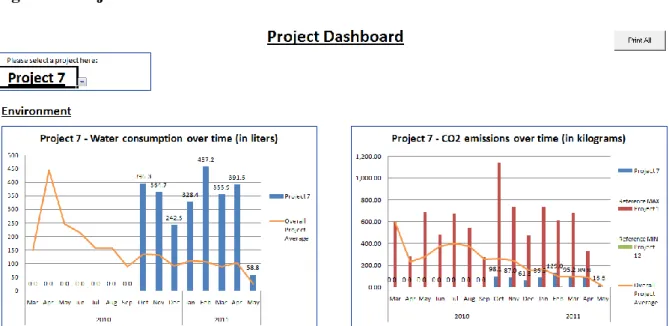
The project dashboard is a helpful tool to assist in analyzing the finer detail of the overview we presented in the management summary. Each project‟s profile varies greatly and with it its use of both human and natural resources too. We will focus on project 7 for exemplary purposes.
In October 2010, project 7 jumpstarted, since water consumption is remarkably higher than the average for the period project 7 comprises. Despite that, that clear sign of activity does not translate into high CO2 emissions, since project 7 has caused a lot less emissions than project
1, the worst offender, and mostly below average emissions, as illustrated by the “Project 7 – CO2 emissions over time” graphic. Looking at the total distance graphic, one can recognize
that the train is the transportation means of choice for about 83% of all distance traveled in the context of project 7. Due to the agreement with the domestic railway company, this implies a moderate carbon footprint due to transportation sources, as we can see in the “Project 7 – Total CO2 emissions by source subtype” graphic.
5. CONCLUSIONS
This paper studies the modeling, measuring, analysis and reporting of sustainability in the service providing sector. Consulting projects are used to construct a sustainability assessment framework that allows for multidimensional quantitative analysis and reporting and that can adapt to specific characteristics of a service providing company but is, at the same time, abstract enough to be applied to other organizations, of the services sector, whose activity profile is similar to the one we considered.
We started by identifying key sustainability performance indicators relevant to KPMG, like Keeble et al. (2003) suggested and SAP (2009) and SAP (2010) implemented. We then developed data and resource consumption models and applied business intelligence methodologies to integrate, analyze and report on the environmental and social indicators we derived from source data about the consulting projects‟ activity.
The results we achieved reflect a sustainability perspective on 15 consulting projects and allow for benchmarks of the same. While conducting in-depth analyses of sustainable performance are not the core objective of this paper, we show exemplary evaluations and reflections on sustainability. Most notably, the reported results reflect, from different perspectives, the environmental weight employee transportation has, quantified savings from a CO2 reduction policy and measured employee management and engagement from the
sustainability viewpoint.
The results we report upon also show that staff members represent the bulk of the resources consumed, distance traveled, CO2 emissions caused and extra hours worked and 100% of
PABs undertaken and training hours completed. This is a result of missing data regarding management‟s hours and travels as we have discussed, and, as a consequence thereof, models that are adjusted to staff employees rather than management employees. The lack of available information regarding office‟s real or standard lighting and climatisation values also leads to room for improvement in the lighting and climatisation indicators‟ accuracy. The analogous statement for the water and paper consumption indicators holds, as noted before.
Thus, as The Economist (2008) and KPMG (2011) pointed out, this difficulty regarding data we faced is shared by most companies that took part in those two studies, as the “creating or
finding reliable internal data” challenge was reported to be either “major” or “moderate” by the majority of them.
However, we argue that, firstly, our sustainability reporting system taps the measuring and analysis of sustainability problem The Economist (2008) and KPMG (2011) identified. We are able to quantify savings from a CO2-emissions reducing policy and analyze sustainable
development over a number of relevant dimensions.
Secondly, we address the benchmarking problem as well. Due to our using of data that is commonly available to professional service providing firms in general – as is the case of the allocated hours per project Excel worksheets we sourced – this same sustainability assessment system we propose could be applied to projects from other similar organizations. The project-related activity, involving consultants commuting to a lit-up, heated or cooled office and working with a laptop, is similar among such service providing organizations. Hence, natural and human resource consumption indicators should be equal and the respective models comparable. The results should then be comparable; not only within a company, but among several within the industry. The multidimensional sustainability assessments and benchmarks we propose should therefore be feasible for a wider group of consulting projects – one that includes industry peers too.
These evaluations and conclusions help us identify lines of future work on the models and our sustainability assessment. We discuss those improvement possibilities, and others, in the chapter below.
6. FUTURE WORK
The first improvement potential we identify relates to the consumption and employee travel models themselves. Contrary to the one we chose, the modeling approach of including managers‟ travels to and from the various clients they declare working on in a certain day can be included to try to bridge the gap between managements‟ modeled and real activity. If possible, data regarding all employees‟ travels expenses can be used to model their business trips and means of transport of choice. Another possibility is to use data from internal employee surveys, such that we could attribute numerical weight to their qualitative assessments (if needed) and thereby derive such measures of stress levels. These measures can then be integrated into our sustainability reporting solution. Information regarding employees‟ commuting and water and paper consumption habits can be asked in those surveys too. That information can also be sourced to ameliorate our models. The estimations of the energy consumption through lighting and heating and cooling of offices can also be improved through the collection of further information from the client‟s offices. Naturally, with more data, the reflection of many other GRI indicators is possible, including governance and economical ones.
The economical dimension of the triple bottom line is completely missing from this paper, due to the required data to carry out such an analysis being confidential. Naturally, the multidimensional examination of economical and financial data would also be valuable in understanding the sustainability of the whole business, especially since we start from such a granular level as the project level.
The predictive analysis function of business intelligence is notably absent but could also be derived from the construct we already designed. We briefly describe how the implementation of this function could look like. Firstly, a user could input data from a future project, such as duration, number of full time equivalent employees, location and whatever else information is available to him. Then, through the modeling of unavailable data whenever necessary and comparison of said input data with the one we already have, he would obtain an estimate of the environmental and social burden such a project would carry. What-if scenario analysis, for example of what would be if employees chose to drive an automobile in their daily commutes instead of using public transportation like we assume, would also be possible through this
function. The predictive analysis purpose of business intelligence methodologies would thus be filled, and allow for more sustainable project planning, development and management.
In general, with more available data, the possibility of implementing other business intelligence functions that assist specific processes of management opens up. With more data, the design of balanced scorecards, which are aids to strategic management, becomes possible. The same holds for the implementation of key performance indicators, which are measurements of current progress against set goals.
REFERENCES
Ariyachandra T. and Watson H. (2005), „Data Warehouse Architectures: Factors in the Selection Decision and the Success of the Architectures‟. [Online] Available at
http://www.terry.uga.edu/~hwatson/DW_Architecture_Report.pdf [Accessed 30 June 2011].
Azapagic, A. (2004), „Developing a framework for sustainable development indicators for the mining and minerals industry‟, Journal of Cleaner Production 12, 639 – 662
Bansal, P. (2005), „Evolving sustainably: a longitudinal study of corporate sustainable development‟, Strategic Management Journal 26, 197 – 218
Berns, M., Townend, A., Khayat, Z., Balagopal, B., Reeves, M., Hopkins, M., & Kruschwitz, N. (2009), „The business of sustainability: Findings and insights from the first annual business of sustainability survey and the global thought leaders‟ research project‟. [Online] Available at http://sloanreview.mit.edu/special-report/the-business-of-sustainability/ [Accessed 21 May 2011].
Brundtland, G. H. (1987), „Our Common Future: Report of the World Commission on Environment and Development‟, Oxford: Oxford University Press, 43
Choi, HS. C. and Sirakaya, E. (2006), „Sustainability indicators for managing community tourism‟, Tourism Management 27, 1274 – 1289
CDP (2010), „Carbon Disclosure Project: What we do – overview‟. [Online] Available at
https://www.cdproject.net/en-US/WhatWeDo/Pages/overview.aspx [Accessed 27 June 2011]. Deloitte (2010), „Deloitte 2010 Corporate Responsibility Report: Vision, values,
responsibility‟. [Online] Available at
http://www.deloitte.com/assets/Dcom-Global/Local%20Assets/Documents/About/dttl_cr_2010_crreport_221210.pdf [Accessed 29 June 2011].
Dyllick T. and Hockerts, K. (2002), „Beyond the business case for corporate sustainability‟, Business Strategy and the Environment 11, 130–141
Energiesparen im Haushalt (2007), „Durchschnittlicher Gasverbrauch‟ (English: average gas consumption). [Online] Available at http://www.energiesparen-im-haushalt.de/energie/bauen-
und-modernisieren/modernisierung-haus/heizung-modernisieren/heizungsanlage-erneuern/gasheizung-erneuern/durchschnittlicher-gasverbrauch.html [Accessed 09 April 2011].
Ecoprogresso (2011), „Preço da t CO2‟. [Online] Available at http://ecoprogresso.pt/
[Accessed 13 May 2011].
Elkington, J. (1998), „Partnerships from cannibals with forks: The triple bottom line of 21st‐century business‟, Environmental Quality Management 8, 37 – 51
Environmental Energy Technologies Division (2010), „Useful Facts about Copy Paper‟. [Online] Available at http://eetd.lbl.gov/paper/ideas/html/copyfactsA.htm [Accessed 12 June 2011].
Excelcharts (2011), „Data Visualization‟. [Online] Available at
http://www.excelcharts.com/blog/data-visualization/ [Accessed 30 June 2011]. G3.1 Guidelines (2011), „Sustainability Reporting Guidelines‟. [Online] Available at
http://www.globalreporting.org/ReportingFramework/ReportingFrameworkDownloads/
[Accessed 21 May 2011].
GHG Protocol (2011), „About the GHG Protocol‟. [Online] Available at
http://www.ghgprotocol.org/about-ghgp [Accessed 27 June 2011].
Google Directions API (2011), „The Google Directions API‟. [Online] Available at
http://code.google.com/apis/maps/documentation/directions/ [Accessed 15 June 2011]. GRI (2010), „GRI Sustainability Reporting Statistics: Publication year 2010‟. [Online] Available at http://www.globalreporting.org/NR/rdonlyres/954C01F1-9439-468F-B8C2-B85F67560FA1/0/GRIReportingStats.pdf [Accessed 27 June 2011].
GRI (2011), „What is GRI?„. [Online] Available at
http://www.globalreporting.org/AboutGRI/WhatIsGRI/ [Accessed 27 June 2011].
Haanes, K., Kong, M. T., Hopkins, M. S., Arthur, D., Reeves, M., Kruschwitz, N., Balagopal, B. and Velken, I. (2010), „Sustainability: The „Embracers‟ Seize Advantage‟. [Online]
Available at http://sloanreview.mit.edu/feature/sustainability-advantage/ [Accessed 21 May 2011].
John Heinz III Center for Science, Economics, and the Environment (2006), „Following The Paper Trail, The Impact of Magazine and Dimensional Lumber Production on Greenhouse Gas Emissions: A Case Study.‟. [Online] Available at
http://www.heinzctr.org/publications/PDF/08014_Time_1to51.pdf and
http://www.heinzctr.org/publications/PDF/08014_Time_52to102.pdf [Accessed 12 June 2011].
Keeble , J. J., Topiol, S. and Berkeley, S. (2003), „Using Indicators to Measure Sustainability Performance at a Corporate and Project Level‟, Journal of Business Ethics 44, 149 – 153
Kimball R. and Ross M. (2002), „The Data Warehouse Toolkit: The Complete Guide to Dimensional Modeling‟ 2nd
Edition, Wiley Computer Publishing.
Kloas, J. and Kuhfeld, H. (2003), „Aktuelle Ergebnisse zum Verkehrsverhalten privater Haushalte‟, DIW-Wochenbericht 42/2003, 624 – 629
KPMG (2008), „KPMG International Survey of Corporate Responsibility Reporting 2008‟. [Online] Available at
http://www.kpmg.com/Global/en/IssuesAndInsights/ArticlesPublications/Pages/Sustainability -corporate-responsibility-reporting-2008.aspx [Accessed 21 May 2011].
KPMG (2011), „Corporate Sustainability: A progress report‟. [Online] Available at
http://www.kpmg.com/Global/en/IssuesAndInsights/ArticlesPublications/Pages/corporate-sustainability.aspx [Accessed 21 May 2011].
Maclaren, Virginia W. (1996), „Urban Sustainability Reporting‟, Journal of the American Planning Association, 62: 2, 184 – 202
Nestlé (2008), „Relatório de sustentabilidade 08‟. [Online] Available at
http://www.bcsdportugal.org/nestle-2008/1051.htm [Accessed 29 June 2011].
Nordheim, E. and Barasso, G. (2007), „Sustainable development indicators of the European aluminium industry‟, Journal of Cleaner Production 15, 275 – 279