M
ASTER OF
S
CIENCE IN
C
ORPORATE
S
CIENCES
M
ASTERS
F
INAL
W
ORK
D
ISSERTATION
U
SING THE
A
PPRAISAL
T
HEORY TO
A
NALYZE
O
NLINE
R
ESTAURANT
R
EVIEWS IN THE
L
ISBON
R
EGION
A
NDRÉ
C
ORREIA
A
MADO
L
AUREL
M
ASTER OF
S
CIENCE IN
C
ORPORATE
S
CIENCES
M
ASTERS
F
INAL
W
ORK
D
ISSERTATION
U
SING THE
A
PPRAISAL
T
HEORY TO
A
NALYZE
O
NLINE
R
ESTAURANT
R
EVIEWS IN THE
L
ISBON
R
EGION
A
NDRÉ
C
ORREIA
A
MADO
L
AUREL
S
UPERVISORS:
P
ROFESSORAD
OUTORAC
RISTIANED
REBESP
EDRONP
ROFESSORD
OUTORM
ARCIRIOS
ILVEIRAC
HAVESAgradecimentos
Gostaria de agradecer aos meus orientadores, Cristiane Drebes Pedron e Marcirio Silveira Chaves, por todo o seu apoio na execução e conclusão desta dissertação. A sua dedicação, transmissão de conhecimentos, competência, compromisso, disponibilidade, motivação e rigor científico foram essenciais para levar a bom porto este trabalho. Aos meus Pais, aos meus irmãos e à minha tia Josette por todo o apoio, disponibilidade e incentivo para que tudo corresse da melhor forma.
Aos meus colegas e amigos por toda a ajuda e apoio que me deram durante realização deste trabalho. Aos restantes Professores pelos conhecimentos transmitidos e constante motivação intelectual.
Agradeço também a todos aqueles que não estão aqui mencionados mas que de alguma forma, direta ou indiretamente, estiveram envolvidos na execução desta dissertação.
Dedicatória
Este trabalho é dedicado aos meus Pais, aos meus irmãos, António e David, à minha avó Esperança e às minhas tias, Zizi e Josette, por estarem sempre do meu lado e por serem a minha constante fonte de inspiração. Dedico também à Margarida e a todos os meus amigos por partilharem comigo tantos dos momentos que levarei sempre para a vida.
Abstract
User-generated content on Web 2.0 touristic websites can be important both for clients and companies of the sector. In the present work it were analyzed 503 online reviews, divided into 2769 sentence segments, from 22 restaurants in the Lisbon region, during the summer period 2012, on Tripadvisor.com. Resorting to an exploratory approach, the objective of this work is to identify the presence of attitude (affect, appreciation and judgement), in accordance with the Appraisal Theory. As well as verify the most mentioned attributes and polarity in each segment. Inter-rater agreement between two other evaluators was also checked, for attitude.
The results obtained indicate that the dominant attitude is appreciation with positive polarity. Judgement is usually present when the service and Staff are mentioned, while affect is not often cited in this sample. This indicates that users tend to be more objective and less emotional on their restaurant’s evaluation. The most mentioned attributes were “Quality of Food”, “Staff and Communication” and “Price”, the majority of these had also positive polarity, which indicates that even in times of economic contention, “Quality of Food” should be the main focus. The inter-rater agreement was satisfactory. It is also concluded that user-generated content can be useful for managers to better understand the motivations, necessities and expectations of their clients and, in that way, focus their communication campaigns, products and services in order to answer these issues.
Keywords: Web 2.0, Social Media, User-generated content, content analysis, polarity,
restaurant management, customer satisfaction, Appraisal Theory, attitude, inter-rater agreement.
Resumo
A informação gerada pelos utilizadores em sítios turísticos da Web 2.0 pode ser potencialmente importante tanto para clientes como para as empresas do sector. Neste trabalho foram analisados 503 comentários online, posteriormente divididos em 2769 segmentos de frase, provenientes do site Tripadisor.com referentes a 22 restaurantes da região de Lisboa, durante o período de Verão de 2012.
O objetivo do trabalho passou por, recorrendo a uma abordagem exploratória, identificar os tipos de atitude presente (afeto, apreciação e julgamento), de acordo com a Teoria da Avaliação. Assim como, verificar os tipos de atributos mais mencionados e a polaridade em cada segmento. Aferiu-se ainda a concordância da avaliação de atitude, recorrendo a dois avaliadores externos.
Os resultados obtidos indicam que a atitude dominante é a apreciação com polaridade positiva. Julgamento é mencionado geralmente quando se aborda o serviço e o Staff, enquanto afeto foi pouco citado nesta amostra. Isto indica que os utilizadores tendem a ser mais objetivos e menos emocionais nas suas avaliações a restaurantes. Os atributos mais mencionados são “Qualidade da Comida”, “Staff e Comunicação” e “Preço”, todos com maioritariamente avaliação positiva, o que demonstra que mesmo em tempos de contenção a “Qualidade da Comida” deve continuar a ser a principal aposta. A concordância obtida foi satisfatória. Conclui-se ainda que a análise detalhada de comentários pode ser útil para que os gestores compreendam melhor as motivações, necessidades e expectativas dos seus clientes e dessa forma orientem as suas campanhas de comunicação e os seus produtos e serviços de forma a dar-lhes resposta.
Palavras-Chave: Web 2.0, Social Media, User-generated content, análise de conteúdo,
polaridade, gestão de restaurantes, satisfação do consumidor, Teoria da Avaliação, atitude, inter-rater agreement.
Acronym List
UGC – User-generated Content RSS – Rich Site Summary WOM – Word of Mouth
eWOM – Electronic Word of Mouth
R/S/I – Recommendation, Suggestion and Intention N/A – Not Applicable
Index
1. Introduction 1
2. Literature Review 3
2.1. Web 2.0, User-generated Content (UGC) and Electronic Word-of-Mouth
(eWOM) 3
2.1.1. Web 2.0 3
2.1.2. User-generated Content (UGC) and Electronic Word-of-Mouth (eWOM) 5 2.2. Attributes in the Restaurant Business 8
2.3. Appraisal Theory and Polarity 11
2.4. Recommendation, Suggestion, Intention (R/S/I) and Complaint 15
3. Methodology 16
4. Sample Characterization 20
5. Results Analysis 22
5.1. Attribute, Polarity and Attitude 26
5.2. Inter-rater Agreement 28
6. Discussion 30
7. Conclusion 33
Bibliography 36
Table Index
TABLE 1 – LIST OF ATTRIBUTES USED ERRO! MARCADOR NÃO DEFINIDO. TABLE 2 – PERCENTAGE OF REVIEWER TYPE ERRO! MARCADOR NÃO
DEFINIDO.
TABLE 3 – PERCENTAGE OF ATTRIBUTES FOUND ERRO! MARCADOR NÃO
DEFINIDO.
TABLE 4 – NUMBER AND PERCENTAGE OF SENTENCES WITH AT LEAST ONE ATTITUDE ERRO! MARCADOR NÃO DEFINIDO.
TABLE 5 – PERCENTAGE OF ATTITUDE PER ATTRIBUTES ERRO! MARCADOR NÃO DEFINIDO.
TABLE 6 – PERCENTAGE OF TYPE OF POLARITY PER ATTRIBUTE ERRO! MARCADOR NÃO DEFINIDO.
TABLE 7 – ATTITUDE PER TYPE OF POLARITY ERRO! MARCADOR NÃO DEFINIDO.
TABLE 8 – TYPE OF RATING PER TYPE OF POLARITY ERRO! MARCADOR NÃO DEFINIDO.
TABLE 9 – ATTITUDE PER TYPE OF POLARITY ON QUALITY OF FOOD ERRO!
MARCADOR NÃO DEFINIDO.
TABLE 10 - ATTITUDE PER TYPE OF POLARITY ON STAFF AND
COMMUNICATION ERRO! MARCADOR NÃO DEFINIDO.
TABLE 11 - ATTITUDE PER TYPE OF POLARITY ON PRICE ERRO! MARCADOR NÃO DEFINIDO.
TABLE 12 - ATTITUDE PER TYPE OF POLARITY ON ATMOSPHERE ERRO! MARCADOR NÃO DEFINIDO.
TABLE 13 - ATTITUDE PER TYPE OF POLARITY ON QUALITY OF SERVICE
ERRO! MARCADOR NÃO DEFINIDO.
TABLE 14 - ATTITUDE PER TYPE OF POLARITY ON VARIETY OF MENU
ERRO! MARCADOR NÃO DEFINIDO.
TABLE 15 - CLASSIFICATION OF TYPES OF ATTITUDE ACCORDING TO
RATERS A, B AND C ERRO! MARCADOR NÃO DEFINIDO.
TABLE 16 - CONFUSION MATRIX OF A AND B’S CLASSIFICATIONS ERRO! MARCADOR NÃO DEFINIDO.
TABLE 17 - CONFUSION MATRIX OF A AND C’S CLASSIFICATIONS ERRO! MARCADOR NÃO DEFINIDO.
TABLE 18 - CONFUSION MATRIX OF B AND C’S CLASSIFICATIONS ERRO! MARCADOR NÃO DEFINIDO.
1. Introduction
The Internet plays a very important role in today’s world and everyday life. Its widespread and the emergence of the so-called web 2.0 (O’Reilly, 2005) has allowed users to express their opinion and communicate with each other regardless of geographical and cultural boundaries. This has provided users with a database of opinions that can be accessible at a very low cost (Godes and Mayzlin, 2004).
Web 2.0 tools, such as social networks and blogs, often provide space for reviewers to express their opinions about products and services, therefore contributing with user-generated content (UGC). Godes and Mayzlin (2004) refer that online communities, where UGC is developed, can influence word of mouth and customers consumption decisions. Zhang et al. (2010) point out that UGC is usually better perceived by consumers than the content provided by the suppliers of the product or service themselves. In a study by Parra-López et al. (2011) social media played an important role in the planning of holidays and vacation trips.
Considering this, a number of studies on restaurant reviews (Soriano, 2002; Andaleeb and Caskey, 2007; Namkung and Jang, 2008; Ha and Jang, 2010; Jo and Oh, 2011; Haghighi et al. 2012) have focused on analyzing UGC at a more detailed level, such as the sentence level, in order to further understand and take advantage of what user reviews have to offer.
This work goes beyond other studies in the field, by applying the Appraisal Theory (Martin and White, 2005) to online restaurant reviews in the Lisbon area, and not
focusing only on the most mentioned aspects in reviews. This research can help to further understand the way customers express their opinions on online reviews platforms. This is important for comprehending if a reviewer gives a more personal and emotional testimonial, judges staff behaviour or gives his opinion in a more objective and appreciative way. It also helps to better understand the nature of the relation between customer and restaurant.
Managers can use the information on reviews to understand what do customers value the most, as well as their needs, expectations and evaluation of the meal provided. It can also help to understand the main reasons for restaurants success and failure. Clients may also benefit from online reviews by assessing what each restaurant has to offer, based on reviews from other clients, and therefore adjust their expectations and choose the restaurant that better serves their needs.
The present work has two main objectives. The first is to identify what attributes do customers value the most in a restaurant and how they classify them in terms of polarity. The second is to understand the kind of feelings and opinions that customers express in their reviews about the restaurant, by assessing attitude as classified by Martin and White (2005).
For this, it is intended to answer the following questions:
- What are the most mentioned attributes in the restaurant reviews and what is their polarity?
- What are the kinds of attitude expressed in online reviews?
This work is divided in five parts, beyond the introduction. First, it is introduced the theoretical contextualization of the work, explaining what are web 2.0, UGC and electronic word of mouth. That section also focuses on studies about attributes in the tourism and restaurant business, polarity and Appraisal Theory. Then, in the methodology section, it is shown how the data will be analysed. The following sections, sample characterisation and results analysis, describe the data collected and the results reached by crossing data. Interrater agreement is also approached in the results analysis section. In the discussion it is made a description of the main results, comparing them with results found in the literature as well as pointing out its implications for restaurant managers and clients. The last section concludes this study and points out the limitations and future researches.
2. Literature Review
This literature review is divided into four parts. The first explains the Web 2.0, UGC, Word of Mouth and Electronic Word of Mouth terms, and its application on the restaurant industry. The second part focuses on the specific attributes of the restaurant business. The third part refers to the Appraisal Theory and the issue of Polarity and its application in the present work. The fourth, and last, part is a brief approach to the terms Recommendation, Suggestion, Intention and Complain, relating them with the theme in question.
2.1. Web 2.0, User-generated Content (UGC) and Electronic Word-of-Mouth (eWOM)
2.1.1. Web 2.0
According to O’Reilly (2005), one of the creators of the term, Web 2.0 can be viewed as a set of principles, namely seven, that are adopted, to some extent, by certain
websites, instead of a static definition. The first principle is viewing the “Web as a Platform”. This means that the user considers not only his desktop, but the whole web as his universal platform for connecting and interacting with other individuals and organizations (Wijaia et al, 2011). The second one is related to “Harnessing Collective Intelligence”. Websites such as Wikipedia allow users to edit, write or rewrite and publish articles that themselves made, thus creating a pool of knowledge accessible to everyone (Baumann, 2006). This kind of interaction between provider and user, making them sometimes the same person, allows the websites to use the collective intelligence, or knowledge of the crowds of its users for its own benefit and enrichment (O’Reilly, 2005). The third principle states that “Data is the Next Intel Inside”. This means that data and knowledge, provided by the companies or its clients, are considered as core-competencies for Web 2.0 companies, thus becoming their central focus (Wijaia et al, 2011; O’Reilly, 2005). The fourth principle, “End of the Software Release Cycle”, reinforces the idea of constant interaction between providers and users of the service. With constant updates and changes the websites are in a state of constant improvement, instead of being delivered as an immutable product (Wijaia et al, 2011; O’Reilly, 2005). The “Lightweight Programming Models” principle is referring to the need for websites to simplify the way they are programmed in. This makes it able to use the information available on other websites, allowing it to be reused in an almost uncontrolled way (O’Reilly, 2005). The sixth principle, “Software above the Level of a Single Device”, means that software is being designed in a multi-platform way. It is not made only for PC’s, but to mobile devices as well, retaining the same level of quality in both of them (Wijaia et al, 2011). The seventh principle, “Rich User Experiences”, aims at making
the web browsers look more like regular desktop applications, thus making the experience more easy and simpler for the user (Wijaia et al, 2011; O’Reilly, 2005).
Therefore, Web 2.0 has a set of defining characteristics that sets it apart from, namely, Web 1.0. Such examples of these differences are: its socially-orientated focus, instead of system oriented, user instead of process defined and its collaborative focus, in opposition to personal orientation. Or, the ad hoc nature of the information creation and divulgation processes instead of being previously structured (Gould, 2009). The Web 2.0 also relies on series of new tools such as blogs, wikis, mashups, social networks, virtual worlds, folksonomies, crowdsourcing, podcasts and Rich Site Summary (RSS) filters (Andriole, 2010). These tools embody the principles above mentioned.
2.1.2. User-generated Content (UGC) and Electronic Word-of-Mouth (eWOM) The Web 2.0 can work as an important platform for firms to explore, in order to take benefits of the tools provided by it (Andriole, 2010). One of the characteristics of Web 2.0 is the possibility of creating UGC.
User-generated Content (also known as User-created Content, User-generated Data or Consumer-generated Media) has three defining characteristics, according to the OECD report on “Participative Web User-Created Content”. The first one is “Publication requirement”, which means that the information contained in the UGC must be accessible on a public or on a restrict access website, such as a social network page. The second one is related to “Creative effort”, meaning that the user must add its own content to the work, not limiting its action to copying content from another website or another author. This means that the work must be creative and original. The third and final one is linked with “Creation outside of professional routines and practises”. This
last dimension is related to the non-profit nature of UGC, making it something that a user creates beyond, and despite of, its professional activity and interest. The same report from OECD also states the four main drivers of UGC: “Technological drivers”, “Social drivers”, “Economic drivers” and “Institutional and Legal drivers”.
When relating to the fields of travel and tourism, Web 2.0 tools like UGC, clearly have a strong impact on the websites related to those fields. According to O’Connor (2008), the UGC is the topic that usually receives the most attention on Web 2.0 travel websites, by users. On websites such as TripAdvisor.com or Zagat.com, the user is allowed to comment the content provided, giving suggestions, appraisal and even criticism on the restaurants or hotels in question. Frequently, the reviewer is allowed to give both a qualitative and quantitative feedback, the later being usually expressed by a star, as in the case of TripAdvisor.com, or grade system.
This kind of interaction between user and provider of the service can be of great importance for both of the intervenient. When the user's opinion is constructive, the provider can use the feedback to improve his work and it can allow him to better understand the customer's thoughts and experience of the service provided. On the other hand, the potential user can have access to a vast list of past experiences given by other users, helping him in his decision-making process. The fact that one can have information on a subject by a user, instead of by the provider itself, can make the information look less bias, or more impartial (Pantelidis, 2010). This is also emphasised by Zhang et al. (2010), that states that while UGC can have a positive impact on the online popularity of a restaurant, content provided by editors can turn-off customers intentions.
In addition, it is also important to refer to the role of Word of Mouth (WOM) and electronic Word-of-Mouth (eWOM) in spreading opinion throughout the web, which is a matter closely related with UGC. In accordance with Litvin et al. (2008), Word of Mouth can be defined as the act of communicating a service, product or even a company, by one person or a group of people that have no financial or commercial interest in the matter. By the same authors, eWOM can be described as the informal communication between consumers and between consumers and producers, about a certain product or service, using Internet-based technologies.
On a sector where WOM and eWOM can play a vital role in the development and success of it, such as the tourism and restaurant industry, it becomes relevant to pay more attention to this issue. According to Pantelidis (2010), WOM constitutes an important mean of promotion for the restaurant sector, and it can be of particular importance in economic crisis periods. A study conducted by Jeong and Jang (2011) states that positive eWOM have a positive impact on the restaurant’s image and on the intentions of purchase by the customers. According to these authors, positive experiences with food, service and atmosphere give the customers an altruistic motivation to share his experience with others, by giving positive eWOM. In another study, on the impact of eWOM on online hotel bookings, it was proven that online reviews help to improve hotel’s sales, by reducing the uncertainty of potential customers (Ye et al., 2011). In fact, the improvements needed to communicate using online opinion platforms can be easy to implement, by tourism managers, considering the loss of competitive advantage that a company may have for being excluded from this process (Zhang et al., 2010).
2.2. Attributes in the Restaurant Business
As mentioned above, the Web, and specifically Web 2.0, with its interactive nature, contains a great number of UGC, over a vast range of subjects. When studying this content, the analysis must not focus only on the general domain or target of the review, but also on all the aspects, or attributes, that are linked with that broader domain. According to Jo and Oh (2011), the specific aspects mentioned in a review are as important for the user as the general subject of it. The same authors define aspect as
“...a multinomial distribution over words that represents a more specific topic in reviews...” (Jo and Oh (2011), page 2). In this work, aspects will also be referred to as
attributes.
Many authors diverge on the number of different attributes that should be considered for an analysis of the restaurant business. However, three main groups of attributes seem to be taken into account in most studies food, service and atmospherics (Namkung and Jang, 2008).
In a study conducted by Jo and Oh (2011) on restaurant reviews from an online restaurant guide, the attributes found were mainly related to types of cuisine, or food, such as “Mexican” or “breakfast” for example, and to other concepts linked with the restaurant business, like “parking” and “waiting”. Soriano (2002) considers the existence of four groups of attributes, on his study on Spain’s restaurant sector, which he considers as determinant factors for a customer to return to the restaurant. According to his study, “Quality of food” was the most important attribute, followed by “Quality of service”, “Cost/value of the meal” and “Place”.
Ha and Jang (2010), on studying the effects of atmospherics on ethnic restaurants, state that the attribute “Atmospherics” has a significant impact on the customer’s behaviour and perception of quality. Experiencing good atmospherics can influence the way customers experience other attributes, such as food and service, increasing satisfaction and loyalty (Ha and Jang, 2010). By these authors, atmospherics, when experienced before the other two main attributes food and service, can influence the way the customer views and experiences them.
According to Kim et al. (2006), who composed a model to study the relation between the predictors of relationship quality and the relationship outcomes for luxury restaurants, there are six main activities that can serve as predictors, or determinants, in the restaurant business. “Physical environment” and “Food quality”, which are considered to be tangible, and “Customer orientation”, “Communication”, “Relationship benefits” and “Price fairness”, the intangible aspects. The study found that, overall, the intangible aspects are the most relevant to predict relationship quality, rather than the tangible ones.
Haghighi et al. (2012), studied the factors affecting customer loyalty, through five attributes, “Food quality”, “Price”, “Service quality”, “Restaurant location” and “Restaurant atmosphere”. “Food quality” was the most important factor, followed by “Restaurant atmosphere”, “Service quality” and “Price”. For “Restaurant location” the results were not confirmed. Andaleeb and Caskey (2007), when investigating the factors that influence satisfaction with food services on a college cafeteria, found eight attributes: “Cleanliness”, “Atmosphere”, “Space”, “Convenient hours”, “Food quality”, “Staff behaviour”, “Price” and “Responsiveness”. The study showed that the “Food
quality” and “Price” were the ones that triggered more dissatisfaction and, therefore, caused the most impact on the studied population.
By Namkung and Jang (2008), “Food Presentation” is also relevant in ensuring customer satisfaction. Along with “Seating Arrangement”, “Interior Design”, “Background Music” and “Service”. “Service” includes reliable, responsive and competent staff (Namkung and Jang, 2008).
Pantelidis (2010) studied UGC on full-service restaurants in the London area, on an online restaurant guide. The author found that the six most repeated factors, or attribute, mentioned in the comments analysed were “Food”, “Service”, “Atmosphere”, “Price”, “Menu” and “Design”. As in other studies above mentioned, “Food” was the most talked-about attribute in the study. Therefore, it is the main aspect that customers refer to, when recalling the experience being commented (Pantelidis, 2010). “Service” and “Atmospherics” were the second and third most mentioned attributes, after “Food”. This evidence is in accordance with other studies mentioned.
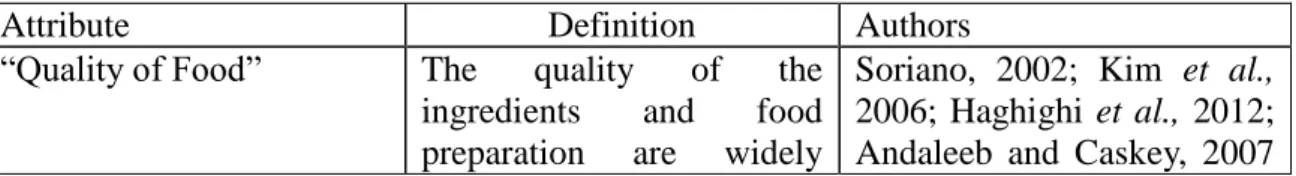
Table 1 presents the eleven attributes selected for this study with its respective literature reference. A twelfth attribute, “Other”, was also taken in consideration. This attribute consists of the topics that did not fit in the other eleven selected. “Other” comprehends concepts such as general feelings about the place or experience, for example, “Everything There is wonderful.” and “Fantastic casual neighborhood
restaurant”.
Table 1 - List of Attributes Used
Attribute Definition Authors
cited as important for customer satisfaction.
and Pantelidis, 2010 “Food Presentation”, The course decoration and
the way it is presented to the customer
Namkung and Jang, 2008
“Quality of Service” It is related with the customer expectation of the service and the actual service provided.
Namkung and Jang, 2008; Soriano, 2002; Haghighi et
al., 2012 and Pantelidis,
2010 “Atmosphere” The comfort, decoration
and background music of the restaurant. The physical environment.
Namkung and Jang, 2008; Ha and Jang, 2010; Kim et
al., 2006; Haghighi et al., 2012 and Pantelidis, 2010 “Price” Adequate price according
to food, service and atmosphere.
Soriano, 2002; Kim et al. 2006; Haghighi et al. 2012;
Andaleeb and Caskey, 2007 and Pantelidis, 2010
“Location” Easy access to the facilities, presence of parking space.
Soriano, 2002 and Haghighi
et al. 2012
“Staff and
Communication”
Knowledge and confidence of the chef, owner or waiter;Staff behaviour during meal (sincerity and respect towards costumer).
Kim et al., 2006; Andaleeb and Caskey, 2007 and
Namkung and Jang, 2008
“Service Responsiveness” Waiting time and queuing. Customer satisfaction is greater when the waiting time is short.
Jo and Oh, 2011 and Andaleeb and Caskey, 2007
“Cleanliness” The cleanliness of the restaurant facilities can contribute to customer satisfaction.
Andaleeb and Caskey, 2007
“Variety of Menu” The different dishes that the restaurant has to offer. Including. The variety of starters, desserts and main courses.
Pantelidis, 2010
“Convenient Hours” The opening hours of the restaurant.
Andaleeb and Caskey, 2007 Other General experience of the
restaurant/meal. Other aspects.
“Appraisal” belongs to a group of three main discourse semantic resources that interpret interpersonal meaning, the others being “involvement” and “negotiation” (Martin and White, 2005). Appraisal is then divided into three categories, “attitude”, “engagement” and “graduation” (Martin and White, 2005). This work will focus only on “attitude” and its three domains, “affect”, “judgement” and “appreciation”.
According to the Oxford Advanced Learner’s Dictionary, “appraisal”, or the act of appraising, is used to evaluate something’s or somebody’s value or quality. “Attitude” is defined as the manner of thinking or behaving towards something or someone. Martin and White (2005) connects “attitude” to feelings, which, for the authors, include emotional reactions and the evaluation of certain behaviours and things. For example, feeling happy with a certain meal experience or the act of judging the behaviour of employees can be considered as attitudes, in this case, affect and judgment, respectively (Martin and White, 2005).
By the same dictionary, “affect” is stated as something that causes someone to have feelings, of sympathy or sadness, towards somebody or something. Therefore it is connected with emotional reactions (Martin and White, 2005). It reflects an emotional state (Chaves and Picoto, 2012). One example of this kind of “attitude”, taken from a review analysed in the present work, is the sentence “Loved the atmosphere...”. It clearly shows a feeling of affect that the reviewer has towards something. In this case, the reviewer demonstrates “love” about the attribute “atmosphere”.
“Judgement” is defined as the making of an opinion about something or, as Chaves and Picoto (2012) state, about the behaviour of others. An example of “Judgement” can be illustrated by the following sentence, concerning a restaurant commentary: “The
service was correct...”. In this sentence, the reviewer is explicitly giving his opinion
about the restaurant’s quality of service. Thereby judging the attribute mentioned.
“Appreciation”, by the referred dictionary, can be characterised as enjoyment and understanding of something. It is then concerned with the intrinsic value that one attributes to something (Martin and White, 2005; Chaves and Picoto, 2012). The sentence “One of my best experiences...” is a good example of “appreciation”. Here, the reviewer is expressing the value that he, personally, attributes to the experience in question, describing his own opinion and feelings on the subject.
One relevant aspect closely related with the appraisal theory is polarity, also referred to as positivity, valence, sentiment orientation or semantic orientation. For the present work it will be known simply as polarity.
In a study conducted by Ding et al. (2008), polarity is described as an opinion’s semantic orientation on a certain feature or attribute and it can be positive, negative or neutral. This same definition is also given by Liu (2010). In a model proposed by Turney (2002) the polarity of a review is classified as positive or negative. By Turney (2002), polarity is considered positive when it has “good associations” or negative when the sentences in a review have “bad associations”. These associations are made between adjectives and adverbs that are classifying certain attributes (Turney, 2002). Yu and Hatzivassiloglou (2003), in their study on differentiating between opinions and facts at both document and sentence levels, propose a model that divides the polarity of opinions into positive, negative and neutral.
According to Chaves and Picoto (2012), polarity indicates the orientation in a given sentence and can be divided into four categories (positive, negative, neutral and
irrelevant). For Godes and Mayzlin (2004) polarity can be classified into six different levels (positive, negative, neutral, mixed, irrelevant and not sure).
Miao et al. (2010) describe polarity as the orientation of opinion words, which can be either negative or positive. The authors also note that the orientation is sensitive to context, making a positive word, negative, depending on what it is related or referring to. This same question is also addressed by Ding et al. (2008), that points out the difficulty in working with context dependent opinion words. In a study conducted by the authors, it is proposed a holistic approach that uses the commentary context as a whole to evaluate the polarity of the opinion.
The following sentences, taken from the reviews analysed in the present work, are illustrative examples of the issue of polarity depending on context: “...the food overall
was of very high quality...” and “...and in the end the price was high...”. The word
“high” is mentioned in both sentences but its orientation is not the same. In the first sentence the polarity is clearly positive, since “high” is qualifying the attribute “quality of food”. However, in the second sentence, “high” has a negative polarity since it is referring to the attribute “price”. This question of assessing polarity according to context is particularly relevant since most of the current algorithms struggle with this matter (Ding et al., 2008).
One other aspect related with polarity is the evidence found in the literature that, although UGC is usually anonymous, the general polarity is very often positive. This shows that reviewers acknowledge a good experience and not only the negative aspects of the meal (Pantelidis, 2010).
The subjects above mentioned, Appraisal Theory and polarity, play a significant role in the present work and are considered the main focus of it.
2.4. Recommendation, Suggestion, Intention (R/S/I) and Complaint
The subjects of R/S/I and Complaint are not yet thoroughly studied in the present literature. Thereby, it is proposed a brief approach to the subject essentially based on the work by Chaves and Picoto (2012).
“Recommendation”, the act of recommending, expresses, according to the above mentioned authors, explicitly or implicitly, an advice about a certain topic. It is usually intended for future clients or future users of that topic and it can be either positive or negative. Examples, from reviews analysed in the present work, are: “...try the best
option for wines...” and “Would recommend a visit very highly...”.
By the same authors, “Suggestion”, which can be explicit or implicit, is directed at the improvement of a certain product or service. Hence, it is mostly intended for the provider of the product or service in question. Examples of implicit “Suggestions” are:
“...the portions were too small...” and “...The hardwood floor makes a constant noise...”. By making these statements, the reviewers are implicitly suggesting that a
change in the food portions or in the second case, the hardwood floors, would be a welcomed improvement.
Chaves and Picoto (2012) define “Intention” as the desire of the reviewer to return or experience again a given product or service. It can be negative or positive and implicit or explicit. An example of an explicit positive intention is: “We will surely
About “Complaint”, it is defined as the expression of a strong feeling of dislike towards something. It is generally stronger than a suggestion (Chaves and Picoto, 2012). By the Oxford Advanced Learner’s Dictionary, “Complaint” is connected with expressing dissatisfaction towards something.
The issues of R/S/I and Complaint comprehend the last part of the present work and due to its subjective nature it will not be the main focus of this study. Therefore it is proposed a broader and least extensive approach to this subject.
3. Methodology
The main objective of the present work is to assess the presence of Attitude in online restaurant reviews in order to better understand what is expressed by the reviewers. For this, 503 reviews on the restaurants in the Lisbon area were studied at sentence level. The reviews were taken from Tripadvisor.com. Tripadvisor.com was selected because of its world-wide usage, being available in 30 countries (TripAdvisor.com, 2012). Tripadvisor.com and its other branded websites claim to be the world’s largest travel community, with over 75 million reviews and opinions (TripAdvisor.com, 2012).
An exploratory research of qualitative data (Malhotra and Birks, 2006) was carried
out to study the information present on the online restaurant reviews. As referred by the authors, the objective of this resarch is to understand the data, rather than measuring it. The research process is flexible, the information is not always clearly defined and it may resort to secondary data, such as in this case (Malhotra and Birks, 2006). On this study, the exploratory research was used to find patterns and relations between the different items analysed, such as polarity, attitude and attributes.
For this study, the following steps were taken.
First Stage: It consisted of selecting the top ranked restaurants in the summer period in the Lisbon area, from 21st of June to 21st of September, 2012. The analysed ranking, on tripadvisor.com, was the one registered on the last day of the studied period, on 21st of September. Choosing the top rated restaurants allows a better view of the specific period being study, the summer.
Second Stage: From the 22 restaurants selected, 503 reviews were collected in accordance with the following criteria:
It was selected a maximum of 30 reviews per restaurant. For the restaurants that exceeded this number during the period studied, only the 30 most recent reviews, chronologically ordered, were considered.
Each review needed to have a minimum of 50 characters, without considering spaces. This restriction helped avoiding spam reviews. All the reviews were searched and selected from the most recent to the
least recent, in chronological order.
It was only considered the reviews written in Portuguese, Spanish, English and French.
During this stage it was also collected the profile of the reviewers, if available. The reviewer’s profile data was taken from the section “about me” available on tripadvisor.com. The categories collected were name, age, location and sex. It was also registered the type of reviewer (reviewer, senior reviewer, contributor, top contributor and senior contributor), which depends on the number of reviews and the helpfulness of it. Other information such as the date of the review, the language and the number of
stars (Tripadvisor uses a scale of 1 to 5) given to the restaurant by each reviewer were also collected.
Third Stage: After being transposed to a spreadsheet, the reviews were divided into 2454 sentences, from where 2769 segments of a sentence were obtained. These segments were analysed manually and individually. A segment is a sequence of words within a sentence containing any of the above items:
“Attribute”: some sentences contain attributes that constitute the object that is being reviewed. These attributes consist of specific concepts of the restaurant business. For this study, eleven attributes were selected from the literature: “Quality of Food”, “Food Presentation”, “Quality of Service”, “Convenient Hours”, “Price”, “Location”, “Staff and Communication”, “Service Responsiveness”, “Cleanliness”, “Variety of Menu” and “Atmosphere”. A twelfth attribute, “Other”, was also created for information concerning the restaurant that did not fit in the above mentioned attributes. These attributes, and there definition are presented in Table 1.
“Polarity”: the general polarity of a given sentence was classified into four categories (positive, negative, neutral or not applicable (N/A)), in accordance with Chaves and Picoto (2012) definition.
“Attitude”: by applying the appraisal theory defended by Martin and White (2005), the attitude of a given sentence was analysed in its three dimensions (affect, judgment and appreciation).
“R/S/I” and “R/S/I Polarity” and “Complain”: for these items, a thorough research is not intended in the present work. “R/S/I” and “Complain” were
analysed using a binary system (Yes/No), according to its presence or not in a sentence. For “R/S/I Polarity” it was used the same classification above mentioned (positive, negative, neutral or N/A), by Chaves and Picoto (2012).
Fourth Stage: After all the sentences were classified, the objective of this stage is to understand the relation between the different items in the sentence. To do this, the data was crossed by using Excel’s pivot table function. The information from this analysis can be helpful for supporting decision making both by restaurant managers and customers.
Fifth Stage: The purpose of this stage is to measure inter-rater agreement. To do this, two other raters were selected to evaluate the presence of “Attitude” in 20% of the sample sentences where attitude was already previously found.
First Stage
Selecting the top ranked restaurants in the summer period in the Lisbon area, from 21st of June to 21st of September, 2012 on tripadvisor.com
Second Stage Collected 503 reviews with:
Maximum of 30 reviews per restaurant.
Minimum of 50 characters, without spaces, per review.
Reviews selected from the most recent to the least recent, in chronological order.
Reviews written in Portuguese, Spanish, English and French. Third Stage Sentence analysis: Attribute. Polarity. Attitude.
R/S/I and R/S/I Polarity.
Complain.
Fourth Stage
4. Sample Characterization
After collecting 503 reviews, according to the criteria exposed in the methodology section, 2454 sentences and 2769 segments of sentences were obtained. The reviews were made by 430 different reviewers and taken from 22 different restaurants. Further information about the sample can be found on Table I, “Sample Description”, on the Appendix section.
The reviewer information collected was the one available on Tripadvisor.com: age, gender, location, type of reviewer (contributor, reviewer, senior contributor, senior reviewer and top contributor), number of restaurants reviewed, number of helpful votes and the year of register on the website. Table 2 illustrates the frequency of each type of reviewer.
Table 2 - Percentage of Reviewer Type
Type of Reviewer Percentage (%)
Contributor 13,26 Reviewer 18,37 Senior Contributor 17,44 Senior Reviewer 17,21 Top Contributor 6,28 Not Applicable 27,44 Total 100,00
Concerning location, 366 out of the 430 reviewers indicated this category. Most of the reviewers came from Portugal (26%), followed by the USA (13%), UK (12%), France (9%) and Spain (7%). From the 430 reviewers only 33% indicated their age and sex. For those who indicated, the most frequent age groups were 35-49 (41%) and 25-34 (32%) and the percentage of males was 54% while 46% were females.
Fifth Stage
It was measured the inter-rater agreement between three raters on the item “Attitude”.
The price range differs from restaurant to restaurant, the lowest price being 7 USD and the highest price 80 USD per meal. About the number of stars attributed by each reviewer to the restaurants, the majority (62%), gives 5 stars, which is the maximum, followed by 4 stars (24%), 3 stars (9%), 2 stars (3%) and 1 star (2%).
As mentioned in methodology and presented in Table 1, 11 attributes, were taken from the literature for this analyses, plus a 12th (“Other”). From the total of 2454 sentences, 1676 (68%) had at least one attribute, while 778 (32%) had none. From the 1676 sentences, 85% had only one attribute, followed by two (11%) and three (4%). The total number of attributes found is 1991 considering that each sentence can have up to three attributes. The attribute’s frequency on the total of attributes is presented in Table 3.
Table 3 - Percentage of Attributes Found
Attribute Percentage Attribute Percentage Quality of Food 32,30% Staff and Communication 14,47% Food Presentation 1,66% Service Responsiveness 2,31% Quality of Service 8,14% Cleanliness 0,15% Atmosphere 8,59% Variety of Menu 8,04%
Price 9,84% Convenient Hours 0,45%
Location 2,86% Other 11,20%
Total 100%
“Attitude” and its three analysed dimensions (“Appreciation”, “Judgement” and “Affect”), play a key role in the present work. It was found evidence of “Attitude” in 1641 sentences, 67% of the total, while 33% had none. “Attitude” was found in fewer sentences than “Polarity” and “Attribute” because not every “Attribute” has necessarily an “Attitude”. On other hand, every “Attribute” has a certain “Polarity” connected to it.
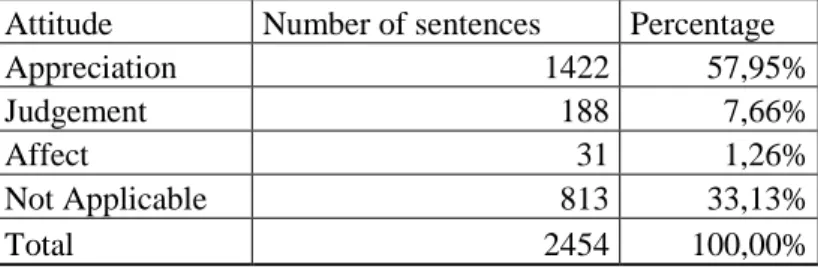
Table 4 shows the number and percentage of sentences per attitude. Appreciation was the dominant type of “Attitude” found, followed by “Judgement” and “Affect”.
Table 4 - Number and Percentage of Sentences with at least one Attitude
Attitude Number of sentences Percentage Appreciation 1422 57,95%
Judgement 188 7,66%
Affect 31 1,26%
Not Applicable 813 33,13%
Total 2454 100,00%
“Polarity” was found in 1676 sentences, which is in agreement with the results found for “Attribute”, has it was explained above. Out of the 1676 sentences, 79% had positive polarity, 9% neutral and 12% negative.
For checking the presence of “R/S/I”, it was used a binary system (Yes/No). The majority of the sentences, 71%, had no presence of whether a recommendation, suggestion or intention. Only 29% had some type of “R/S/I”.
Regarding “R/S/I Polarity”, from the 713 sentences, 29% of the total, where “R/S/I” was present, the large majority, 87%, had positive “R/S/I”, followed by negative (10%) and neutral (3%). This result is consistent with the evidence found for the item “Polarity”, which is also corroborated by the literature (Pantelidis, 2010).
For the item “Complaint”, only 0.7% of the total sentences showed a clear evidence of its existence.
5. Results Analysis
analysed by Excel’s dynamic function option. The following tables, from 5 to 14, present the results as percentage by line. Each line gives a total of 100%. The last column (Total) also includes the absolute value representing the number of segments classified in each line.
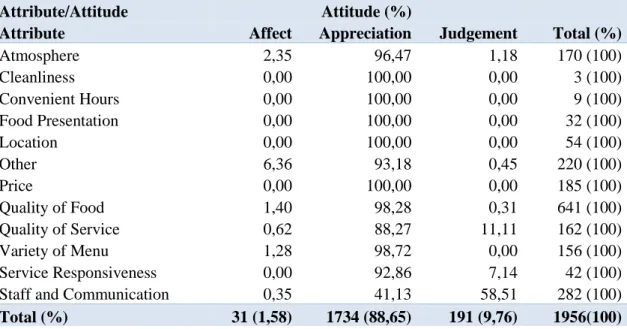
Table 5 presents the results of the crossing of “Attribute” and “Attitude”. It is possible to verify that the majority of attributes mentioned in the sentences were related to an attitude of “Appreciation”. In fact, most of the least mentioned attributes, such as “Convenient Hours”, “Food Presentation”, “Location” and “Cleanliness”, only indicated that type of attitude. The only exception is the attribute “Staff and Communication” for which “Judgment” is present in 58,51% of the sentences. This evidence may be explained by the fact that this attribute mainly refers to the evaluation of the conduct of the restaurant’s staff. In this type of sentence, the reviewers usually make an opinion about their actions and behaviour, therefore, judging it.
Table 5 - Percentage of Attitude per Attributes
Attribute/Attitude Attitude (%)
Attribute Affect Appreciation Judgement Total (%) Atmosphere 2,35 96,47 1,18 170 (100) Cleanliness 0,00 100,00 0,00 3 (100) Convenient Hours 0,00 100,00 0,00 9 (100) Food Presentation 0,00 100,00 0,00 32 (100) Location 0,00 100,00 0,00 54 (100) Other 6,36 93,18 0,45 220 (100) Price 0,00 100,00 0,00 185 (100) Quality of Food 1,40 98,28 0,31 641 (100) Quality of Service 0,62 88,27 11,11 162 (100) Variety of Menu 1,28 98,72 0,00 156 (100) Service Responsiveness 0,00 92,86 7,14 42 (100) Staff and Communication 0,35 41,13 58,51 282 (100) Total (%) 31 (1,58) 1734 (88,65) 191 (9,76) 1956(100)
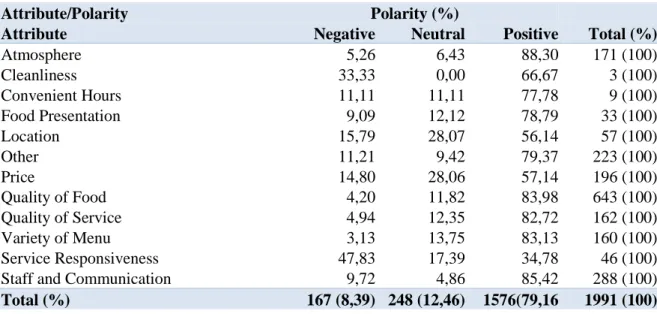
According to the results presented in Table 6, by matching “Attribute” with “Polarity”, it is possible to verify that attributes are generally connected with positive experiences by the reviewers. The exception is the item “Service Responsiveness”, which is mainly connected with waiting time, whether for a table or during the meal. This issue will be further addressed on the discussion section of the present work.
Table 6 - Percentage of type of Polarity per Attribute
Attribute/Polarity Polarity (%)
Attribute Negative Neutral Positive Total (%) Atmosphere 5,26 6,43 88,30 171 (100) Cleanliness 33,33 0,00 66,67 3 (100) Convenient Hours 11,11 11,11 77,78 9 (100) Food Presentation 9,09 12,12 78,79 33 (100) Location 15,79 28,07 56,14 57 (100) Other 11,21 9,42 79,37 223 (100) Price 14,80 28,06 57,14 196 (100) Quality of Food 4,20 11,82 83,98 643 (100) Quality of Service 4,94 12,35 82,72 162 (100) Variety of Menu 3,13 13,75 83,13 160 (100) Service Responsiveness 47,83 17,39 34,78 46 (100) Staff and Communication 9,72 4,86 85,42 288 (100) Total (%) 167 (8,39) 248 (12,46) 1576(79,16 1991 (100)
According to Table 7, that illustrates the relation between “Attitude” and “Polarity”, most of the attitudes (affect, appreciation and judgement) were classified as positive polarity. “Affect” has the higher percentage of positive attitude (97%), followed by “Judgement” with 86% and “Appreciation” with 79%.
Table 7 - Attitude per type of Polarity
Attitude/Polarity Polarity
Attitude Negative Neutral Positive Total Affect 1 (3) 0 (0) 30 (97) 31(100) Appreciation 142 (8) 215 (12) 1377(79) 1734(100) Judgement 19 (10) 7 (4) 165 (86) 191(100) Total 162 (8) 222 (11) 1572(80) 1956(100) Regarding the presence of “R/S/I” and “R/S/I Polarity”, when verified, is also
“Polarity” above mentioned. The majority, 87,10% point to a positive recommendation, intention or suggestion to the management or clients of the restaurant in question. Only 10,10% expressed negative feelings towards these items and 2,81% of the results were neutral.
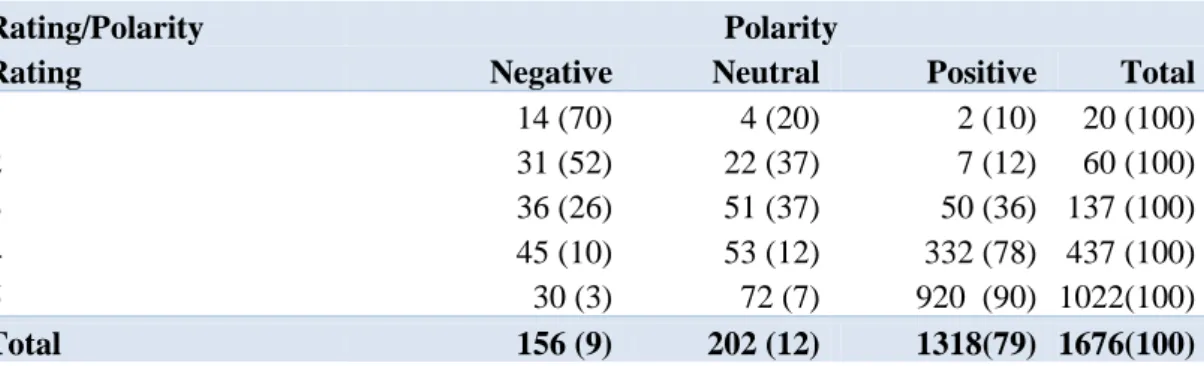
Table 8 shows the relation between the rating given by the reviewers to the restaurant and the polarity of each sentence of the review. Overall, the 5 star scale rating system is in accordance with the polarity of the sentences. For reviews classified with 1 star, the majority of sentences are negative. For 5 star reviews, 90% of the sentences refer to a positive experience.
Table 8 - Type of Rating per type of Polarity
Rating/Polarity Polarity
Rating Negative Neutral Positive Total
1 14 (70) 4 (20) 2 (10) 20 (100) 2 31 (52) 22 (37) 7 (12) 60 (100) 3 36 (26) 51 (37) 50 (36) 137 (100) 4 45 (10) 53 (12) 332 (78) 437 (100) 5 30 (3) 72 (7) 920 (90) 1022(100) Total 156 (9) 202 (12) 1318(79) 1676(100)
However, the results also show that even in overall negative reviews, there are still positive remarks and in more positive reviews there are negative aspects. In this case, 10% of 1 star reviews had positive sentences and 12% in 2 star reviews. On the other hand, 10% of 4 star reviews had negative comments and 3% in the case of 5 star reviews. A more detailed analysis indicates that 24 different 5 star reviews have at least one negative sentence. For 3 reviews classified with 2 stars and 2 reviews with 1 star, at least one positive sentence was also verified.
5.1. Attribute, Polarity and Attitude
This section gives a more detailed analysis of “Polarity” and “Attitude” in the 6 most mentioned attributes (“Quality of Food”, “Staff and Communication”, “Price”, “Atmosphere”, “Quality of Service” and “Variety of Menu”). These six attributes account for 81,38% of the total number of attributes referred. Although “Other” is the third most mentioned, this attribute refers to various concepts of the restaurant business that did not fit in the other 11 attributes and, therefore, it is not considered for analysis in this section.
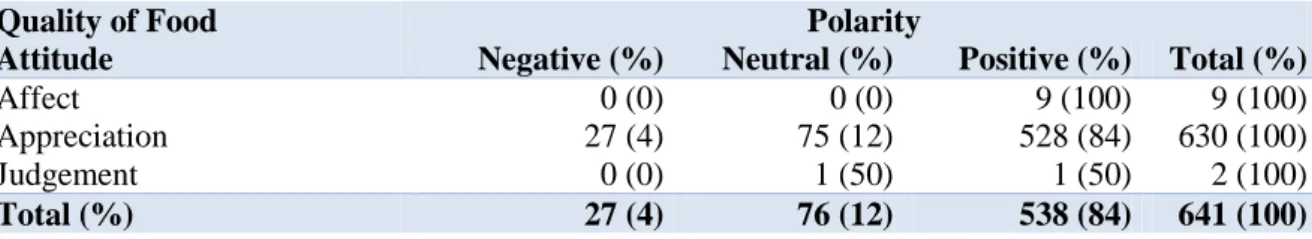
“Quality of Food” is the most mentioned attribute. From the total 641 sentences that expressed this attribute, 630 sentences indicated the presence of “Appreciation”. As seen on Table 9, when “Appreciation” and “Affect” are mentioned it is usually connected with positive emotions or experiences, being “Affect” exclusively linked with this type of polarity. For “Judgement” the polarity is either neutral or positive.
Table 9 - Attitude per type of Polarity on Quality of Food
The attribute “Staff and Communication”, contrary to most of the other attributes, is mostly connected with “Judgement”, rather than “Appreciation”. However, much like the others, the majority of its sentences indicate positivity, 87% as seen in Table 10. One tenth of “Judgement” and 9% of “Appreciation” sentences expressed negative polarity.
Table 10 - Attitude per type of Polarity on Staff and Communication
Quality of Food Polarity
Attitude Negative (%) Neutral (%) Positive (%) Total (%) Affect 0 (0) 0 (0) 9 (100) 9 (100) Appreciation 27 (4) 75 (12) 528 (84) 630 (100) Judgement 0 (0) 1 (50) 1 (50) 2 (100) Total (%) 27 (4) 76 (12) 538 (84) 641 (100)
Attitude Negative (%) Neutral (%) Positive (%) Total(%)
Affect 0 (0) 0 (0) 1 (100) 1 (100)
Appreciation 10 (9) 9 (8) 97 (84) 116 (100) Judgement 16 (10) 1 (1) 148 (90) 165 (100)
Total (%) 26 (9) 10 (4) 246 (87) 282 (100)
“Price”, as seen in Table 11, is only connected with the attitude “Appreciation”. Although 61% of the sentences was positive, close to one quarter, 24%, expressed a neutral reaction to price and 16% negative.
Table 11 - Attitude per type of Polarity on Price
Price Polarity
Attitude Negative (%) Neutral (%) Positive (%) Total(%) Appreciation 29 (16) 44 (24) 112 (61) 185 (100) Total (%) 29 (16) 44 (24) 112 (61) 185 (100)
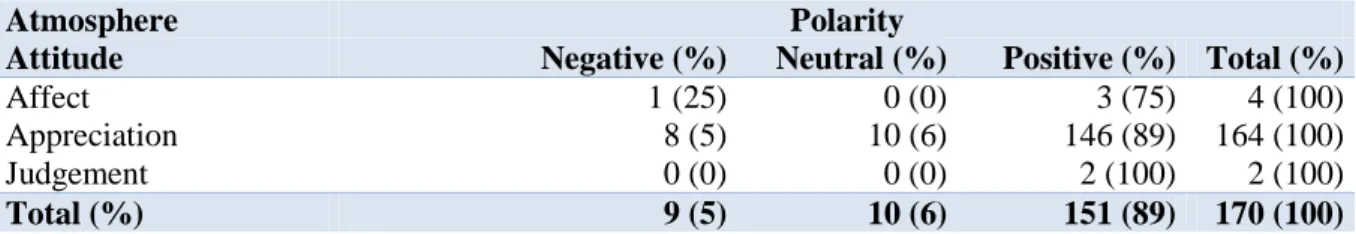
The dominant attitude verified in the attribute “Atmosphere” was “Appreciation” (164 out of 170). As most of the attributes, the polarity present was mostly positive. Although “Affect” shows 25% of negative polarity, this figure only represents one sentence, on the total of 4 that indicated this attitude.
Table 12 - Attitude per type of Polarity on Atmosphere
Atmosphere Polarity
Attitude Negative (%) Neutral (%) Positive (%) Total (%)
Affect 1 (25) 0 (0) 3 (75) 4 (100)
Appreciation 8 (5) 10 (6) 146 (89) 164 (100) Judgement 0 (0) 0 (0) 2 (100) 2 (100)
Total (%) 9 (5) 10 (6) 151 (89) 170 (100)
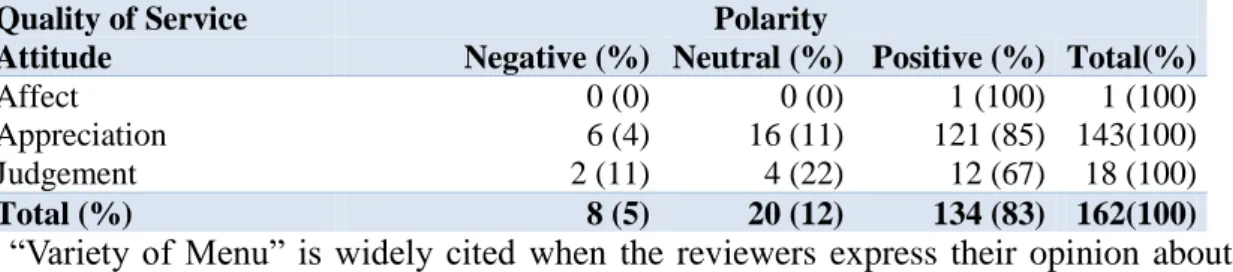
The item “Quality of Service” is usually one of the most cited attributes in the literature (Namkung and Jang, 2008; Soriano, 2002; Haghighi et al., 2012 and Pantelidis, 2010). In this study is the fifth most mentioned. The attitude “Affect” is only present in one sentence, with positive polarity, as seen in Table 13. Appreciation is present on 143 of the 162 and its polarity is mostly positive, in accordance with the observations for other attributes
Table 13 - Attitude per type of Polarity on Quality of Service
“Variety of Menu” is widely cited when the reviewers express their opinion about the different types of dishes that are present in the menu. For this attribute, only two sentences denote “Affect” and 85% of the total expressed positive polarity. This indicates that the variety of the menu is mostly mentioned when describing a positive experience with it. The presence of a vegetarian option, for example, is usually regarded as positive by the reviewers. The results for “Variety of Menu” are shown in Table 14.
Table 14 - Attitude per type of Polarity on Variety of Menu
5.2. Inter-rater Agreement
In this section, three different evaluators were selected for testing agreement amongst each other on the subject of “Attitude”. The raters were two males and one female with ages from 22 to 35 years old, two of them hold a bachelor’s degree and the other a Doctorate degree. As Carletta (1996) refers, measuring agreement between the author’s results and other people is important so that those results can be understood and confirmed by others.
For this task, 337 random sentences, corresponding to 20% of the sentences
Quality of Service Polarity
Attitude Negative (%) Neutral (%) Positive (%) Total(%) Affect 0 (0) 0 (0) 1 (100) 1 (100) Appreciation 6 (4) 16 (11) 121 (85) 143(100) Judgement 2 (11) 4 (22) 12 (67) 18 (100) Total (%) 8 (5) 20 (12) 134 (83) 162(100)
Variety of Menu Polarity
Attitude Negative (%) Neutral (%) Positive (%) Total(%)
Affect 0(0) 0(0) 2 (100) 2 (100)
Appreciation 5 (3) 18 (12) 131 (85) 154 (100)
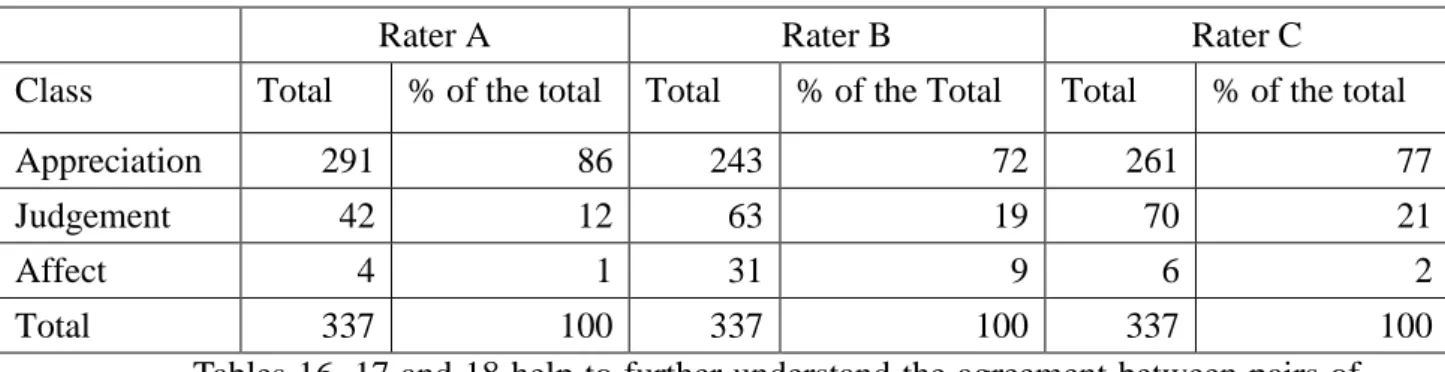
where “Attitude” was found, were selected. The evaluators classified the sentences according to one of the three kinds of attitude approached in this study (“Affect”, “Judgment” and “Appreciation”). Table 15 shows the number of sentences with different attitude per rater.
Table 15 - Classification of types of attitude according to raters A, B and C
Rater A Rater B Rater C
Class Total % of the total Total % of the Total Total % of the total
Appreciation 291 86 243 72 261 77
Judgement 42 12 63 19 70 21
Affect 4 1 31 9 6 2
Total 337 100 337 100 337 100
Tables 16, 17 and 18 help to further understand the agreement between pairs of raters. In these confusion matrixes, the diagonal represents the number of sentences where both raters agree and the other values those where the raters disagree.
Table 16 - Confusion matrix of A and B’s classifications
Table 17 - Confusion matrix of A and C’s classifications
A / C Appreciation (%) Judgement (%) Affect (%) Total C (%)
Appreciation 73,89 10,68 1,78 86,35
Judgement 2,37 10,09 0,00 12,46
Affect 1,19 0,00 0,00 1,19
Total A (%) 77,45 20,77 1,78 337 (100,00)
Table 18 - Confusion matrix of B and C’s classifications
B / C Appreciation (%) Judgement (%) Affect (%) Total C (%)
Appreciation 67,06 4,15 0,89 72,11
Judgement 3,56 15,13 0,00 18,69
Affect 6,82 1,48 0,89 9,20
A / B Appreciation (%) Judgement (%) Affect (%) Total B (%)
Appreciation 70,33 8,01 8,01 86,35
Judgement 1,19 10,68 0,59 12,46
Affect 0,59 0,00 0,59 1,19
Total B (%) 77,45 20,77 1,78 337( 100,00) As it is possible to verify in the above tables, overall, the raters agree between each
other. The percentage of agreement between raters was 81,60% for raters A and B, 83,98% for A and C and, for raters B and C, 83,09%. These values were obtained by dividing the number of sentences where agreement was found and the total sentences analyzed (337).
To further measure agreement it was used the method of Kappa Statistics, as proposed by Carletta (1996). This method is used for measuring agreement amongst pairs of raters. Cohen’s Kappa (Cohen, 1960), is calculated by the following equation:
Pr(a) is the relative observed agreement among raters, and Pr(e) is the hypothetical probability of chance agreement, using the observed data to calculate the probabilities of each rater randomly mentioning each category. The values for k have the following interpretations: if k is 1 (one), there is perfect agreement between raters, if k is 0 (zero), there is no agreement better than chance and, if k is negative, agreement is worse than chance.
The average Kappa verified for the three raters was 0,51. According to the classification by LeBreton and Senter (2008), this value is classified as “Moderate Agreement”. This is acceptable given the subjectivity of the task in hand. Although it was given a definition of “Affect”, “Appreciation” and “Judgment” to the raters, its application, in certain sentences, can be discussable (Martin and White, 2005).
detail in order to further understand their consequences and implications on the restaurants management and clients.
From Table 3 in section 4, it is possible to verify that the 3 most frequent attributes (“Quality of Food” (32,30%), “Staff and Communication” (14,47%) and “Price” with 9,84%) represent 56,61% of the total. Although “Other” (11,20%) is the third most mentioned item, it is not thoroughly analyzed, for the already above mentioned reasons. This evidence is consistent with the results found by Andaleeb and Caskey (2007), that obtained the same top 3 in their study, although with different results for polarity. In that study, “Quality of Food” and “Price” were classified in a negative manner, whereas in the present study polarity was overall positive in most attributes. The fact that most reviews were positive is also verified in the literature (Pantelidis, 2010).
“Quality of Food” is usually the most mentioned and most important attribute in the literature (Pantelidis, 2010; Soriano, 2002; Andaleeb and Caskey, 2007; and Haghighi et
al., 2012). “Staff and Communication” and “Price” are also top mentioned attributes in
studies by Kim et al. (2006), Andaleeb and Caskey (2007), Pantelidis (2010) and Soriano (2002). Although “Atmosphere” is also widely cited (Namkung and Jang, 2008; Ha and Jang, 2010; Kim et al., 2006; Haghighi et al., 2012 and Pantelidis, 2010), it was only the fourth most mentioned in this study.
The fact that “Quality of Food” is the most important attribute proves that although there are other relevant items in the restaurant business, food continues to be of extreme importance. Therefore, restaurant managers should pay attention to food quality and preparation in order to deliver a good meal experience. Staff behavior is also valued by reviewers. Aspects such as sympathy, good communication and understanding of costumer’s needs are, hence, greatly appreciated by reviewers. Restaurants should pay
attention to this item by giving continuous motivation and training to their staff, so they can improve their communication and cognitive skills. Knowledge of the menu and product preparation is also noted as important for delivering good service. “Price”, also having mostly positive reviews, shows that people recognize when they pay a fair price for their meal.
The only attribute that indicated generally negative polarity was “Service Responsiveness”. It can be assumed that, by giving a negative polarity to this item, reviewers intend for the service to have a certain time and, therefore, note when that time is exceeded. For this, managers should try to find ways to improve responsiveness, specially waiting times.
Positive “Appreciation” was the dominant attitude found. This evidence demonstrates that good practices are valued by the costumers and will be noted on online reviews. For this reason, managers should not be afraid of their business going on websites such as Tripadvisor.com. The results also show that “Affect” is not often present in restaurant reviews. Reviewers tend to make objective analysis of their experience, rather than express their emotional feelings about it. “Judgement” is usually more significant in attributes related with service (“Staff and Communication” and “Quality of Service”), for this kind of attitude is mostly used for describing and evaluating people’s behaviour and actions.
Only 0,7% of the sentences indicated a complaint, which shows that reviewers do not use websites such as Tripadvisor.com to openly react to bad experiences about the restaurant. This, together with the overall positive polarity found, is further evidence that restaurants should encourage their costumers to write online reviews.
The vast majority (87,10%) of recommendations, suggestions and intentions revealed positive polarity. The fact that for this item polarity was mostly positive indicates that costumers are expressing ideas that can be useful for improving the restaurant and also that restaurant managers can select this information for marketing campaigns.
Regarding the reviews ratings, although negative ratings were mostly negative and positive ratings were overall positive, reverse polarity was also found. Reviews with 5 and 4 stars had 3% and 10% of negative sentences, respectively, and 1 and 2 stars ratings had 10% and 12% of positive remarks each. This evidence indicates that ratings do not always reflect the full meaning of the review. Therefore analysing reviews at the sentence level can provide a more accurate understanding of the reviewer’s experience.
Concerning the agreement between raters (section 5.2), the percentage of agreement between each of them was 81,60% for raters A and B, 83,98% for A and C and, for raters B and C, 83,09%. The average Kappa calculated was 0,51. Although it is considered as “Moderate Agreement” (LeBreton and Senter, 2008) this value is satisfactory considering the subjectivity of analyzing “Attitude” at sentence segment level.
7. Conclusion
In accordance with the initial objectives of the present work, the following main findings were taken. The first is that the top most mentioned attributes are “Quality of Food”, “Staff and Communication”, “Price”. This shows that food is still the most important aspect for restaurants. Even in times of economic recession and uncertainty, food quality still overweighs price and service in costumer’s preferences. Another