UNIVERSIDADE DE LISBOA
FACULDADE DE MEDICINA DE LISBOA
Regulatory interactions between the metabolic
sensors SIRT1 and AMPK in modulating
PPARα linked functions, in obesity-dependent
type 2 diabetes mellitus
Marta Silvestre
Orientada por: Dr. Paul Caton
Co-orientada por: Profa. Maria Carlota Saldanha e Profa. Maria Helena
Cortez Pinto
Biomedical Sciences
Functional Sciences
Todas as afirmações efectuadas no presente documento são da exclusiva responsabilidade do seu autor, não cabendo qualquer responsabilidade à Faculdade de Medicina de Lisboa pelos conteúdos nele apresentados.
A impressão desta dissertação foi aprovada pelo Conselho Científico da
Faculdade de Medicina de Lisboa da Universidade de Lisboa em reunião
(…)
Enfim duma escolha faz-se um desafio Enfrenta-se a vida de fio a pavio Navega-se sem mar, sem vela ou navio Bebe-se a coragem até dum copo vazio E vem-nos à memória uma frase batida Hoje é o primeiro dia do resto da tua vida
E entretanto o tempo fez cinza da brasa E outra maré cheia virá da maré vaza Nasce um novo dia e no braço outra asa Brinda-se aos amores com o vinho da casa E vem-nos à memória uma frase batida Hoje é o primeiro dia do resto da tua vida.”
Acknowledgements
I would like to thank, my supervisor Dr. Paul Caton for his supervision and guidance through out my PhD and for having accepted to supervise me after Professor Mary Sugden get retired.
I would like to thank, my previous supervisor Professor Mary Sugden for giving me opportunity to work with her at the Blizard Institute, Queen Mary University of London, for her supervision and guidance during my PhD and for keeping guiding me on an informal basis, after getting retired.
I would also like to thank, my supervisors Professor Maria Carlota Saldanha and Professor Helena Cortez Pinto for their help and guidance throughout my PhD and for allowing me to work at Instituto de Medicina Molecular.
Additionally, I would like to thank, Professor Isabel do Carmo for giving me the opportunity to study at Faculdade de Medicina da Universidade de Lisboa and for her incredible support for the last 4 years.
I would like to thank everyone who has helped me throughout the past 4 years, in particular Dr. Mark Holness, Mr. Sharif Hegazy, Ms. Gertrud Kourtman, Dr. Tania Maffucci, Professor Benoit Viollet, Mrs. Irene Smith and Mrs. Susanne Bell.
I would also like to thank Bruno, my husband, for leaving his life in Portugal to join me in London UK and for his constant support over the last years.
Finally, thank you to Fundação para a Ciência e Tecnologia for funding throughout my PhD and thank you Queen Mary University of London for being my host university and allow me to work on your laboratories.
Resumo
A diabetes mellitus tipo 2 (T2DM) é uma doença metabólica de etiologia variada que continua a afectar pessoas em todo o mundo. Caracteriza-se essencialmente por alterações da ação da insulina e/ou da sua secreção, que resultam numa hiperglicémia crónica. O excesso de peso/obesidade e a inactividade física são as principais causas da T2DM em indivíduos geneticamente predispostos. A carência proteica durante a gravidez (restrição proteica na gravidez; MLP), resulta em recém-nascidos de baixo peso (LBW) que, numa fase mais tardia da vida desenvolvem insulinorresistência e um fenótipo de diabetes. A SIRT1 e a proteína cinase ativada-AMP (AMPK) constituem importantes enzimas responsáveis pela longevidade e pela homeostasia energética e, consequentemente, desempenham um papel importante no desenvolvimento de doenças metabólicas tais como a T2DM. Através de mecanismos de desacetilação, a SIRT1 regula a atividade do receptor nuclear - proliferador de peroxissoma α (PPARα) -, controlando assim a expressão de genes envolvidos no metabolismo da glucose e dos lípidos. Os factores que regulam o interferão 3 e 4 (IRF3 e IRF4), por serem repressores chave no processo de adipogénese, também merecem especial atenção no que respeita ao desenvolvimento de doenças metabólicas. O trabalho aqui proposto tem como objetivo investigar a potencial existência de um circuito positivo entre as proteínas AMPK e SIRT1 e tentar caracterizar o papel deste circuito, na indução da expressão genética regulada pelo PPARα. Ratinhos C57Bl/6 submetidos a jejum ou a uma dieta hiperlipídica (HF) e ratos MLP foram usados neste estudo. Os modelos descritos foram usados para avaliar o impacto da disponibilidade calórica e proteica no desenvolvimento de insulinorresistência e, consequentemente, da T2DM no fígado e tecido adiposo (WAT), respectivamente; ratinhos em que o gene AMPK α1/2 foi especificamente eliminado no fígado e músculo (AMPK-/-) foram usados para identificar o papel da
ativação da AMPK e da SIRT1 nas funções ligadas ao PPARα; ratinhos PPARα
knockout foram usados para investigar a deficiência de PPARα na lipogénese e
beta-oxidação do tecido adiposo visceral; células hepáticas H4IIEC3 cultivadas e tratadas com um SIRT1 siRNA, serviram para caracterizar o circuito positivo entre SIRT1 e AMPK; mioblastos L6 foram cultivados e tratados com um agonista da AMPK (adiponectina) e com insulina; adipócitos 3T3-L1 foram cultivados e tratados com um
agonista do PPARα (WY14683) para identificar o papel do PPARα no IRF3 e no IRF4.
Através da utilização de tecido hepático AMPK-/- e de células H4IIEC3 silenciadas para a SIRT1 verificou-se que, no fígado, a AMPK e SIRT1 regularam-se reciprocamente num processo que impede a acumulação de triacilgliceróis. O estudo de ratinhos alimentados com uma dieta HF, tratados com mononucleótido de nicotinamida (NMN), permitiu estabelecer uma ligação entre o circuito AMPK/SIRT1 e a fosforilação do substrato do receptor de insulina (IRS-1), sugerindo uma relação entre o circuito SIRT1/AMPK e a via da sinalização de insulina. No músculo-esquelético, a deficiência da AMPK altera os efeitos benéficos da restrição calórica na tolerância à glucose, o que prova que este benefício é dependente da AMPK. A diminuição da expressão da SIRT1 aliada à deficiência da AMPK, altera a via da sinalização de insulina, o que resulta numa diminuição da entrada de glucose para as células. No tecido adiposo visceral, a inibição do IRF3 e do IRF4 reduz o processo de β-oxidação e aumenta o processo de lipogénese em ratos MLP. Os estudos realizados no tecido adiposo levaram à conclusão de que o IRF3 é potencialmente ativado pela AMPK, e o IRF4 é ativado pelo PPARα, num processo que envolve adiponectina.
Os resultados obtidos sugerem que o eixo AMPK-SIRT1-PGC-1α-SIRT3 durante o jejum/CR é importante na prevenção de distúrbios metabólicos. Regular a atividade da AMPK e da sua interação com as sirtuinas na funções ligadas ao PPARα, pode ser potencialmente importante para o tratamento de distúrbios como a T2DM e outros associados ao envelhecimento. A adiponectina e o NMN são potenciais alvos terapêuticos para o tratamento de doenças metabólicas.
Abstract
Both genetic and environmental influences determine the risk of developing type 2 diabetes mellitus (T2DM). Epidemiological studies indicate that factors influencing the prevalence of T2DM include lifestyle (e.g. inactivity and dietary macronutrient composition), obesity and age. Interestingly maternal protein restriction (Maternal Low Protein; MLP) generates low birth weight (LBW) offspring, who develop insulin resistant and diabetic phenotype in later life. Interferon regulatory factors 3 and 4 (IRF3 and IRF4) are key repressors of adipogenesis. SIRT1, a histone/protein deacetylase, and AMP-activated protein kinase (AMPK) are key enzymes responsible for longevity and energy homeostasis. Through deacetylation and activation of peroxisome proliferator-activated receptor-γ coactivator 1 α (PGC-1α), a transcriptional regulator of fatty acid (FA) oxidation, SIRT1 mediates activation of peroxisome-proliferator-activated receptor α (PPARα), which is a nuclear receptor that controls the expression of genes involved in glucose and lipid homoeostasis. The proposed study aims to investigate whether a positive feed back loop exists in response to AMPK/SIRT1 activation and try to characterize the role of this pathway in the regulatory circuit through which PPARα induces gene expression. C57Bl/6 mice fasted or fed a high fat diet (HF) and rat MLP-offspring were used to understand the importance of nutrient availability in the development of insulin-resistance and T2DM in liver and visceral white adipose tissue (WAT) respectively; specific liver and muscle AMPK α1/2 double null (AMPK-/-) mice were used to understand the role
of AMPK on SIRT1 activation and PPARα linked functions; PPARα deficient mice were used to investigate the influence of PPARα deficiency on lipogenesis and β oxidation in mice visceral WAT; H4IIEC3 liver cell line was cultured and treated with a SIRT1 siRNA to better understand the feedback loop between SIRT1 and AMPK; L6 myoblasts were cultured and treated with AMPK agonist adiponectin and with insulin, and 3T3-L1 adipocytes were cultured and treated with PPARα agonists (WY14683) to understand the role of PPARα in IRF3 and IRF4.
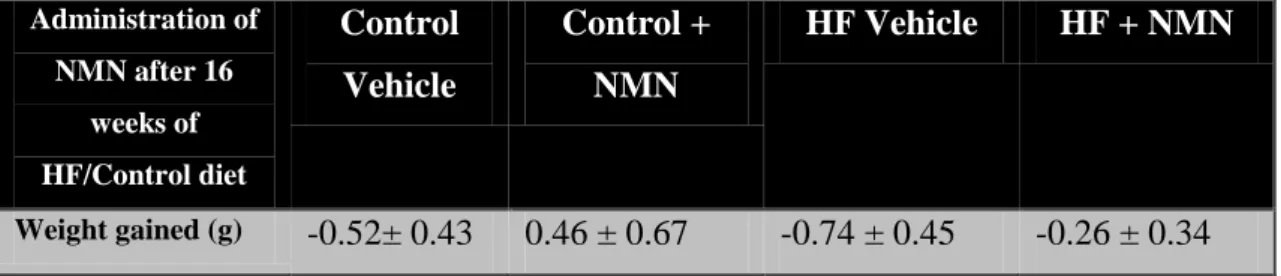
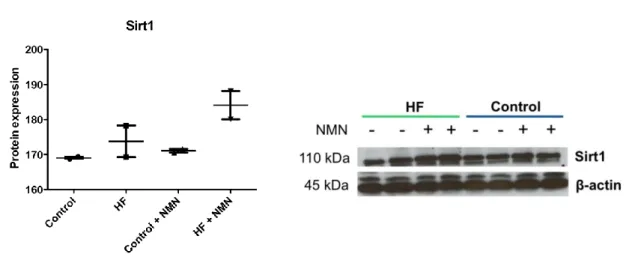
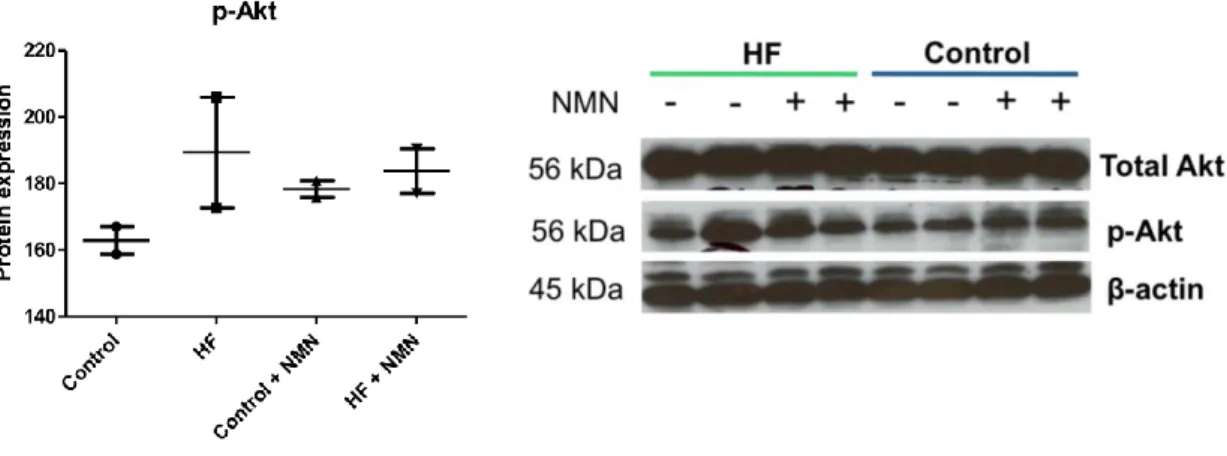
Using AMPK-/- liver and SIRT1 knockdown H4IIEC3 cells we found that, in the liver, AMPK and SIRT1 regulate each other to prevent lipid accumulation. Studies on HF fed mice, treated with nicotinamide mononucleotide (NMN), linked this
AMPK/SIRT1 pathway to phosphorylation of the insulin receptor substrate (IRS-1) at tyrosine residues, suggesting an involvement of the SIRT1/AMPK axis in the insulin-signalling pathway. In skeletal muscle AMPK deficiency impairs the beneficial effects of CR on glucose tolerance. This is linked to decreased SIRT1 gene expression, which could impair insulin signalling pathway, culminating in reduced glucose uptake. Using MLP-offspring visceral WAT, we found that suppression of interferon regulatory factors 3 and 4 (IRF3 and IRF4, respectively) represses fatty oxidation and enhances lipogenesis in MLP-offspring. IRF3 is possibly activated by AMPK, where IRF4 is activated by PPARα.
Taken together, our results suggest that AMPK-SIRT1-PGC-1α-SIRT3 axis during fasting/CR is important to prevent metabolic disorders. Regulation of AMPK and PPARα linked functions together with deacetylation catalyzed by the sirtuins may prove to be important for the treatment of T2DM and other disorders associated with aging. Adiponectin (which activates AMPK and PPARα) and NMN (which increases SIRT1 activity) are potential therapeutic targets for the treatment of metabolic disorders.
List of Abbreviations
ACC ACoA ADP AICAR AL AMP AMPK ANOVA APS ATP BSA CaCl2 CaMKKβ cAMP CBS CO2 CPT-1 CR CREB DAG DMEM DMSO dNTP DPP-IV DTT ECACC EDTA ELISA ER FAS FCS FFA FOXA2 FOXO FOXO1 FPG FR F2,6P2 FXR GDM GLP-1 GLUT GLUT4 G6P G6Pase GS GSK3acetyl CoA carboxylase acetyl CoA
adenosine diphosphate
5-aminoimidazole-4-carboxamide 1-β-D-ribofuranoside
ad libitum fed
adenosine monophosphate AMP-activated protein kinase analysis of variance
ammonium persulfate adenosine triphosphate bovine serum albumin calcium chloride
Ca2+/calmodulin dependent protein kinase beta cyclic adenosine monophosphate
cystathionine β-synthase carbone dioxide
carnitine palmitoyltransferase 1 caloric restriction
cAMP response element binding protein diacyl-glycerol
Dulbecco’s modified eagle medium dimethyl sufoxide
deoxyribonucleic acid triphosphate dipeptidyl peptidase IV
dithiothreitol
European Collection of Animal Cell cultures ethylenediaminetetracetic acid
enzyme-linked immunosorbent assay endoplasmatic reticulum
fatty acid synthase foetal calf serum free fatty acid
forkhead box protein A2 forkhead box protein O forkhead box protein O1 fasting plasma glucose high fructose diet
fructose 2,6-biphosphate farnesoid X receptor
gestational diabetes mellitus glucagon-like peptide-1 glucose transporter glucose transporter 4 glucose-6-phosphate glucose -6-phosphatase glycogen synthase
GTT HDAC HF HMGCR HST IDDM1 IKKbeta IL-1β IL-6 IMCL iNOS INSIGs IR IRF3 IRF4 IRS IRS1 IRS2 JNK-1 KCl KG KHCO3 KH2PO4 IMCL LBW LCCoA LCFA LDH LDL LKB1 LXR LXRα MAR1 MAT1 MEF MgCL2 MgSO4 MLP mmHg MO25 mTOR MTT MW Na-azide NaCl NAD NADH NAFLD
glucose tolerance test histone deacetylase high fat diet
3-hydroxy-3-methylglutaryl coenzyme A reductase homologues of SIR2
insulin-dependent diabetes mellitus IkappaB kinase beta
interleukin-1β interleukin-6
intramyocellular lipid
inducible nitric oxide synthase insulin induced genes
insulin receptor tyrosine kinase interferon regulatory factor 3 interferon regulatory factor 4 insulin receptor substrate insulin receptor substrate 1 insulin receptor substrate 2 c- jun N-terminal kinase-1 potassium chloride
α –keto-glutarate
potassium hydrogen carbonate
potassium dihydrogen orthophosphate intramyocelular lipids
low birth weight
long chain acetyl-Coenzyme A long chain fatty acids
lactate dehydrogenase low density lipoprotein liver kinase B1
liver X receptor liver X receptor alpha mating-type regulator 1 ménage-a-trois protein 1 mouse embryonic fibroblasts magnesium chloride
magnesium sulphate maternity low protein diet milimeteres of mercury mouse protein 25
mammalian target of rapamycin
3-(4,5-dimethylthiazol-2-yl)-2,5-dipheyltetrazolium bromide molecular weight
sodium azide sodium chloride
nicotinamide adenine dinucleotide
nicotinamide adenine dinucleotide (reduced form) non-alcoholic fatty liver disease
NAMPT NaOH NCoR NEFA NHP NIDDM NMN NMNAT NR nPKCs OAA P PBS PCA PDC PDH PDHK4 PDK4 PEPCK PFK1 PFK2 PGC-1 PGC-1β PH PI PI3K PIP2 PIP3 PKB PKC PKC-ε PPAR PPAR PPI PP2C PRPP PTB PTK RCT RER RNA ROS RSK RXR SCAP SCD-1 SDS-PAGE SH2 shRNAi siRNA nicotinamide phosphoribosyltransferase sodium hydroxide
nuclear receptor co-repressor non esterified fatty acids non-human primates
non insulin dependent diabetes mellitus nicotinamide mononucleotide
NMN adenylyltransferase Nuclear Receptor
novel protein kinase C oxaloacetate
phosphate
phosphate buffered saline perchloric acid
pyruvate dehydrogenase complex pyruvate dehydrogenase
pyruvate dehydrogenase kinase 4 (protein) pyruvate dehydrogenase kinase 4 (gene) phosphoenolpyruvate carboxykinase 6-phosphofructo-1-kinase
6-phosphofructo-2-kinase
peroxisome proliferator-activated receptor gamma co-activator 1alpha peroxisome proliferator-activated receptor gamma co-activator 1beta pleskstrin homology
proinsulin
phosphatidylinositol 3-kinase
3′-phosphoinositides [phosphatidyl-inositol-3,4-bisphosphate phosphatidyl-inositol-3,4,5-trisphosphate
protein kinase B (also known as Akt) protein kinase C
protein kinase C-ε
peroxisome proliferator-activated receptor alpha peroxisome proliferator-activated receptor gamma preproinsulin
protein phosphate 2 C
nicotinamide and 5-phosphoribosyl-pyrophosphate phophotyrosine binding domanin
protein tyrosine kinase reverse cholesterol transport rough endoplasmatic reticulum ribonucleic acid
reactive oxygen species ribossomal S6 Kinase retinoid X receptor
SREBP cleavage-activating protein sterol CoA desaturase-1
sodium dodecyl sulphate-polyacrylamide gel electrophoresis src homology domain
short hairpin RNA interference small interfering RNA
SIR SIRT SIRT1 SIRT3 SIRT6 SMRT SREBP SREBP-1c SREBP -1α SREBP2 STRAD S6K TAG TAK1 TBC1D4 TG TNF- α TORC2 TSC TZDs T2DM VLDL WAT WNPRC XBP1 ZMP 4E-BP
silent information regulator
silent information regulator two orthologue silent information regulator two orthologue 1 silent information regulator two orthologue 3 silent information regulator two orthologue 6
silencing mediator of retinoid and thyroid hormone receptors sterol regulatory element binding
sterol regulatory element binding 1c sterol regulatory element binding 1alpha sterol regulatory element binding 2 Ste 20-related adapted protein p70 ribossomal protein S6 kinase triacylglycerol
transforming growth factor β-activated kinase TBC1 domain family member 4
triglycerides
tumour necrosis factor α
transducer of regulated CREB activity 2 tuberous sclerosis complex
thiazolidinediones type 2 diabetes mellitus very low density lipoprotein white adipose tissue
Wisconsin National Primate Research Center X-box binding protein 1
AICAR monophosphatase
1. GENERAL INTRODUCTION... 17
1.1 INSULIN ...19
1.1.1 Insulin Signalling Cascade ... 19
1.2 TYPE 2DIABETES MELLITUS ...23
1.2.1 Prevalence of T2DM ... 23
1.2.2 Characterization of T2DM ... 23
1.2.3 Hepatic glucose and lipid regulation in T2DM ... 24
1.2.4 Skeletal muscle glucose regulation in T2DM ... 25
1.2.5 T2DM in white adipose tissue ... 26
1.2.6 Insulin resistance as a primary factor of T2DM ... 26
1.2.7 Obesity-induced insulin resistance and T2DM ... 27
1.2.8 Treatment of T2DM ... 31
1.3 AMPK...32
1.3.1 AMPK as a pharmacological target ... 32
1.3.2 Functions of AMPK ... 33
1.3.3 AMPK structure, activation & post-translational modification ... 34
1.3.4 Upstream regulators of AMPK ... 35
1.3.5 AMPK activation and improved lipid-induced insulin resistance in T2DM ... 36
1.3.6 AMPK activation combats obesity by suppression of adipogenesis and adipocyte glucose uptake ... 36
1.3.7 AMPK opposes insulin’s anabolic actions mediated via mTORC1 ... 37
1.4 PPARΑ ...39
1.5 PGC-1Α ...40
1.6 CALORIE RESTRICTION ...41
1.6.1 Sirtuins ... 42
1.7 THE INTERACTING METABOLIC ROLES OF AMPK, THE LIPO-OXIDATIVE PPARS AND SIRTS 51 1.8 AIM OF THE THESIS ...53
2. MATERIALS AND METHODS ... 55
2.1 MATERIALS ...57
2.2 METHODS ...58
2.2.1 Cell Cultures ... 58
2.2.2 Animals ... 64
2.2.3 Common Methods used for cells and tissue preparation and analysis ... 78
3. STUDIES ON THE EFFECT OF EXPERIMENTAL DIETS ON THE REGULATION OF HEPATIC LIPOGENESIS. ... 91
3.1 INTRODUCTION ...93
3.2 MATERIALS AND METHODS ...93
3.3 RESULTS ...94
3.3.1 Effects of 24h starvation on hepatic lipid homeostasis ... 94
3.3.2 Effects of AMPK deletion... 99
3.3.3 Studies in hepatocyte cell culture: Effects of SIRT1 silencing ... 103
3.3.4 Effects of high-fat feeding and NMN treatment ... 107
3.4 DISCUSSION ... 115
4. STUDIES ON THE ROLES OF THE SIRT1-AMPK REGULATORY AXIS IN SKELETAL MUSCLE IN VIVO AND USING L6 MYOBLASTS ... 119
4.1 INTRODUCTION ... 121
4.2 METHODS ... 122
4.3 RESULTS ... 123
Studies of effects of AMPK deficiency in vivo using AMPK KO mice ... 123
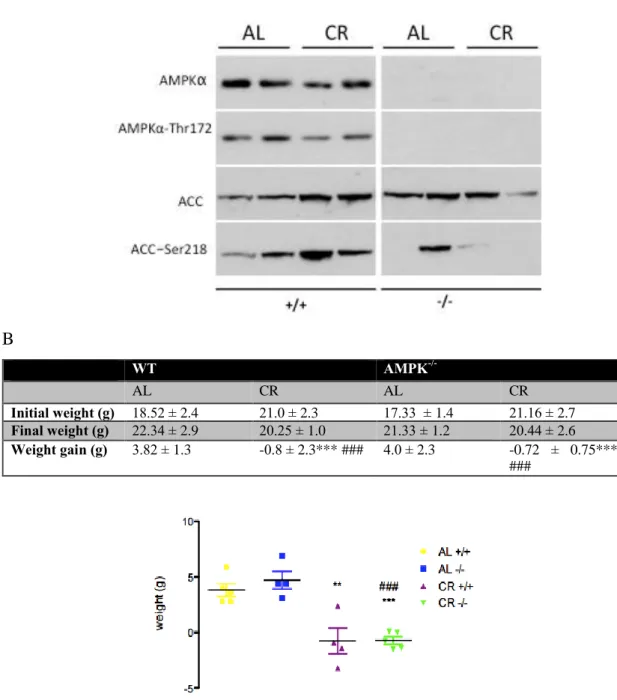
4.3.1 Loss of AMPKα1 and -2 subunits decreases AMPK protein expression in skeletal muscle of AL and CR-fed mice... 123
4.3.2 AMPKα1/2 knockout impairs CR-mediated improvements in all body glucose
tolerance ... 125
4.3.3 NAMPT gene expression in skeletal muscle is suppressed by AMPK deletion in fed mice, an effect blunted by CR ... 127
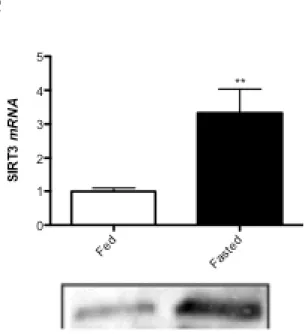
4.3.4 SIRT1, SIRT6 and SIRT3 gene expression tend to be suppressed by AMPK deletion in skeletal muscles of AL fed mice ... 128
4.3.5 PGC- 1α gene and protein expression and acetylation status ... 129
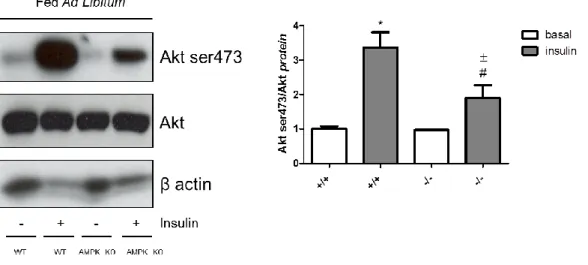
4.3.6 Loss of AMPK α1/2 attenuates insulin-mediated activation of Akt ... 131
4.3.7 Serum starvation augments phospho-AMPK protein expression but suppresses Akt phosphorylation in L6 myoblasts ... 133
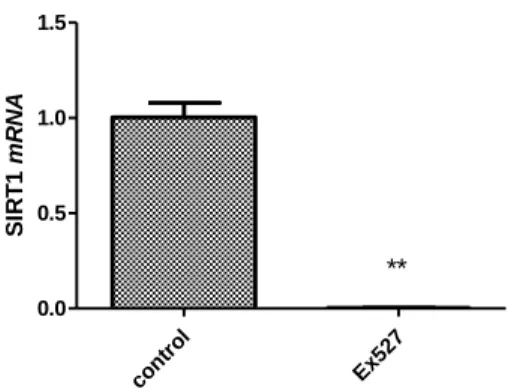
4.3.8 SIRT1 inhibition downregulates AMPK in starved L6 myoblasts ... 134
4.3.9 Effect of adiponectin on phosphoAMPK-Thr172 protein expression in serum-starved L6 myoblasts ... 136
4.3.10 Effect of insulin and adiponectin combined treatment on AMPK thr172 phosphorylation in L6 myoblasts ... 138
4.4 DISCUSSION ... 138
5. A KEY ROLE FOR INTERFERON REGULATORY FACTORS IN MEDIATING EARLY LIFE METABOLIC DEFECTS IN MALE OFFSPRING OF MATERNAL PROTEIN RESTRICTED RATS ... 145
5.1 INTRODUCTION ... 147
5.2 METHODS ... 148
5.3 RESULTS ... 149
5.3.1 Metabolic data for MLP offspring ... 149
5.3.2 MLP offspring display altered adipogenic and lipogenic gene expression ... 149
5.3.3 IRF3 and IRF4 supression is associated with adiponectin signaling ... 151
Adiponectin regulates IRF3 and IRF4 through AMPK and PPAR ... 153
5.3.5 The potential role of Adiponectin-AMPK-and IRF4 ... 155
5.3.6 Adiponectin-AMPK signalling may regulate IRF3 in white adipose tissue ... 157
5.4 DISCUSSION ... 157
6. GENERAL DISCUSSION ... 161
6.1 RECIPROCAL INTERACTION BETWEEN SIRT1 AND AMPK ... 163
6.2 ADIPONECTIN TARGETING OBESITY-RELATED T2DM ... 164
6.3 HEPATIC AND MUSCULAR LIPOGENESIS AS A RESPONSE TO NUTRITIONAL STATUS ... 165
6.4 AMPK-SIRT1 AXIS IMPROVES INSULIN-SIGNALING PATHWAY ... 165
6.5 SIRT3 AND SIRT6 ... 168
6.6 MECHANISM OF IRF3 AND IRF4 ON THE DEVELOPMENT OF OBESITY-RELATED T2DM IN MLP-OFFSPRING ... 169
6.7 CONCLUDING REMARKS ... 173
REFERENCESS……….…...175
Chapter:
1.1 Insulin
Insulin is a naturally-occurring peptide hormone synthesized and secreted by pancreatic β cells. The release of insulin from secretory granules is dependent on the ability of each granule to translocate to the cell surface and fuse with the plasma membrane [1].
1.1.1 Insulin Signalling Cascade
Glucose is an essential nutrient, supplying fuel for many different organs of the body, for which it is the sole source of energy. These include the brain and neurons in particular, as well as other organs and tissues, particularly those that lack (e.g. red blood cells) or have low oxidative capacity. Since glucose enters cells via facilitated diffusion, it is vital that blood glucose levels are maintained within a very narrow range, approximately 3.9 – 6.6 mM, depending on prandial state [2].
Insulin is the major hormone controlling critical energy functions such as glucose and lipid metabolism. Insulin activates the insulin receptor tyrosine kinase (IR), which phosphorylates and recruits different substrate adaptors such as the insulin receptor substrate (IRS) family of proteins (Fig. 1.1) [3]. The IR is a heterotetramer consisting of two α subunits and two β subunits that are linked by disulphide bonds. Insulin binds to the α subunit of the insulin receptor and activates the tyrosine kinase in the β subunit (Fig. 1.1). Once the tyrosine kinase of insulin receptor is activated, it promotes autophosphorylation of the β subunit, where phosphorylation of three tyrosine residues (Tyr1158, Tyr1162, and Tyr1163) is required for amplification of the
kinase activity [4]. Receptor activation leads to the phosphorylation of key tyrosine residues on IRS proteins, which interact with phosphatidylinositol (PI) 3-kinase (also known as PI3K, a lipid kinase). PI3K consists of a p110 catalytic subunit and a p85 regulatory subunit that possesses two Src homology 2 (SH2) domains that recognise the tyrosine-phosphorylated residues in IRS proteins [5] (Fig. 1.1). The activated PI3K phosphorylates 3′-phosphoinositides [phosphatidyl-inositol-3,4-bisphosphate (PIP2) generating phosphatidyl-inositol-3,4,5-trisphosphate (PIP3) [6], which bind to the phosphoinositidedependent kinase 1 (PDK1). Known substrates of the PDKs are Akt, also known as protein kinase B (PKB), and also atypical forms of the protein kinase C (PKC) [7]. Once active, Akt enters the cytoplasm where it functions to regulate a range of cellular metabolic functions in tissues such as the liver, skeletal
muscle and white adipose tissue, which serve to regulate glucose and lipid homeostasis [8].
1.1.1.1 Insulin-mediated glycogen regulation
With respect to glycogen metabolism in liver and skeletal muscle, Akt induces the phosphorylation and inactivation of glycogen synthase kinase 3 (GSK3) (Figure 1.1). A major substrate of GSK3 is glycogen synthase, an enzyme that catalyses the final step in glycogen synthesis. Phosphorylation of glycogen synthase by GSK3 inhibits glycogen synthesis; therefore insulin-mediate inactivation of GSK3 by Akt promotes glucose storage as glycogen [9].
1.1.1.2 Insulin-mediated regulation hepatic glucose production
In addition to promoting glucose storage, insulin inhibits the production and release of glucose by the liver by blocking gluconeogenesis and glycogenolysis [5]. Insulin directly controls the activities of a set of gluconeogenic enzymes by phosphorylation and dephosphorylation events leading to regulated expression of hepatic gluconeogenesis genes. Forkhead box protein O1 (FOXO1) stimulates expression of gluconeogenic genes (e.g. PEPCK and suppresses genes involved in glycolysis and lipogenesis, including glucokinase and the transcription factor steroid regulatory element-binding protein (SREBP)-1c, respectively [5]. Insulin induces phosphorylation of FOXO1, in an Akt-dependent manner, resulting in nuclear exclusion of FOXO1 and repression of gluconeogenic gene expression.
1.1.1.3 Insulin-mediated glucose uptake
Insulin also promotes glucose uptake in skeletal muscle, adipose tissue and liver, in a process mediated by glucose transporters from the GLUT family. GLUT4 is distinguished from the other glucose transporters as a high-affinity, insulin-responsive glucose transporter protein that is highly expressed in muscle and adipose tissue [10]. Insulin activates GLUT4, in a process mediated by Akt signalling, which results in GLUT4 translocation to the cell surface to transport glucose into the cell [11].
white adipose tissue (WAT). It is well known that insulin stimulates the redistribution of GLUT4 from intracellular compartment to plasma membrane in adipocytes [14]. As a result, increased postprandial blood glucose was transported into adipose tissue through GLUT4. In addition, insulin increases the activity of lipoprotein lipase on adipose cell surface, leading to the lipolysis of serum lipoprotein and subsequent uptake of free fatty acids (FFA) into adipose tissue. Insulin-induced increase of glucose and FFA uptake is important as substrate supply in efficient triglyceride synthesis in adipocytes [15].
Data from Akt knockout mouse models offer a clearer answer to the question of whether Akt is required for normal glucose homeostasis. While disruption of Akt1 isoform in mice did not cause any significant perturbations in metabolism, mice with a knockout of the Akt2 isoform show insulin resistance, ending up with a phenotype closely resembling type 2 diabetes in humans [16, 17]. Consistently, recent studies of inherited insulin post-receptor mutations in humans detected a missense mutation in the kinase domain Akt2 in a family of severely insulin resistant patients. The mutant kinase was unable to phosphorylate downstream targets and to mediate inhibition of phosphoenolpyruvate carboxykinase (PEPCK), a gluconeogenic key enzyme [18]. Taken together, studies of transgenic mice and rare human genetic syndromes suggest that the impairment of insulin activity leading to insulin resistance is linked to insulin signalling defects, and specifically, impaired Akt signalling.
Figure 1.1
Figure 1.1: Insulin signaling pathway. SREBP: sterol regulatory element-binding protein; IRS: insulin receptor substrate, PI3-K: phosphoinositide 3 kinase (composed of a heterodimer between a p110 subunit and a p85 subunit); PDK1: phosphoinositide-dependent kinase 1; pAkt: phosphorylated protein kinase B (also known as PKB); pGSK3: phosphorylated glycogen synthase kinase 3; mTOR: mammalian target of rapamycin. These molecules act in a coordinated manner to regulate glucose, lipid and protein metabolism.
In summary, insulin plays a central role in the regulation of blood glucose levels and acts in a coordinated fashion to stimulate protein and lipid metabolism by modifying the activity of various enzymes and/or transport proteins [3]. Insulin stimulates glucose uptake and the anabolic pathways of glycogenesis (synthesis of glycogen), lipogenesis [synthesis of long chain fatty acids (LCFA) and their subsequent esterification as triacylglycerol (TAG)] and cholesterol synthesis. Concurrently, insulin suppresses glycogenolysis (hydrolysis of glycogen) and lipolysis (hydrolysis of TAG). Other metabolic effects include suppression of hepatic gluconeogenesis (de
novo glucose synthesis), hepatic very-low-density-lipoprotein (VLDL) secretion,
amino acids, and stimulation of protein synthesis. The overall role of insulin, therefore, is to promote anabolism [19].
1.2 Type 2 Diabetes Mellitus
1.2.1 Prevalence of T2DM
Type 2 diabetes mellitus (T2DM) has become a leading health problem throughout the world, accounting for almost 90% of all cases of diabetes in adults worldwide [20]. Once thought of as a disease of the Western world, the prevalence of T2DM is increasing at alarming rates in developing countries [21]. The emerging pandemic is driven by the combined effects of population ageing, rising levels of obesity and inactivity, and greater longevity among patients with T2DM that is attributable to improved management [22]. According to a study by Sardinha et al. in 2012 of a representative sample of 9447 individuals, overweight and obesity now affects 66.6% of Portuguese males and 57.9% of Portuguese females [23]. Since obesity is unequivocally linked to T2DM [24], its prevalence is also expected to increase significantly in coming years. As a result of this epidemic increase in T2DM prevalence, a progressive change is predicted in the epidemiological view of various pathologies, including coronary artery disease, stroke, diabetic retinopathy and neuropathy, and chronic renal failure [24]. Worldwide, it is projected that by 2025 there will be 380 million people with T2DM and 418 million people with impaired glucose tolerance, impacting significantly in economic terms as well as resulting in increased morbidity and mortality [20, 22].
1.2.2 Characterization of T2DM
T2DM is defined by a fasting plasma glucose (FPG) equal or higher than 126 mg/dl or 7 mmol/l [25]. T2DM, associated with ageing and obesity, is characterized by altered lipid and glucose metabolism (fasting or postprandial hyperglycaemia, dyslipidemia) as a consequence of combined insulin resistance in skeletal muscle, liver and adipose tissue and relative defects of insulin secretion by β cells that may arise due to an imbalance between energy intake and expenditure [5]. A degree of hyperglycaemia sufficient to cause pathological and functional changes in various
target tissues, but without clinical symptoms, may be present for a long period of time before T2DM is detected. During this asymptomatic period, it is possible to demonstrate an abnormality in carbohydrate metabolism by measurement of plasma glucose in the fasting state or after a challenge with an oral glucose load [25]. In the natural history of T2DM, pancreatic β cells initially compensate for insulin resistance by increasing insulin secretion, but with time, progressive β cell failure leads to insulin deficiency, and hyperglycaemia ensues [26]. The chronic hyperglycaemia of T2DM is associated with long-term damage, dysfunction, and failure of different organs, especially the eyes, kidneys, nerves, heart, and blood vessels [25, 27]. The aetiology of the disease remains unclear, but T2DM can now be described as complex polygenic disease with a strong genetic component, as indicated by the high prevalence in certain ethnic groups and by studies of identical twins [28-31]. Nevertheless, the rapid increase in the prevalence of obesity-associated disease conditions, (including T2DM) in worldwide populations, suggests the contribution of environmental factors. A widely accepted explanation implicates the frequent consumption of processed foods with a high-calorie content and the reduction in physical exercise due to sedentary lifestyle in modern urban environment, as a major cause of obesity and subsequent insulin resistance and T2DM [32, 33]. Indeed, it is well known that obesity itself causes some degree of insulin resistance [34]. Lifestyle changes, consisting of diet and exercise is often an effective measure to improve glucose tolerance in the early stages of T2DM, often complemented with anti-diabetic drugs or insulin therapy [35, 36].
1.2.3 Hepatic glucose and lipid regulation in T2DM
The liver plays a major role in maintenance of glucose homeostasis through control of glucose production and uptake. This is achieved through regulation of glucose uptake and utilisation through glycolysis and glycogenesis and glucose production via glycogenolysis and gluconeogenesis. These processes are particularly important considering raised blood glucose levels are a characteristic of T2DM and the metabolic syndrome [37].
promotes glycogen synthesis and de novo lipogenesis while also inhibiting gluconeogenesis and glycogenolisis. In the fasted state, insulin secretion is decreased as a result of lower blood glucose concentrations. The drop in insulin (as well as the increased action of other hormones, including glucagon) leads to increased hepatic gluconeogenesis and glycogenolysis and resultant elevated hepatic glucose production. This regulatory system is impaired in T2DM, leading to abnormally increased hepatic glucose production, which contributes significantly to hyperglycaemia.
Hepatic lipid production diminishes while adipose lipolysis increases. In T2DM, ectopic lipid accumulation impairs insulin signalling. With accumulation of intramyocellular lipid (IMCL), insulin-mediated skeletal muscle glucose uptake is impaired. In the liver, increased lipid accumulation also impairs the ability of insulin to regulate gluconeogenesis and activate glycogen synthesis. In contrast, lipogenesis remains unaffected and, together with the increase delivery of dietary glucose, leads to increased lipogenesis and worsening non-alcoholic fatty liver disease (NAFLD), very common in obesity-associated T2DM [37].
1.2.4 Skeletal muscle glucose regulation in T2DM
Under hyperglycemic, hyperinsulinemic conditions, muscle glycogen synthesis is the major pathway for glucose metabolism in both normal and diabetic individuals, and defective muscle glucose uptake and glycogen synthesis play a major role in causing insulin resistance in patients with T2DM [38]. Defects in the ability of insulin to activate enzymes in glycogen synthase, hexokinase II, and enzymes in glucose transport have all been implicated in the loss of skeletal-muscle glycogen synthesis in type 2 diabetics, making each of the corresponding biochemical events a potential target for antidiabetic therapy [38].
Insulin-mediated translocation of GLUT4 to the muscle sarcolemmal membrane is impaired in patients with T2DM [39, 40]. Thus, a defect in skeletal-muscle glucose transport was implicated as the cause of reduced insulin-mediated glucose metabolism in patients with T2DM in two independent studies [39, 40]. Moreover, the results of
these studies suggested that ectopic accumulation of lipid within the muscle cell might be the cause of insulin resistance.
In healthy fed individuals, in the skeletal muscle, insulin increases glucose transport through GLUT4, facilitating glucose entry and glycogen synthesis. On the other hand, in fasting conditions, glycogen synthesis stops and glycogenolysis takes place, generating glucose-1-phosphate, which is converted to glucose-6-phosphate, which is subsequently converted in glucose (plus a phosphate group), by the enzyme glucose -6-phosphatase. At the same time, gluconeogenesis takes place in the liver. Both processes are important to produce enough glucose to feed the muscle under these conditions. In T2DM, ectopic lipid accumulation impairs insulin signalling as mentioned above. With accumulation of intramyocellular lipid (IMCL), insulin-mediated skeletal muscle glucose uptake is impaired. Glycogenolysis occours and glucose transport as well as glycogen synthase are inhibited [37].
1.2.5 T2DM in white adipose tissue
In white adipose tissue (WAT), insulin suppresses lipolysis and promotes lipogenesis during the fed state. During fasting, adipose TAG lipolysis increases while hepatic lipid production diminishes. Impaired insulin action in adipose tissue allows for increased lipolysis, which will promote inappropriate direction of lipids to other tissues (such as liver) and further exacerbates insulin resistance. Coupled with a decline in pancreatic β cells, hyperglycemia develops [37].
1.2.6 Insulin resistance as a primary factor of T2DM
Although the primary factors causing T2DM are unknown, it is clear that insulin resistance, which can be defined as a state of reduced responsiveness to normal circulating levels of insulin, plays a major role in its development. Evidence for this comes from: a) cross-sectional studies demonstrating the consistent presence of insulin resistance in patients with T2DM [41]; b) the presence of insulin resistance in non-diabetic offspring of patients with T2DM [42]; c) prospective studies
development of T2DM [41, 42]; d) prevention of diabetes by insulin-sensitizing agents [43, 44].
1.2.7 Obesity-induced insulin resistance and T2DM
Insulin resistance is defined as a subnormal biologic response to a given concentration of insulin. Virtually all patients with T2DM have some degree of insulin resistance [45].
Lipid accumulation in skeletal muscle and liver may be a result of increased delivery/synthesis of FA to/in these tissues in states in which energy intake exceeds adipose tissue storage capacity (as seen in obesity and lipodystrophy), or a consequence of either acquired or inherited mitochondrial dysfunction. In 1963, Randle et al. [46] suggested that elevated non esterified fatty acids (NEFA) concentrations were associated with “several abnormalities of carbohydrate metabolism, common to many endocrine and nutritional disorders.” The first of these abnormalities described was impaired sensitivity to insulin. Insulin resistance associated with longer-term lipid overload is now considered to involve accumulation of lipids in insulin-responsive tissues other than adipose tissue, so- called ectopic fat deposition [47]. The detrimental effects on insulin sensitivity and other cellular processes are known as lipotoxicity [48]. It should be noted that is not only pure plasma NEFA elevation that is responsible for insulin resistance—plasma TAG concentrations are also increased [38].
In skeletal muscle, insulin resistance manifests primarily as a reduction in insulin-stimulated glycogen synthesis, which is in turn a consequence of reduced glucose transport into the myocyte. The coordinated intracellular response to insulin requires a complex signaling pathway. In muscle, insulin binds to its receptor, activating the receptor tyrosine kinase activity, with subsequent phosphorylation and activation of insulin-receptor substrate 1 (IRS1). When phosphorylated, IRS1 activates PI3K. This enzyme, through signaling intermediates, activates Akt2, which phosphorylates and inactivates AS160, a protein that prevents translocation of GLUT4 through its interaction with Rab proteins. Thus, insulin promotes the docking and fusion of GLUT4-containing vesicles to the plasma membrane [49] (Fig. 1.2).
Figure 1.2
Figure 1.2: Muscle insulin-resistance. DAG: diacylglycerol; GLUT4: glucose transporter: 4 G6P, glucose 6-phosphate: GSK3: glycogen synthase kinase- 3; IRS: insulin receptor substrate; IKK-β: IkB kinase-β; JNK-1: Jun kinase-1; LCCoA: long-chain acylcoenzyme A; nPKCs: novel protein kinase Cs; PI 3-kinase: phosphoinositol 3-kinase; PIP2: phosphatidylinositol 4,5-bisphosphate; PIP3: phosphatidylinositol (3,4,5)-trisphosphate; PTB: phosphotyrosine binding domain; PH: pleckstrin homology domain; SH2: src homology domain, UDP-glucose: uridindiphosphat-glucose. Adapted from Savage, Petersen and Shulman 2007.
Peterson and his collaborators discovered that an impaired mitochondrial function with a lower rate of conversion of diacyl-glycerol (DAG) to triglycerides (TGs) (due to a genetic predisposition) would lead to intracellular DAG accumulation, which impairs insulin-signalling pathways [50].
In the liver, insulin resistance is associated with a reduced ability of insulin signalling to inhibit glucose production, whereas somewhat paradoxically insulin-stimulated lipogenesis seems to be enhanced [51]. Increases in intracellular DAG, due to increased lipogenesis and/or decreased mitochondrial FA oxidation, activate PKC-ε (protein kinase C-ε), which binds to and inactivates the insulin receptor kinase resulting in reduced insulin-stimulated IRS-1 and IRS-2 tyrosine phosphorylation.
activation results in lower GSK3 phosphorylation and lower FOXO phosphorylation, which in turn results in lower insulin-stimulated liver glycogen synthesis and decreased suppression of hepatic gluconeogenesis, respectively [51] (Fig. 1.3).
Figure 1.3
Figure 1.3: Liver insulin-resistance. DAG, diacylglycerol; FOXO, forkhead box protein O; GLUT2, glucose transporter2; G6P, glucose 6-phosphate; GSK3, glycogen synthase kinase- 3; IRS, insulin receptor substrate; IKK-β, IkB kinase-β; JNK-1, Jun kinase-1; LCCoA, long-chain acylcoenzyme A; nPKCs, novel protein kinase Cs; PEPCK, phosphoenolpyruvate carboxykinase; PIP2: phosphatidylinositol 4,5-bisphosphate; PIP3: phosphatidylinositol (3,4,5)-trisphosphate PI 3-kinase, phosphoinositol 3-kinase; PTB, phosphotyrosine binding domain; PH, pleckstrin homology domain; SH2, src homology domain. Adapted from Savage, Petersen and Shulman 2007.
The tyrosine phosphorylation of IRS1 and associated activation of PI3K are impaired in rodent models of insulin resistance in liver, muscle tissue and adipose tissue [3, 52-54]. Similarly, IRS1-associated PI3K activity is greatly reduced in muscles of individuals being given a five-hour intra-lipid infusions (1.5ml/min), indicating that the lipid-induced reduction in insulin-stimulated glucose transport was attributable to a defect in insulin signaling [55].
As well as reinforcing the importance of life-style interventions in the management of T2DM, dietary restriction to limit the stress on energy stores, and exercise to increase mitochondrial number and function, these ideas about the molecular pathogenesis of insulin resistance have provided several new therapeutic targets for the treatment and possible prevention of T2DM [51]. Savage, Petersen and Shulman [51] suggest that insulin resistance in skeletal muscle is the earliest event in the pathogenesis of T2DM in most patients. Muscle insulin resistance is, in turn, associated with peripheral and portal vein hyperinsulinemia, which promotes hepatic steatosis, at least in part by inducing SREBP-1c-mediated de novo lipogenesis and inhibiting fatty acid oxidation. Research conducted by Wolfram et al. [56] suggests that hyperinsulinemia induces nuclear exclusion and inhibition of forkhead box protein A2 (FOXA2), a regulator of fatty acid oxidation. In time, this leads to lipid accumulation in the liver, hepatic insulin resistance, and ultimately T2DM. Adipocyte dysfunction due to either obesity or lipodystrophy is associated with excessive and untimely delivery of fatty acids to the liver and skeletal muscle and probably contributes to insulin resistance in both organs, by altering the balance between fatty acid uptake/synthesis and disposal leading to increases in intracellular lipid content [38] (Fig. 1.4).
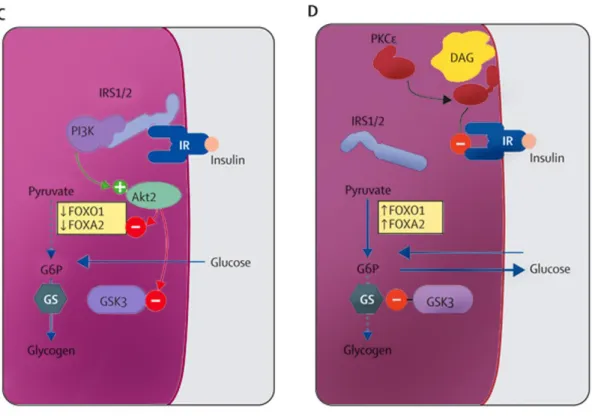
Figure 1.4: Obesity induced insulin resistance (A) Insulin-sensitive muscle. (B) Insulin-resistant muscle. (C) Insulin-sensitive liver. (D) Insulin-resistant liver. IRS=insulin-receptor substrate. IR=insulin receptor. PI3K=1-phosphatidylinositol 3-kinase. GLUT4=glucose transporter 4. DAG=diacylglycerol. PKC=protein kinase C. Ser=serine. Thr=threonine. FOX01=forkhead box O1. FOXA2=forkhead box A2. G6P=glucose-6-phosphate. GS=glycogen synthase. GSK=glycogen synthase kinase. Green circle with plus sign represents activation. Red circle with minus sign represents inactivation. Solid line with arrowhead represents increase or accumulation of substrate. Dotted line indicates inhibition of pathway. Adapted from Samuel et al. 2010.
1.2.8 Treatment of T2DM
Non-pharmacological approaches including diet modification, weight control, regular exercise and patient education are used as first-line therapy for the management of T2DM and remain important for optimization of metabolic control. When lifestyle modification fails to achieve or sustain adequate glycemic control, insulin or oral anti-diabetic agents are typically used to manage the disease [36].
1.2.8.1 Oral agents
Treatment options with oral agents are quite diverse, including metformin (insulin sensitising, primarily via inhibition of hepatic glucose production), thiazolidinediones (TZDs) (insulin sensitising PPARγ ligands/activators), α-glucosidase inhibitors (inhibition of gut glucose absorption) and sulphonylureas (β cell insulin secretagogues) [36]. Several new drugs with glucose-lowering efficacy offering certain advantages have recently become available, such as injectable glucagon-like peptide-1 (GLP-1) agonists and oral dipeptidyl peptidase-IV (DPP-IV) inhibitors. These drugs exacerbate the effects of the incretin pathway, leading to elevated glucose-stimulated insulin secretion, reduced gastric emptying and direct action on the hypothalamus to suppress appetite and ultimately, normalised fasting and postprandial glycaemia [57].
Metformin is typically prescribed as the first-line therapy following life-style changes, followed by co-prescription of other therapies if adequate glycaemic control is not maintained. The choice of therapy usually depends on a number of factors, including age of patient and presence of contraindications [58].
1.3 AMPK
1.3.1 AMPK as a pharmacological target
Several studies have reported that AMP-activated protein kinase (AMPK), a phylogenetically conserved serine/threonine protein kinase, is one of the probable targets of major anti-diabetic drugs in particular metformin, and of insulin sensitizing adipokines (e.g., adiponectin), which are in turn target of TZD’s [58-60]. Evidence accumulated over the past few years indicates that AMPK acts as an integrator of regulatory signals monitoring systemic and cellular energy status, thus providing powerful validation of the concept of targeting the AMPK pathway for the treatment of T2DM [36].
1.3.2 Functions of AMPK
ATP hydrolysis provides the energy required for cellular functions. Thus, cells require strategies to ensure that adequate regeneration of ATP (from ADP and Pi) is
maintained. ATP regeneration must be matched to cellular ATP demand, which varies with cellular functions, such as muscle cell contraction, hepatic synthesis of glucose, adipocyte-dependent synthesis of TAG, cellular synthesis of proteins or pancreatic β cell insulin secretion. In addition, many metabolic stressors including glucose deprivation, poisoning and hypoxia, lower ATP availability and therefore require adjustments to conserve ATP expenditure, in order to allow the cell survive. AMPK responds to a requirement to increase cellular ATP production and/or conserve available ATP. AMPK is activated by a decline in intracellular ATP concentrations, which, through the adenylate kinase reaction, concomitantly elevates intracellular ADP and AMP concentrations. As a consequence, AMPK activation occurs in response to a rise in AMP associated with metabolic stresses that interfere with ATP production (e.g., hypoxia or glucose deprivation) or accelerated ATP consumption (e.g., muscle contraction), so as to preserve or maintain tissue function [19]. More recently, not only AMP but also ADP, has been shown to activate mammalian and yeast AMPK and thus, a rise in intracellular ADP may equally be important for AMPK activation [61].
AMPK achieves its capacity to control cellular energy balance by switching on ATP generating catabolic pathways and switching off ATP consuming anabolic pathways. Thus, for activating catabolism and production of ATP, AMPK increases the following processes; long-chain fatty acid (LCFA) uptake into skeletal muscle and its mitochondrial oxidation; glucose uptake and glucose and glycogen breakdown. Conversely, in order to preserve cellular ATP, AMPK supresses anabolic pathways, such as glycogen, lipid and protein synthesis and gluconeogenesis [19].
The acute metabolic actions of AMPK are particularly important in insulin-responsive tissues, such as liver, cardiac and skeletal muscle, adipose tissue and the pancreatic β cell. Through phosphorylation of key downstream targets, AMPK can regulate essential metabolic fluxes, such as glycemic control, insulin action, insulin secretion and metabolic substrate selection. In poorly controlled T2DM, AMPK plays an
essential role in opposing hyperglycemia, through its glucose-lowering effect, follow activation by metformin. It is also important in preventing lipid-induced insulin resistance, because of its capacity to inhibit adipocyte lipolysis and to promote LCFA uptake, suppressing circulating lipid levels. Furthermore, by stimulating mitochondrial LCFA oxidation, AMPK can attenuate ectopic lipid accumulation in skeletal muscle and liver [19, 62]. Taken together the physiological functions of AMPK and the suspected role of AMPK in metabolic disorders, activation of AMPK pathway appears as a promising tool to prevent and/or to treat metabolic disorders, in particular, obesity, insulin-resistance and T2DM.
1.3.3 AMPK structure, activation & post-translational modification
AMPK is a heterotrimer of three subunits: α, β and γ subunits, appearing in several isoforms with different action properties [19, 62, 63] (Fig.1.5). The α-subunit (α1 and
α2 in mammals) contains the catalytic site whereas regulatory β- (β1 and β2) and γ- (γ1,
γ2 and γ3) subunits are important to maintain the stability of the heterotrimeric
complex. The β subunit contains a central region that allows AMPK complex to bind glycogen. The γ subunit contains four tandem repeats known as cystathionine β-synthase (CBS) motifs and each one of them bind one molecule of an adenine nucleotide in a mutually exclusive manner (Fig. 1.5). Charge occupations depend on the relative intracellular concentrations of AMP, ADP and ATP, which means, depend on the ‘energy state’ of the cell (Fig. 1.5) [19, 62, 63]. ADP, like AMP, stimulates AMPKα (Thr172) phosphorylation but, unlike AMP, ADP does not directly activate
Figure 1.5
Figure 1.5: Mechanisms regulating AMP-activated protein kinase activity. AMPK is composed of three subunits (α, β and γ) shown within the oval area delimited by the dashed membrane. Arrow-headeddashed lines indicate mechanisms of regulation. AICAR: 5-aminoimidazone-4-carboxmide-1- β-D-ribofuranoside; AMPK: AMP-activated protein kinase; CAMKKβ: Ca2+-calmoduline dependent protein kinase kinase β; MO25: Mouse protein 25; P: Phosphate, PP2C: Protein phosphate 2 C; SIRT1: Sirtuin 2 orthologue; STRAD: Ste 20-related adaptor protein; ZMP: AICAR monophosphatase.
1.3.4 Upstream regulators of AMPK
AMPK upstream kinases include liver kinase B1 (LKB1), which also activates additional kinases of the AMPK family [64], and the Ca2+-calmodulin-dependent protein kinase kinase β (CaMKKβ) [61, 63] (Fig. 1.5). LKB1, originally identified as a tumor suppressor, exists as a complex with two accessory subunits, STRAD and MO25. Studies have suggested that constitutive activity of the LKB1 complex is required to promote activation by the AMP-dependent pathway [65]. However, recent studies indicate that cytosolic localization and activity of LKB1 can be governed by LKB1 acetylation status in the liver (Fig. 1.5) [66]. The phosphorylation status of AMPKα (Thr172) is also determined by the rate of phosphor-AMPKα (Thr172)
dephosphorylation, catalyzed by AMPK phosphatases (Fig 1.5). Dephosphorylation is slower when either AMP or ADP is bound to the γ subunit, such that net AMPKα
(Thr172) is increased and AMPK activity is sustained. AMPK phosphatases include members of the protein phosphatase 2C (PP2C or PPM1) family [19] (fig. 1.5).
1.3.5 AMPK activation and improved lipid-induced insulin resistance in T2DM
As described in section 1.1, in insulin-responsive tissues, insulin signalling is initiated following the binding of insulin to the cell surface insulin receptor, a member of the receptor protein tyrosine kinase superfamily. Insulin binds to the leucine-rich C-terminal domains in two extracellular α chains. This results in conformational change that brings the two transmembrane/intracellular β chains (which each contain a PTK domain) into closer association, stimulating auto- and trans- phosphorylation of tyrosine residues on the β chains. In turn, this initiates an intracellular signalling cascade, which phosphorylates tyrosine residues on downstream target proteins, including the insulin receptor substrate (IRS) proteins. Most insulin responses are initiated through IRS1 and IRS2; both of them are expressed in the main insulin target tissues (skeletal muscle, heart, adipocyte and liver) as well as in the pancreatic β cell. Defects in phosphorylation of tyrosine residues on the insulin receptor β chains and on the IRS proteins represent a central feature of the impaired insulin-stimulated uptake of glucose into striated muscle seen in lipid-induced insulin-resistance. Impaired insulin signalling related to reduced IRS tyrosine phosphorylation is associated with excessive intracellular lipid accumulation [38]. Activation of AMPK promotes acute oxidation of LCFA, an opposite action to that of insulin. Increased LCFA oxidation (induced by AMPK activation) can suppress glucose breakdown through substrate competition (the glucose/FA cycle) and, therefore, can lower ectopic lipid accumulation, improving insulin signaling. LCFA oxidation directly inhibits glucose transport and phosphorylation and high rates of LCFA exert an acute and sustained inhibitory effect in glucose oxidation [19].
1.3.6 AMPK activation combats obesity by suppression of adipogenesis and adipocyte glucose uptake
TAG accumulation in mature adipocytes resulting in adipocyte hypertrophy. Although insulin and AMPK have opposite effects on adipogenesis and adipocyte glucose uptake, effects of AMPK activation to suppress adipogenesis and adipocyte glucose uptake are beneficial in metabolic diseases (such as T2DM) associated with obesity since they attenuate expansion of the adipose tissue mass and the development of obesity. Increases in AMPK activity caused by administering AICAR in vivo are associated with anti-obesity and insulin-sensitising effects [67]. Importantly, AICAR-induced AMPK activation evokes a reduction in fat mass without any evidence of ectopic lipid deposition, even though it does not increase ATP demand [68].
The PPAR subtypes (α, β/δ and γ) are transcription factors of the nuclear hormone receptor superfamily. PPARs are activated by lipid-derived ligands and thereby act as sensors of “lipid status”, translating nutritional signals into metabolic responses. PPAR activation is potentially important for the correction of dyslipidemia and the associated hyperglycemia in T2DM: PPARγ activation augments white-adipocyte glucose uptake and lipid storage, whereas activation of PPARs α and β/δ promote lipid clearance via oxidation in liver and striated muscle. PPARγ activation is necessary and sufficient for differentiation of pre-adipocytes into adipocytes (increasing the storage capacity for TAG), and is essential for the survival of the differentiated adipocyte [69]. The AMPK activator AICAR inhibits adipogenesis in 3T3-L1 or F442A preadipocytes [70, 71], and suppresses PPARγ mRNA expression in cultured adipocytes [72].
1.3.7 AMPK opposes insulin’s anabolic actions mediated via mTORC1
The mammalian target of rapamycin (mTOR) is a Ser-/Thr- protein kinase that operates as a catalytic subunit in two multimeric signalling complexes, mTORC1and mTORC2 [73-75]. mTORC1 activation promotes anabolism, including protein and lipid/sterol synthesis [76], ketogenesis [77] and inhibition of autophagy [78]. The mTORC2 complex has emerged as a strong candidate kinase for hydrophobic domain phosphorylation of the insulin-signalling kinase Akt [79]. In mTORC2, mTOR is complexed with mLST8 (also known as GβL, G protein β-like), mSin and RICTOR (Rapamycin-Insensitive Companion of mTOR, a positive regulator of mTORC2). Tissue-specific knock-out of RICTOR in adipose tissue decreases insulin-stimulated
glucose uptake and GLUT4 translocation [80].
A widely-accepted pathway of mTORC1 activation involves activation of PI3K and Akt. Akt on mTOR has now been identified as mTOR(Ser1261), and phosphorylation of this site may initially regulate mTOR activity in mTORC1 [81]. In contrast to phosphorylation of Ser2448, Ser2481 and Ser1261, phosphorylation of mTOR (Ser2446) by AMPK inhibits mTOR protein kinase activity, and this phosphorylation is increased by nutrient deprivation but suppressed by insulin [82].
Thus, to summarise, whereas insulin stimulates mTORC1 activity, AMPK inhibits it, thereby opposing insulin’s anabolic actions mediated via mTORC1. Nonetheless, AMPK activation can oppose the development of insulin resistance in skeletal muscle induced by nutrient excess (exposure to high glucose or high glucose plus branched chain amino acids), which has been proposed to be secondary to mTOR hyperactivation [83]. These authors suggested that down-regulation of AMPK activity in skeletal muscle in response to nutrient excess precedes mTOR activation and, moreover, that AMPK activation by AICAR diminishes mTOR signalling and insulin resistance in concert.
The livers of insulin-resistant, diabetic mice manifest selective insulin resistance, suggesting a bifurcation in the insulin-signaling pathway: Insulin loses its ability to block glucose production (i.e., it fails to suppress PEPCK and other genes of gluconeogenesis), yet it retains its ability to stimulate fatty acid synthesis (i.e., continued enhancement of genes of lipogenesis). Enhanced lipogenesis is accompanied by an insulin-stimulated increase in the mRNA encoding SREBP-1c [84]. Li et al. have shown that exposure of rat hepatocytes to insulin produced a sugnificnt increase in SREBP-1c mRNA and a significant decrease in PEPCK mRNA. Insulin-mediated changes in both mRNAs are blocked by inhibitors of PI3K and Akt, indicating that these kinases are required for both pathways. In contrast, subnanomolar concentrations of rapamycin, an inhibitor of the mTORC1 kinase, blocked insulin induction of SREBP-1c, but had no effect on insulin suppression of PEPCK. A similar selective effect of rapamycin was observed in livers of rats and
pathway for hepatic lipogenesis but not gluconeogenesis, and may help to resolve the paradox of selective insulin resistance in livers of diabetic rodents.
1.4 PPARα
Peroxisome proliferator activated receptor-alpha (PPARα), along with PPAR and PPAR, is a member of the nuclear hormone receptor superfamily. At binding of their ligand, PPARs form heterodimers with 9-cis retinoid X receptors (RXRs) and bind to DNA response elements in target gene promoter regions. Forming a heterodimer with RXRα, PPARα binds to a DNA response element, namely the nuclear receptor response element (NRRE). At binding of the NRRE within the promoter of PPAR target genes, gene transcription is activated. Induction of PPARα gene targets requires the interaction of PPARα with PGC-1, often in complex with other enzymes and co-activators. Formation of these complexes is required for full transcriptional induction of PPARα targets in a variety of tissues. [85-87]. The main physiological function of PPARα appears to involve control of critical genes in lipid and lipoprotein metabolism. Thus, PPAR regulates lipid uptake and oxidation, in contrast with that of PPARγ, which promotes uptake but subsequent storage of lipid as TAG in adipose tissue [85, 88]. PPARα expression is relatively high in hepatocytes, enterocytes, vascular and immune cell types such as monocytes/macrophages, endothelial cells, smooth muscle cells, skeletal muscle, lymphocytes, non-neuronal cells like microglia and astroglia [89]. PPARα target genes include carnitine palmitoyltransferase I (CPT I), mitochondrial 3-hydroxy-3-methylglutaryl-CoA synthase (the rate limiting enzyme of ketogenesis), peroxisomal acyl-CoA oxidase (peroxisomal β-oxidation), and microsomal cytochrome P450 (CYP) FA ω-hydroxylases. Thus, PPARα plays a critical role in maintenance of lipid homeostasis (oxidation and production) [86]. In the fasting state, PPARα is activated by adipose-derived FAs, thereby enhancing the generation of ketone bodies through FA oxidation in liver and peripheral blood mononuclear cells [90]. Despite suppression of insulin levels and increases in FA supply, PPARα-deficient mice exhibit an impaired ability to adequately up-regulate hepatic FA oxidation in response to fasting [91]. PPARα deficiency leads to accumulation of hepatic TAG and elicits dysregulation of hepatic lipid and carbohydrate metabolism in mice [92]. Insulin resistance induced by excess of
non-esterified FA and circulating TAG can be corrected by the administration of PPARα activators by actions to promote removal of intracellular lipid through tissue FA oxidation [93]. In light of these findings, PPARα is potentially a powerful molecular target for the treatment of obesity and metabolic disorders.
In WAT, the role of PPARα is not yet established because of the low expression of the nuclear receptor in that tissue [85]. PPARγ is highly expressed and active in WAT, suggesting that in this tissue adipocyte differentiation and TG storage are dominant and lipid catabolism occurs in a very low rate [85]. One study showed that PPARα activation in WAT prevents inflammation, and dual activation of PPARα and -γ enhances the action of adiponectin by increasing both adiponectin and adiponectin receptors (AdipoRs), which can result in the amelioration of obesity-induced insulin resistance [94].
1.5 PGC-1α
In addition to ligand-mediated activation, PPARs also are co-activated by transcriptional co-activators and co-repressors. Transcriptional co-activators interact indirectly with the PPARs and other nuclear receptors to establish a platform for recruitment of other proteins important to chromatin remodeling and recruitment of the RNA polymerase II complex. One of the most well studied PPARα co-activators is PGC-1 [95] The PGC-1 activators [PGC-1α, PGC-1β, and PGC-related co-activator (PRC)] have been well described as important regulators of mitochondrial metabolism [95]. These co-activators have an impact on cellular biologic responses, enabling the cell to meet changing energy demands associated with various physiologic stimuli. These responses include augmenting mitochondrial biogenesis, respiratory rates, and uptake and metabolism of substrate. The first member of the PGC-1 family to be identified was PGC-1α. It was discovered as a result of its interactions with the nuclear receptor, PPAR-γ, in brown adipose tissue, a mitochondria-rich tissue specialized for thermogenesis. Expression of PGC-1α, also is increased in association with physiologic and pathologic stimuli such as exercise and starvation [95].