F
ACULDADE DEE
NGENHARIA DAU
NIVERSIDADE DOP
ORTOCotton Wool Spots In Eye Fundus Scope
Simão dos Santos da Rocha Felgueiras
Mestrado Integrado em Engenharia Informática e Computação
Supervisor: Miguel Pimenta Monteiro - Docente do Departamento Engenharia Informática
Supervisor: Filipe Soares - Cientista Sénior da Fraunhofer Portugal
Cotton Wool Spots In Eye Fundus Scope
Simão dos Santos da Rocha Felgueiras
Mestrado Integrado em Engenharia Informática e Computação
Resumo
Diabetes mellitus é uma doença com um impacto significativo na saúde pública. Trata-se de uma alteração do metabolismo de hidratos de carbono, gorduras e proteínas que são resultado de uma deficiência ou ausência total de secreção ou resistência à insulina por parte das células beta do pâncreas. Existem 3 tipos de diabetes, o denominado tipo 1 em que o doente é dependente de insulina, o tipo 2 em que o doente não é dependente de insulina e a diabetes gestacional que aparece durante a gravidez. A retinopatia diabética é uma complicação que pode resultar em cegueira. Se for detetada numa fase inicial, pode ser tratada por cirurgia a laser. No entanto, é dificil detetá-la numa fase inicial, uma vez que progride sem sintomas até ocorrer perda de visão de forma irreversível. Assim, se for possível detetar ou encontrar exudados algodonosos no fundo do olho utilizando reconhecimento de imagem, anotação automática e sistemas de apoio à decisão de avaliação do risco, conjugados com a utilização de um dispositivo e aplicação móveis que permitam a aquisição de imagens do fundo do olho, será provável detetar mais cedo e tratar a retinopatia diabética, evitando o risco cegueira do paciente.
Este projeto tem como objetivo desenvolver uma aplicação para smartphone baseada em al-goritmos de baixo custo computacional, com uma boa eficiência no tratamento de imagens de baixa qualidade que são geralmente adquiridas pela câmara de um smartphone. Com o auxílio de um sistema de suporte à decisão, a ser incorporado na aplicação, poderá haver uma indicação da ausência ou presença de retinopatia diabética. Este sistema também pode ser extendido no futuro a outras doenças oculares, como uma ferramenta útil para o rastreio de saúde ocular nos países em desenvolvimento, reforçando a proximidade dos programas de rastreio para a população. Os principais objetivos incluem então o desenvolvimento de um sistema fiável de apoio à decisão, considerando exsudados algodonosos juntamente com pontos vermelhos, podendo melhorar al-guns sistemas actualmente em uso em Portugal, que consideram apenas os pontos vermelhos. O número de casos de retinopatia diabética em todo o mundo justifica o desenvolvimento de um sistema com suporte à decisão automatizada permitindo um triagem rápida e de baixo custo desta doença.
Abstract
Diabetes mellitus is a disease with significant impact in public health. It is a complex disorder of carbohydrate, fat and protein metabolism that is a result of a deficiency, or complete lack of insulin secretion by the Beta cells of pancreas, or resistance to Insulin. There are 3 types of diabetes, namely type 1 where the patient is insulin-dependent, type 2 where the patient is non insulin-dependent and gestational diabetes that appears during pregnancy. Retinopathy is a di-abetes complication that can result in blindness. If detected in an early stage it can be treated by laser surgery. However its early detection is frequently missed, since it progresses without symptoms until irreversible vision loss occurs. So if we can detect or find cotton wool spots in eye fundus scope images by using image recognition, automatic annotation, and decision-support systems for risk assessment, conjugated with a mobile device and app capable of acquiring eye fundus images, we might detect early and treat avoiding patient blindness risk.
This project aims to develop a smartphone-based low computational-cost algorithms, with a high efficiency in the processing of the lower quality images of the smartphone camera. With the help of decision-support system, incorporated in the application, we can have an indication of ab-sence or preab-sence of diabetic retinopathy. This system may also be extended to other eye diseases, as an useful tool for eye health screening in developing countries and enhance the proximity of screening programs to the population. The main expected contribution of this work is to develop a good decision-support system, considering cotton wool spots together with red dots, instead of some systems in use in Portugal which only consider red dots. The number of diabetic retinopathy cases worldwide justifies the development of automated decision-support systems for quick and cost effective screening of this disease.
Acknowledgements
First of all I want to say thanks to Faculdade de Engenharia da Universidade do Porto for the possibility to be able to study in Mestrado Integrado Engenharia Informática e Computação that allowed me to candidate to this master thesis at Fraunhofer Portugal. Fraunhofer Portugal gave me all the needed support, specially my supervisor Filipe Soares and João Costa, Junior Scientist. They are part of EyeFundusScope, the project in the scope of my thesis.. Miguel Monteiro, my su-pervisor at Feup, teacher the Informatics Department, was always ready to help me on everything to achieve success with this dissertation.
Definitely not less important, I do not forget my parents, my brothers and my girlfriend who made this journey by my side, with whom I have shared the best and the worst moments. You really made this worth it.
Thank you all.
“Unless we change our way of thinking, we will not be able to solve the problems caused by the way we have become accustomed to see the world.”
Contents
1 Introduction 1
1.1 Context . . . 1
1.2 Motivation and Objectives . . . 2
1.3 Overview . . . 2
2 Literature Review 5 2.1 Diabetic Retinopathy . . . 5
2.1.1 Causes and Evolution . . . 5
2.1.2 Diagnosis, Prevention and Treatment . . . 6
2.2 Eye Anatomy . . . 6
2.2.1 Detection of Ocular Diseases . . . 7
2.3 Exudates . . . 8
2.4 Image . . . 8
2.4.1 Image Processing . . . 8
2.4.2 Useful Image Processing Methods . . . 10
2.5 Image Segmentation . . . 11
2.6 Detection Methods . . . 11
2.7 Alternative Solutions for Smartphone . . . 13
2.8 Mobile Solutions for Diagnosis of Diabetic Retinopathy . . . 14
3 Methodology 15 3.1 Public Image Databases . . . 15
3.2 Prototype for Smartphone Image Acquisition . . . 16
3.3 OpenCV . . . 17
3.3.1 OpenCV in Android . . . 18
3.4 Eye Image Segmentation Methods . . . 18
3.4.1 Template Matching . . . 18
3.5 Classification . . . 18
3.5.1 Machine Learning . . . 19
3.5.2 Decision-Tree . . . 20
3.6 Quality Image Check . . . 21
4 Exudates Detection 23 4.1 Image Pre-Processing . . . 24
4.1.1 Color Normalization . . . 24
4.1.2 Contrast Enhancement . . . 25
4.1.3 Haar Wavelet Transforms . . . 26
CONTENTS
4.1.5 Macula Detection . . . 28
4.1.6 Risk Zone Algorithm . . . 29
4.1.7 Remove Reflections . . . 29
4.2 Candidate Feature Extraction . . . 30
4.3 Classification . . . 31
4.4 Calibration System . . . 32
5 Decision-Support System 35 5.1 Retinopathy Risk Levels . . . 35
5.1.1 DSS Microaneurysms . . . 36
5.1.2 DSS Exudates . . . 36
5.1.3 Maculopathy . . . 37
5.1.4 Decision-Support System Algorithm . . . 37
6 Exudates Detection Results 39 6.1 Performance of the Algorithms . . . 39
6.2 E-Ophtha Database Results . . . 40
6.3 Messidor Exudates Detection Results . . . 40
7 Conclusion and Future Work 45
References 47
List of Figures
2.1 Vision Loss with DR . . . 6
2.2 Anatomy of the Eye [WPF+10]. . . 7
2.3 Cotton wool spots and hard exudates in eye fundus [stu16]. . . 8
2.4 Example of an image, an array or a matrix of pixels arranged in columns and rows. 9 2.5 Snake algorithm process example [ZG16]. . . 10
2.6 Transformation process to detect exudates using wavelet transformations . . . 12
2.7 D-Eyecare a system for eye fundus image acquisition. [D-E16] . . . 13
3.1 Eye fundus image from E-Ophtha database . . . 16
3.2 EyeFundusScope prototype for Image Aquisition . . . 17
3.3 Retinographer and smartphone image used to test Quality Image Check algorithm. 21 4.1 Exudates detection process pipeline. . . 23
4.2 Background subtraction result. . . 25
4.3 Contrast enhancement result. . . 26
4.4 HWT output. . . 27
4.5 Contours of Wavelet with low element size from contrast enhancement. . . 27
4.6 Optic disc removal result. . . 28
4.7 Macula detection result. . . 28
4.8 Candidate extraction result. . . 29
4.9 Remove reflection with red channel. . . 30
4.10 Remove reflections with blue channel. . . 30
4.11 CIE-Lch color system used in TCGFE. . . 31
4.12 Background subtraction result. . . 32
4.13 Algorithm in Binary Tree approach. 1- color level study 2- purity/energy study. . 33
5.1 Microaneurysms annotation [Cos15]. . . 36
5.2 Exudates annotation. . . 37
6.1 Android Application Images . . . 41
6.2 Exudates masks E-Ophtha vs EyeFundusScope Application . . . 42
LIST OF FIGURES
List of Tables
LIST OF TABLES
Abbreviations
CE Contrast Enhancement CWS Cotton Wool Spots DT Decision Tree DM Diabetes Mellitus DR Diabetic Retinopathy DSS Decision-Support System EFS EyeFundusScope HE Hard Exudates
HWT Haar Wavelet Transform ML Machine Learning OD Optic Disc
PNG Portable Network Graphics SSIM Structural SIMilarity SVM Support Vector Machine
Chapter 1
Introduction
The purpose of this master thesis is to develop a mobile solution capable of detecting signs of diabetic retinopathy (DR). This is achieved by detecting Soft and Hard Exudates (HE) in images of eye fundus, obtained by mobile device, like a smartphone, provided with an ophthalmoscope. Soft Exudates or Cotton Wool Spots (CWS) appear at an early stage of DR and Hard Exudates later. DR needs to be detected in an early stage, otherwise in later stages it’s dificult to treat and may cause vision loss and blindness [SUB09]. The early detection of DR is not usual, because the general practitioner does not perform this type of tests and appointments with an ophthalmologist doctor is not always frequent or possible.
This work addresses this problem, by allowing general practitioners to perform a primary assessement of the patient condition in DR. It also benefits screening programs, because the use of a retinographer has mobility restrictions and needs system calibration. A mobile solution, such as the one proposed here, could do the same job in a cheaper way, with high mobility and convenience.
The proposed mobile solution is implemented in Android smartphones, using, for image aqui-sition, a small ophtalmoscope, a mechanical support, and some ilumination that is controlled using the smartphone application.
1.1
Context
Diabetes mellitus is a significant public health concern all over the world. It is estimated that, in 2010, over 285 million people worldwide were diagnosed with diabetes and, from those, one third presented signs of diabetic retinopathy[RE11]. DR is one of the major causes of visual impairment and blindness in the working population. Early detection of diabetic retinopathy improves healing chances, helping to stop or slow down its progress. In order to achieve early detection, national and international guidelines recommend annual eye screening for all diabetic patients. However, an annual eye fundus examination is not performed by all patients. There are a lot of different
Introduction
types of eye lesions associated with DR, like microaneurysms, exudates (Soft and Hard), vitreous hemorrhage, hemorrhage inside retina [RE11]. The hemorrhages only appear at the end of DR, and are visible whitout need of examination. Microaneurysms and Soft Exudates (CWS) are the first lesions that appears at an early stage and they are hard to detect. During the process of researching about soft exudates, we have also find a way to detect and classify hard exudates that appear at a midle/later stage of DR. So, this work aims to detect soft exudates using low quality images from a smartphone camera, using low computational-cost algorithms, that can be used as a decision-support system. Hard Exudates are included because while applying algorithms to detect CWS, the algorithms also detect Hard Exudates and there is a way to differentiate them.
1.2
Motivation and Objectives
One of the potential goals of this project is to improve the health service, more properly the diabetic retinopathy diagnosis, making contributions in convenience and accuracy, allowing early detection of the disease.
In the development of this project, four objectives will be targeted:
• Image recognition and automatic annotation of Cotton Wool Spots and Hard Exudates on EyeFundusScope.
• Mark the difference between Cotton Wool Spots and Hard Exudates. • Decision-Support System that rates DR risk level.
• Macula Detection for verification of Macula Degeneration.
The recognition of Cotton Wool Spots is the primary goal of this work, because they appear at an early stage of DR, precisely when a mobile screening tool is more useful. This early detection is very important, so the DR treatments can start earlier and solve the problem fast. It is also important differentiate CWS and Hard Exudates because hard exudate appears on a phase when the treatment is more complicated. The implementation of the detection method was achieved using the OpenCV framework and the implementation was adapted to the limited computational power available in smartphones [ope16]. Exudates can appear near the macula region and the distance between exudates and macula is crucial to know because it can cause macula degeneration. A decision-support system conjugates the early stages of DR lesions and Hard Exudates to determine a DR level. This DR level is further explained in chapter 5.
1.3
Overview
Apart from the introduction, this work contains 6 more chapters. Chapter2presents a literature re-view of several aspects related to DR and Exudates detection/classification that already exists and were explored. In chapter3the Methodology and Tools used in this project are overviewed and it
Introduction
also explains some solutions were rejected. In chapter4a pipeline to detect exudates is presented, along with its various stages described in detail. These stages include image pre-processing, ex-traction of the candidates from the original image, elimination of false candidates and the classi-fication in true/false exudates and then soft/hard exudates. Chapter5contains the description of the decision-support system that gives to the doctor the information about the DR risk level tak-ing into consideration microaneurysms, exudates and the exudates’ distance to macula. Chapter6
prensents the results of exudates detection in E-Ophtha and Messidor databases. Finally chapter7
Introduction
Chapter 2
Literature Review
2.1
Diabetic Retinopathy
Diabetic retinopathy is the result of damage in the tiny blood vessels that nourish the retina. They leak blood and other fluids that cause swelling of retinal tissue and clouding of vision. This condi-tion usually affects both eyes. The longer a person has diabetes, the more probable are the chances of developing diabetic retinopathy. If left untreated, diabetic retinopathy may cause blindness. There are two types of DR. The first is the non-proliferative type characterized by microaneurysm, exudates, haemorrhages, venous changes, neovascularisation, and retinal thickening. The other is proliferative diabetic retinopathy, which is the advanced stage of DR. It is characterized by new vessel formation, commonly tapestrying the optic disc, or the arising on other parts of the retina. [IASD01] Nowadays these problems are solved with laser surgery and for that it is really important to find DR in an early stage.
2.1.1 Causes and Evolution
DR is a complication that comes from Diabetus Mellitus. The main cause of DR is excess of sugar in the patient blood. That can lead to the blockage of the tiny blood vessels that nourish the retina, cutting off its blood supply. As a result of this, the eye attempts to grow new blood vessels. But these new blood vessels don’t develop properly and can easily leak fluilds (edema). These leakages, depending on the exact location where they occur can degrade visual accuracy (the extent to which this occurs is correlated with the distance to the macula) [MRKT14].
The DR starts to be non-proliferative and at an early stage only microaneurysms and soft exudates appear. In a middle stage hard exudates begins to form, where the distance of exudates to macula is important because it causes macula degeneration. At the same time, vision loss occurs. The proliferative stage of DR is the end stage with the formation of new vessels and where the chances of treatment with success are very low [RE11].
Literature Review
Figure 2.1: Vision Loss with DR
2.1.2 Diagnosis, Prevention and Treatment
The Diabetic Retinopathy Study and the Early Treatment Diabetic Retinopathy Study (ETDRS) are two landmark clinical trials. They demonstrated that treating diabetic retinopathy could reduce severe vision loss by 90 percent. These studies have underscored the critical need of periodic eye examinations for all patients with diabetes. If necessary, this is followed with prompt intervention with laser photocoagulation and vitrectomy, which it is the most effective method to reduce poten-tial visual disabilities [RE11]. However, despite the availability of successful treatments, a number of barriers to optimal care remain. These include a variety of financial, sociological, educational and psychologic barriers to regular ophthalmic examinations.
DR prevention should start when Diabetus Mellitus is diagnosed, but different types of DM have different screenning programs arround the world. In Portugal ARS Norte has a plan for DR tracking. It is focused on the health centers’ family doctors that select patients based on a exclusion criteria. After that, it is necessary to make appointments according to the availability of retinogra-phers. Retinographers requires a technical team to schedule the installation and calibration,usually performing about 25 examinations a day.
2.2
Eye Anatomy
The eye is one of the most complex organs of the human body, in which three layers can be distinguished.
• Fibrous layer • Nervous layer • Vascular layer
Sclera and cornea compose the outer region - the fibrous layer. The cornea refracts and trans-mits the light to the lens and retina and also protects the eye against infection and structural damage
Literature Review
to deeper parts. The Sclera protects the eye from internal and external forces, happening because sclera forms a connective tissue coat. Both cornea and sclera are connected at the limbus.
The Vascular layer, also known as midle layer of the eye, is composed by the iris, the ciliary body and the choroid. The choroid contains the connective tissue, lying between the retina and the sclera. The iris controls the size of the pupil and the amount of light that reaches the retina. The ciliary body controls the power and shape of the lens and produces aqueus.
The nervous layer, also considered the inner layer of the eye, is the retina, a complex layered structure of neurons that capture and process the light [WPF+10].
Figure 2.2: Anatomy of the Eye [WPF+10].
2.2.1 Detection of Ocular Diseases
Retinal image evaluation is an integral part of the monitoring process for progression of ocular diseases. Traditionally retinal image evaluation uses two or more images positioned adjacent to each other, or spatially separated. In this evaluation technique one of the images act as baseline image and all other are compared with this baseline, the goal is to find retinal changes. This may indicate the earliest clues of ocular diseases onset or progression. The iowa detection program is an algorithm that examines and analyses every pixel in an image, to detect microaneurysms, cotton wool spots, and other eye diseases. It combines image quality with the detection of lesions and returns a numerical output between 0 and 1, called the dr-index. The closer the number to 1
Literature Review
the more likely the patient has diabetic eye disease. Both classifications need to be evaluated by a human in the end [HAF+15].
2.3
Exudates
There are two types of exudates, the soft exudates, also known as cotton wool spots, and the hard exudates. They are accumulations of lipid and protein in the retina. Their typical charac-teristics are bright, reflective, white or cream colored lesions found in the retina. These lesions indicate increased vessel permeability and an associated risk of retinal edema. If they appear close to the macula center, they are considered as sight threatening lesions [Alg11]. Exudates are often seen together with microaneurysms. Cotton wool spots is a non-proliferative retinopathy caused by macular edema or macular ischemia, it is a build-up of axonal debris due to poor axonal metabolism at the margins of ischaemic infarcts. Cotton Wool Spots can be detected using fundus scopy, color fundus photography, fluorescein aniography and optical coherence tomography.
Figure 2.3: Cotton wool spots and hard exudates in eye fundus [stu16].
2.4
Image
2.4.1 Image Processing
An image is an array, or a matrix of square pixels arranged in columns and rows. 8
Literature Review
Figure 2.4: Example of an image, an array or a matrix of pixels arranged in columns and rows.
When a greyscale image has 8 bit colour depth, each picture element has an assigned light intensity that ranges from 0 to 255. The colour on a determined pixel depends on the colour depth of the image where 8 bit means 256 tones. The normal images usually have 24 bits (about 16 million colours),but there are also some images in 16 bit format. There are two general ways of representing images: one is the vector graphics, where geometric shapes are mathematically described, and the other is bitmaps. An image as a bitmap could be in different formats. We will work with jpeg format. The jpeg data format is independent from resolution, aspect ratio and image contents. Also, the quality of the representation is individually configurable. Decreasing the quality requirements results in a smaller file size [Fuk13].
A color image has three channels and a channel is like a grayscale image on the intensity of some conventional primary color. By extension, a channel is like grayscale image the same size with the "proper" image, and associated with it.
channels are: • Red channel • Green channel • Blue channel
Technological advances have allowed the manipulation of multi-dimensional signals with sys-tems that range from simple digital circuits to advanced parallel computers. This manipulation can be divided into three categories:
• Image Processing: image in -> image out • Image Analysis: image in-> measurements out
• Image Understanding: image in-> high-level description out
This project will be using image analysis in order to give some measurements about the results of the image processed.
Literature Review
2.4.2 Useful Image Processing Methods
• The snake algorithm is useful for image segmentation. It is used in many systems in biomed-ical signal processing and control and can be applied to eye fundus scope images to find contours and get some eye shapes like optic discs, exudates, eye vessels, etc. Depending on the pre transformations that the image suffers you can get the shapes you want. The snake can have different implementations, and change form as an active countour model. It starts as a set of control points that are conected by curves called the initial contour. Gradu-ally the points will move hopefully making the curve encompass the target area. The point movements are controlled by the internal and external energy from the image [ZG16].
Figure 2.5: Snake algorithm process example [ZG16].
• Texture analysis is determinated by spatial relations between neighbouring pixels. Texture analysis is very difficult to perform as demonstrated by the number of different texture definitions in the image. It is important to segmentate the image to diminish the number of different textures, and after that we have also to classify those different textures. In this context it is important to classify the different types of exudates (cotton wool spots and hard exudates). To make that analysis we could use wavelet transforms or empirical mode decomposition. Empirical mode decomposition, introduced by Huang, can analyse non-linear and nonstationary data. Its principle is to decompose adaptively a given signal into frequency components, called intrinsic mode functions. These components are obtained from signals, using an algorithm called sifting process. This algorithm extracts locally, for each mode, the highest frequency oscillations out of the original signal [NBD+03].
Literature Review
2.5
Image Segmentation
Image segmentation is the process of dividing an image into multiple parts. This is typically used to identify objects or other relevant information in digital images. The characteristics of an image like brightness, colour, motion, and/or stereo disparity information will decide different aproachs of segmentation. The eye image has some bright regions and usually the image is in the same color range: yellow/orange. In the process of eye segmentation a many authors refer the use im-age segmentaiton methods to remove/locate Optic Disc (OD), macula, exudates, microaneurysms, vessels and other artifacts [ZTD+14]. There are a lot of methods for image segmentation like:
• Thresholding • Adaptitive Thresholding • Morphological Transforms • K-Means Clustering • GaussianBlur • Image Filters
These methods are already implemented and optimized in OpenCV 3.0.0, in chapter 3 this framework will be presented.
2.6
Detection Methods
There are two phases in the process of detecting exudates using retinographer images, the image processement and the verification/validation of the exudates presence. In the first phase, some changes should be carried out depend of the initial image. The final result should produce a map of probability of exudates. Usualy one way to detect the exudates is to improve the image quality by removing the noise, making a color normalization, contrast enhancement and a dilation [RE11]. In the second phase a validation algorithm should be applied, which can be a learning algorithm or an image decomposition and reconstruction. The learning algorithm based on a support vector machines or neural networks, that analyze data in order to recognize some classes. In case of image decomposition and reconstruction, a variant of the wavelet transform is used.
The big problem in the validation algorithm is to deal with false positives. If the image has noise or the optic disc appears on the exudate probabilty map, that means that the image processing was not one hundred percent effective. In order to remove false positives, sometimes during the first phase the optic disc is removed [ZTD+14].
To decide the best detection process, some tests/evaluations of performance will be needed, applied to the algorithms that are used to detect exudates.
Literature Review
• The wavelet transforms the image of fundus scope suffers some color and contrast changes with the objective to highlight the exudates. This is achieved by using some morphologi-cal operations for geometrimorphologi-cal transformations, color normalization, and contrast enhance-ment in preprocessing, so that the exudates probability map can be obtained. Next the haar wavelet transform is applied for the image decomposition and reconstruction where exsu-dates appear bright and clear in reconstruction. Then KNN (K Nearest Neighbor) is used to identify how many images have been correctly classified into exudates and non-exudates [RM15]. The pre-processing will be performed through OpenCV operations, using the mor-phological operations and the image transformations to apply the wavelet transform. This algorithm works with signals, the term signals refers to any information stream that varies as function of some range variables. In signal processing literature, the range variable is time, but it could be essentially anything: position, applied-magnetic field, wavelength, or even a dimensionless sequence. In applications, the function can be a recorded sound, an image, a transducer response, etc. In this case the function is an image and the range is position.
Figure 2.6: Transformation process to detect exudates using wavelet transformations
• Fuzzy C-means clustering, developed by Dunn in 1973 and improved by Bezdeck in 1981, is used in retinal image segmentation. To be more effective, a pre-processing operation performing color normalization and a local contrast enhancement should be made. After applying the fuzzy C-means clustering algorithm, we have two segmentation regions that
Literature Review
are classified into two disjoint classes:exudate and non-exudate patches [SUB09]. Sup-port vector machines and neural networks also helps in the classification of exudates. Poor quality images affect the separation result of bright and dark lesions, so to detect better the exudates the Rapidly exploring Random Graphs (RRGs) algorithm can be used, better than other classification techniques that requires intensive computing power for training and classification. Rapidly exploring random graphs (RRGs) try to find feasible trajectories that satisfy specifications other than the usual “avoid all the obstacles and reach the goal region” [KF10].
• Split and merge algorithm is also used in retinal image segmentation. It attempts to divide an image into uniform regions. This algorithm is based on the technique of coarse to fine segmentation principle.
• In the algorithm of eye image check, the first phase is to detect the fake iris data and a second one is to evaluate the quality of the image. If the data pass the eye image check, iris data are localized for feature extraction. Iris features are extracted by wavelet packet process and support vector machine is used as a patterns matching algorithm for data training. After this process, is time to evaluate the success rate of the iris recognition system according to the algorithm of eye image check [JKL03].
2.7
Alternative Solutions for Smartphone
Currently exists a group of mobile solutions that do eye fundus image acquisition. Some examples are EyeMitra [eye16c], Welch Allyn PanOptic [Wel16], PeekVision [pee16], D-Eyecare [D-E16] or EyeSelfie [eye16d] that uses special glasses or mobile devices for eye fundus image acquisition [GLJ+14]. However no one of this solutions do local image processing for diabetic retinopa-thy risk level. This project will use EyeFundusScope prototype that does image acquisition and already has an app that is described in chapter 3.
Literature Review
2.8
Mobile Solutions for Diagnosis of Diabetic Retinopathy
In the software world there are many solutions that allows automatic annotation of eye fundus im-ages obtained with convencional equipments, for example the IDx-DR [eye16b], eyeArt [eye16a], iGrading [iGr16] or Retmarker [ret16]. However no one of these products or algorithms behind the solutions were systematically tested in smartphone devices and low quality sensors (compared with the retinographers cameras).
The scientific community has interest in this type of solutions because it has a lot of potencial to increase the number of screening programs of DR in places with difficult access to health care and with low budget constraints. The interest for the detection of DR is reinforced by the necessity of periodic follow up, that comes from the asymptomatic to the occurrence of lesion progression.
Chapter 3
Methodology
3.1
Public Image Databases
Public databases bring the necessary data to develop and test new methods, and allow qualitative comparisons between different approaches. In order to test the algorithms, high quality images were used on a first phase, coming from 2 databases: E-Ophtha [?] and stare [U.S16], that are lesion annotated. There is no smartphone eye fundus image database yet, so to validate the algo-rithms and the process of diagnostic the Messidor [DZC+14] database was used. This database is also annotated with lesion and DR diagnostic. This work captured smartphone images of eyes without any lesion. However, this project is in the process to elaborate an eye fundus image smart-phone database in the future.
3.1.0.1 E-Ophtha
E-Ophtha has two different types of databases, one that contains retinal images for microaneurysms studies and another for the exudates. It helps researchers in their investigations and tests their al-gorithms. The e-ophtha database results from the anonymized extraction of the examinations gathered during the years of 2008 and 2009, through the OPHDIAT network. For the last 15 years the development of image processing methods for the analysis of eye fundus images has been very active. Images are not the only source of information taken into account by the specialist to produce a diagnostic. The patient age and diabetes history are also taken into account.
In teleophta machine learning and image processing methods for tel-ophthalmology the pro-posed solution is based in some algorithms or techniques already referred to in the previous charpter. They use wavelet-based image characterizations, then each image in a patient record is divided into patches and a vector of image characterization. They call it a signature, because it is extracted from each patch. A machine learning algorithm was also designed to recognize those signatures that only appear in pathological patient records. This algorithm trusts on the multiple-instance learning paradigm. In order to detect various pathological patterns, it uses several sizes of patches simultaneously. [DCZ+13]
Methodology
Figure 3.1: Eye fundus image from E-Ophtha database
3.1.0.2 STARE
The STARE (Structured Analysis of the Retina) project was conceived and initiated in 1975 by Michael Goldbaum, M.D. The project’s goal is to help ophthalmologists to process the retinal images and their approach breaks the problem in two components. The first component concerns automatically processing a retinal image to denote the important findings, the second component concerns automatically reasoning about the findings to determine a diagnosis. They classified 400 images and got different outputs. First of all, they have different classifications for each image. One of them only verifies if it is a valid image. One of the others classify the image taking into account thirteen different types of medical diagnoses. To get this information they used different color and contrast characteristics of the same image. [RE11]
3.1.0.3 Messidor Diabetic Retinopathy
Messidor is a public database with 1200 images form eye fundus that were acquired with 3 oph-thalmology departments using a retinographer. From the 1200 images, 800 were acquired with pupil dilation and 400 without it. The database contains a medical diagnosis for each image, but no manual annotation on the images. This is an important difference between Messidor and other databases like E-Ophtha. The medical diagnosis helps the researcher on algorithm validation and could also help on machine learning training.[DZC+14]
3.2
Prototype for Smartphone Image Acquisition
After the work done in the algorithms, the objective is to work with camera images. Smartphone images has lesser quality then the images that come from a retinographer and also can have some
Methodology
noise that can affect results. There is some quality image check techniques that can help on improving the quality of the examination, because during the process of image acquisition every image is prone to a certain amount of noise. The primary step is to verify if the image has enough quality to be used in a medical diagnosis finding. There are some techniques that can check the image quality.
In this project, a smartphone (Android) with a low-cost portable ophthalmoscope was used. Associated to the ophthalmoscope there is a lamp support, to control illumination. This system was used for the image acquisition, where the light was controlled using the smartphone camera API, combined with an application that saves and manages the images that are acquired. The prototype called EyeFundusScope (EFS) developed by Fraunhofer Portugal in figure , already detected microaneurysms from the acquired images, it was done by João Costa during his master thesis, prior to this thesis project [Cos15].
Figure 3.2: EyeFundusScope prototype for Image Aquisition
3.3
OpenCV
To easily apply the image processing operations, this project uses the OpenCV (Open Source Computer Vision). OpenCV is an open source vision and machine learning software library. The library has a lot of optimized algorithms (more than 2500). These algorithms can be used to detect and recognize faces, identify objects, classify human actions in videos, track camera movements, track moving objects, extract 3D models of objects, produce 3D point clouds from stereo cam-eras, stitch images together to produce images of an entire scene, find similar images from an
Methodology
image database, remove red eyes from images taken using flash, follow eye movements, recog-nize scenery and establish markers to overlay it with augmented reality, etc. It has C++, C, Python, Java and MATLAB interfaces and can be used in Windows, Linux, Android and Mac OS. OpenCV leans mostly towards real-time vision applications and takes advantage of the vector MMX and SSE instructions when available on the processor.[ope16]
3.3.1 OpenCV in Android
In the Android version OpenCV functions are implemented in C++ and Java wrappers are avail-able, so it is possible to easily port developed code. Furthermore, native C++ code may be used, through the Java Native Interface (JNI), using the Android Native Development Kit (NDK). Due to a relatively large overhead in calling each wrapped OpenCV function, C++ code should be pre-ferred in repetitive calls. As a result of the relatively large size of the OpenCV libraries, another application, OpenCV manager, needs to be installed providing the library operations as an Android service. This can be avoided, but the included libraries in standalone applications would increase the developed application size by 20 MB for each one.[ope16]
3.4
Eye Image Segmentation Methods
It is important to segment the image of the eye, because there are many artifacts that can be false candidates in the exudates context. To detect eye regions, this project uses morphological transforms and snake contours algorithm to get the form and location of the regions. For the optic disc region detection a template matching algorithm was applied and for macula localization this work uses OD location as referential.
3.4.1 Template Matching
The template matching algorithm is a technique used in image processing to locate artifacts. It matches a part of the image having as reference a template. In this context the optic disc has always the same characteristics, where the difference resides in the form. One problem that this algorithm could suffer is low performance caused by size of the image. To resolve this problem if the artifact has high relevance and it is not to be recognized by humans, most of the times to improve the performance of this algorithm, the image suffers a resize.
3.5
Classification
The next step after candidate extraction is to classify the candidates in exudate or not, and then in soft or hard exudate. To classify exudates, the more common methods are machine learning (ML), decision-tree using feature extraction and segmentation algorithms.
Methodology
3.5.1 Machine Learning
All the processes to detect exudates in general have image processing as the main phase for can-didate extraction, however some processes use machine learning to classify them. In order to use ML, it is important to know exudates characteristics and train the system to have the best performance. Some of the characteristics to consider can be:
• Color Range • Contrast • Smoothness • Third Moment • Uniformity • Entropy
These are some features that can differenciate exudates from other artifacts. Then, it is im-portant to indentify soft exudate and hard exudate, where texture and color differenciate them. Therefore, to detect exudates and differenciate them, the system needs two trainning models. A disadvantage for machine learning is eye images captured by smartphone or even retinographer images with different color ranges. This causes a change of the values of some of the exudates characteristics that origins failure in their classification.
3.5.1.1 Support Vector Machines
A support vector machine (SVM) is a discriminative classifier, formally defined by a separating hyperplane. Giving a labeled training data (supervised learning), the algorithm outputs an optimal hyperplane which categorizes new examples. SVM is based on learning from examples and, in terms of time, it can lead with high performance [Bur98].
The advantages of support vector machines are: • Effective in high dimensional spaces.
• Still effective in cases where the number of dimensions is greater than the number of sam-ples.
• A subset of training points in the decision function (called support vectors), that makes SVM more memory efficient.
• Different kernel functions can be specified for the decision function. Common kernels are provided, but it is also possible to specify custom kernels.
Methodology
• The method is likely to give poor performances if the number of features is much greater than the number of samples.
• SVMs do not directly provide probability estimates, these are calculated using an expensive five-fold cross-validation.
3.5.1.2 Neural Networks with Deep Learning
Neural networks can be defined as a biologically-inspired programming paradigm which enables a computer to learn from observational data and deep learning as a powerful set of techniques for learning in neural networks. Neural networks and deep learning currently provide the best solu-tions to many problems in image recognition, speech recognition, and natural language processing. A standard neural network consists of many simple connected processors called neurons, where each produces a sequence of real-valued activations. The input neurons are activated through sen-sors, perceiving the environment, other neurons are also activated through weighted connections from previously activated neurons. Some neurons may influence the environment by triggering actions. Learning is about finding weights that make the neural networks exhibit desired behav-ior, such as driving a car. Depending on the problem and how the neurons are connected, such behavior may require long causal chains of computational stages, where each stage transforms the aggregate activation of the network [GKWE96].
3.5.2 Decision-Tree
A decision tree (DT) is a decision-support tool that uses a tree-like graph or model of decisions and their possible consequences, including the chance of occuring an event, resource costs and utility. This algorithm starts with a decision of what the program/user needs to do, then the tree is builded by constraints ordered by priority. This algorithm classifies the instances by sorting them down the tree from the root to some leaf node. Each node specifies some attribute of the instance. ID3 is the basic algorithm for decision tree and C4.5 an upgrade to ID3. They are the base of the concept of the DT. In ID3 the central focus is to choose the attribute with more gain at each decision phase, to get higher performance. In order to determine that gain, ID3 uses entropy.
Entropy(S) = −pxlog2px− pylog2py
In the exudates context the gain of each node or the values used to decide which node will be the next is determined by using a Feature Extraction component and according to weights given to the nodes, the features extracted in the examination image will let the system compare each other and define the diagnosis.
Methodology
3.6
Quality Image Check
Not all smartphone pictures have enough quality to be used on an examination. To resolve this problem an Quality Image Check algorithm was developed, based on algorithms that already test the image quality. Before performing the exam, the quality of the image is checked, to do that a structural similarity algorithm (SSIM) is applied to rate the image quality.[ZB09]
Structural similarity is based on the concept that the human visual system is adapted to pro-cess structural information, and the algorithm attempts to measure the change of the information between the main image and the resized or compressed image. Comparing with other algorithms, like Mean Squared Error or Peak Signal-to-Noise Ratio, several tests proves SSIM has a better per-formance at quantifying subjective image quality.[ZB09] SSIM attempts to measure the change of some image characteristics like:
• Luminance -It is modeled as average pixel intensity.
• Contrast - checking the variance between the reference and distorted image. • Structure - checking the cross-correlation between the 2 images.
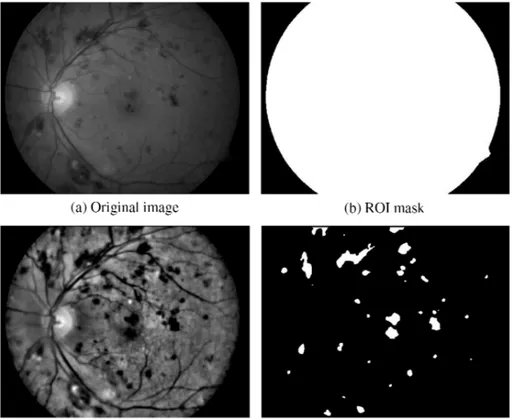
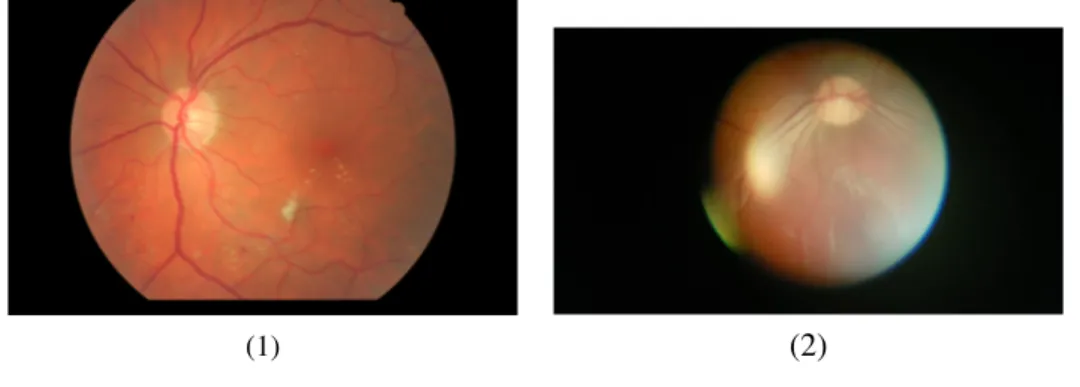
The resulting values are combined (using exponents referred to as alpha, beta, and gamma) and averaged to generate a final SSIM index value. To compute this algorithm the app uses the eye image and the same image with 50 percent of resize, and checks if information is lost. Resizing the image doesn’t lose exudates regions, but may lose regions that could be noise and don’t matter for examination. To evaluate the image quality, it uses a value called similarity value. If this value is 0 the image has good quality and there is no loss of information during the process. If it has a value between 0 and 0.01 the image loses some information, but that loss is usually is not a problem. The image (1) didn’t lose information when tested in this algorithm, so the quality is good. However in image (2) of the same figure3.3the quality is bad.
Figure 3.3: Retinographer and smartphone image used to test Quality Image Check algorithm.
Methodology
Chapter 4
Exudates Detection
Automatic detection of exudates in eye fundus scope images is performed by stages that are dis-tributed in three major phases: image pre-processing, candidate classification and decision-support system (DSS). This approach contains parts of other approaches presented in the state of art chap-ter2. They do not have into count the DSS, that is essential to conclude on the severity stage of the eye at the moment, in terms of diabetic retinopathy. The detailed steps are shown in figure4.1.
Figure 4.1: Exudates detection process pipeline.
• Input image - receiving an image in RGB color model.
• Image pre-processing - eye segmentation - used to get only exudates possible regions. • Exudates classification and validation - for getting the candidates, extract features and sort
them.
• Decision support-system - after classification, the system determines the retinopathy risk level.
Exudates Detection
In the image pre-processing step, the green channel of the input image is processed using appropriate image analysis methods. After this step the eye is segmented and it is time to ex-tract candidates in the right eye regions. Exudates classification and validation is the stage where candidates are extracted, validated and classified using proper algorithms. A common problem that occurs in this step is the detection of several false candidates. In order to address this issue, the light reflections are removed. Classification of the candidate is also processed in this step of the exudates detection pipeline. In order to perform classification, a set of features is computed for each candidate. The result of the classification will pass in the decision-support system and produce to the doctor a possible estimate of the DR level of the patient.
4.1
Image Pre-Processing
Image pre-processing is the stage of eye image segmentation and extraction of the candidates zones for soft and hard exudates. Exudates are the brighter regions in the eye, so using the support of OpenCV framework and low computation algorithms bright zones are highlighted and false candidates removed. In other to achieve this goal the input image needs to travel for some stages that are essential in order to get good results.
4.1.1 Color Normalization
The images that are analyzed are in RGB color model. The RGB color model combines red, green and blue light in specified intensities to reproduce a broad array of colors. In the color normalization stage, using OpenCV framework, red, green and blue channels are extracted, then the main image suffers a background subtraction to equalize the color system. To achieve this color equalization, a morphological transformation TopHat is applied to the original image.
The TopHat transformation is achieved applying the following operations:: Tw( f ) = f − f ◦ b
The element gives the structure and the size to the transformation, a bigger size returns more color detail. The eye fundus images now are in the green color tone, it is visible in figure4.2.
In figure4.2the images (1) and (3) have different color tone, and with background subtraction they got the same color tone of images (2) and (4). This is the solution to solve the problem with images with low quality because the color system of the eye can have different color shades, and exudates have different features. This solution puts the exudates on the same feature characteristics level in all images. Relatively to channel extraction, the green channel is used to extract the candidates, while the other channels are used to remove reflections, that can be confused with exudates.
Exudates Detection
Figure 4.2: Background subtraction result.
(1) (2)
(3) (4)
4.1.2 Contrast Enhancement
Contrast enhancement is the step that allows to highlight the bright regions using the green chan-nel. This process is implemented using another morphological TopHat transformatiom. TopHat transformation, in this context, is an operation that extracts smalls elements and details from an image. The level of detail is given by the structuring element. The element has a group of variables that changes the output detail like:
• Shape Form • Size of the element • Anchor Position
In the same way as the previous operation the TopHat transformation is performed as:
Tw( f ) = f − f ◦ b
The solution applies two times this method with two different types of detail, that is obtained by changing the element size. More size implies more detail, and that is done to obtain all bright regions with the most detail possible.
In figure 4.3 the image (2) has the lower element size and the imaage (3) has the higher, therefore more bright regions are visible in image (3) and with more detail.
Exudates Detection
Figure 4.3: Contrast enhancement result.
(1) (2)
(1) (3)
4.1.3 Haar Wavelet Transforms
Haar wavelet transforms (HWT) improves the approximation and detail in the bright regions ob-tained in the contrast enhancement stage. The Haar Transforms decomposes a discrete signal into one approximation and detail levels. [RM15] The new pixel value is the result of applying HWT inverse formula.
The approximation is obtained by applying:
approximation= px+ p√ x+1
2 (4.1)
The detail is obtained by applying:
detail= px+ p√ x+1
2 (4.2)
In order to get a signal balance between detail and approximation, the inverse HWT is applied and that is obtained by:
hwtnverse=detailx+ aproximation√ x
2 (4.3)
Exudates Detection
Approximation and detail formulas use the input intensity of pixel and the signal that is next to it. The division by√2
ensures that the Haar transform preserves the energy of the signal. Figure 4.4: HWT output.
(1) (2)
(1) (3)
In figure4.4the image (1) is the input image and the other 2 images are the results from the HWT operation with two contrast enhancement elements of different sizes. Image (2) is the lowest while image (3) is the highest.
After this operation a snake algorithm is applied to determine the regions form. Figure 4.5: Contours of Wavelet with low element size from contrast enhancement.
It is visible that the detail is increased and this will be important to the Feature Extraction phase (explained later in this chapter), to get the exact values that are used to detect the regions.
Exudates Detection
4.1.4 Optic Disc Removal
Optic disc (OD) may be a big bright region or, sometimes, a group of big bright regions in the eye fundus image. That can be confused with cotton wool spots. To resolve this problem, it is important first of all to locate the optic disc. To locate the OD, a template matching algorithm João Costa developed in his master thesis [Cos15]. After location the OD, the radius is determined by studying the OD zone in terms of brightness, and removing the contours.
Figure 4.6: Optic disc removal result.
(1) (2)
Image (1) figure4.6has the contours of OD while image (2) only has the contours of vessels. 4.1.5 Macula Detection
Red channel is used to extract and detect the macula. Usually the fovea, the central part of macula, is a dark region that stands out from other regions. To successfully detect the macula, it’s important to know in which side it will be. Using OD center as reference and the value of the eye image width we can detect in which side macula is. Fovea is the central part of macula usually located at a distance approximately 2.5 times the diameter of the optic disc. So after knowing the side of macula, having the disc location and size, we progress in the image to the macula location and its center point, as shwon in figure4.7.[MRKT14]
Figure 4.7: Macula detection result.
(1) (2)
Exudates Detection
4.1.6 Risk Zone Algorithm
Soft exudates are difficult to detect, because they can be confused with illumination reflections. In order to avoid that, a Haar wavelet transform algorithm with two different types of contrast enhancement is used. These two types of contrast enhancement will have different detail levels of eye regions. The lower level contrast enhancement has the main artifacts presented in eye fundus scope image, and other levels help the program to build risk zones and obtain exudates with eye detail. An exudate, hard or soft, has a maximum size that doesn’t pass half the OD size.
The algorithm will match the main regions in both images and aggregate other contours or regions that are near and only available in the image with higher level. A risk zone is also consid-ered, that may include more then one possible candidate, at a quarter of OD size distance to each other.
Figure 4.8: Candidate extraction result.
(1) (2)
(3) (4)
In figure4.8the images (2) and (3) are the result of contrast enhancement and HWT operation. Image (4) is the result of the algorithm, where the candidates to exudates are presented.
4.1.7 Remove Reflections
As mentioned in previous chapters, RGB images contain 3 channels (Red, Green and Blue). The green channel was used to apply the image operations, and the other two channels to remove light reflections. CWS could be confused with them, but in red channel bright regions have a negative signal value and exudates signal is higher or equal to 0.
Exudates Detection
Figure 4.9: Remove reflection with red channel.
(1) (2)
In figure 4.9 it is visible in image (2) that the CWS region is different from the reflections regions. Each contour centroid value (mat in float) in red channel image is used to remove the reflections. If the value is negative it is a reflection, otherwise it could be an exudate. Sometimes border reflections can be confused also with exudates, and that can be removed using the blue channel. This strategy is similar to the one that the program uses to obtain the centroid of each border contour. If it has a signal under 0 value on blue channel, then it is a reflection.
Figure 4.10: Remove reflections with blue channel.
(1) (3)
4.2
Candidate Feature Extraction
In order to do feature extraction from exudates, TCGFE library is used [RCEc16]. The TCGFE is a library developed by Fraunhofer Portugal. This library extracts three main features: geometry, texture and color. To perform this extraction, the library needs the original image and a binary mask with the regions to extract the features. TCGFE also permits to exclude features that are considered with no relevance to study. The color system that this library uses is the CIELch, as shown the color range in figure4.11.
We use only geometry and color features to study the exudates and also to differentiate them. The main image that is going to be observed by the library is the image with background subtrac-tion, in order to have the same color values range in all images. The texture features are not used because texture differs a lot from image to image depending on many factors.
Exudates Detection
Figure 4.11: CIE-Lch color system used in TCGFE.
4.3
Classification
To do exudates classification, this paper uses a binary tree approach4.13to classify the candi-dates. The first verification is the hue and chroma channels, that come from CIELch color system. The hue value corresponds to the color value and chroma to the intensity of the color - this will highlight the differences between soft and hard exudates, and also false candidates. After this first phase, the purity of each candidate region is verified, to detect if the exudate is soft or hard. If it goes for the hard exudate way it will be an hard exudate or a false candidate.
This work was tested with retinographer images with good results, presented in chapeter6. To classify exudates it is very important to have the same color range in the image, because exudates have constant characteristics and that are obtained, as mentioned above, with the background subtraction. In a eye fundus image the hard exudates are in the yellow region, cotton wool spots in the white region. With the background subtraction the hard exudates change to green and CWS to the blue region [ZTD+14]. This is enough to differentiate them from each other, but it is not enough to differentiate them from the other regions. To resolve that issue TCGFE studies the purity of the color and its energy [RCEc16]. Both exudates have different energy levels that are the same in all images, and different from the artifacts that are in the same color region.
In figure4.12is visible in image (1) CWS are in the white region, while in image (2) they are in the blue color region. Hard exudates in image (1) are in the yellow region and in image (2) they are in the green one, as the purity will differentiate them to the rest of the artifacts.
Exudates Detection
Figure 4.12: Background subtraction result.
(1) (2)
4.4
Calibration System
We need a calibration system so that it can be able to react fast to changes. If the user decides to change ophthalmoscope, the smartphone, or even the light used for image acquisition, the values of the exudates could change. This is not a problem because the system can be calibrated by capturing a new image with the new system, study the range values with a data mining software and update the file with the new values. This procedure was already tested, and what needs to be updated is the purity/energy range of the exudate. In smartphone context there are no database with enough size to practice exudates classification, but in retinographers context there are databases with a lot of images, from different retinographers, in which machine learning can be very efficient. While in retinographer if something changes, the image does not change much, in smartphone context that is very different. An examination in retinographer always has the same conditions, like a dark ambient, and the person that uses the system is a specialist on the area. However, a smartphone image can be captured in any place with different levels of luminosity and should not need a specialist on the area to handle it. So, using a ML in this context does not return good results, because there are too many factors that can change fast and the time to practice a new model is longer than the time to do a system calibration.
Exudates Detection
Figure 4.13: Algorithm in Binary Tree approach. 1- color level study 2- purity/energy study.
Exudates Detection
Chapter 5
Decision-Support System
5.1
Retinopathy Risk Levels
All over the world DR screening programs have different approaches to classify DR in levels. In Portugal the Associação Regional de Saúde do Norte has specified a set of characteristics to perform the DR levels evaluation. According to the Portuguese Law No. 22/2012, of 30 January, the Portuguese association is responsible for the North Region’s population access to health care services and should, adapt the available resources to the needs of enforcing health policies and programs in its area of intervention, including DR screening [Mo12]. The defined DR screening plan and considers 4 levels in DR risk:
• R0 Without retinopathy- the patient has no presence of any type of lesion related with DR. • R1 Non-proliferative (slight)- the patient has presence of microaneurysms, retinal
hemor-rhages and presence of exudates without presence of maculopathy.
• R2 Pre-proliferative- Presence of cotton wool spots and possible presence of maculopathy. • R3 Proliferative- It is a state of hemorrhage, that doesn’t contemplate exudates or
microa-neuryms and it is the highest state in DR where treatment is hard to succeed.
We also consider the exudates distance to macula, because when exudates are an OD distance to macula, it indicates macular degeneration and loss of vision. Associação Regional do Norte considers one level in maculopathy:
• M1- Exudate within 1-disc diameter (DD) of the center of the fovea. Group of exudates within the macula. Retinal thickening within 1 DD of the center of the fovea (if stereo available). Any microaneurysm or hemorrhage within 1 DD of the center of the fovea only if associated with a best visual acuity of 6/12 (if no stereo).
The portuguese association model is equal to the United Kingdom and this approach is used since 2006. Other countries also have similar methodologies considering, the screening programs
Decision-Support System
in DR are important because DR occurs and starts to progress without any sympthoms. When the patient starts losing vision the disease is already at later stages and the treatment is more complex.[SD06]
5.1.1 DSS Microaneurysms
Microaneurysms detection were implemented by João Costa during his master thesis [Cos15]. His system receives an input image that will suffer a pre-processing and pass to a ML classification, that detects the number of microaneuryms. It also uses vessels to remove false candidates. This lesion is also related with DR and we also use microaneurysms in the DSS of DR. Microaneurysms and exudates examination runs in parallel and the DSS receives the number of miroaneurysms that were detected in the eye image. Comparing this lesion with the presence of the others we are able to assign a DR level. If the only lesion that is detected are microaneurysms R1 will be assigned. [Cos15]
Figure 5.1: Microaneurysms annotation [Cos15].
Figure5.1reproduces microaneurysms annotation image, that is shown on the android appli-cation, where the circles are the lesion location.
5.1.2 DSS Exudates
After detecting the presence of exudates and having the number of CWSs and HEs, the DSS will check first for the presence of microaneurysms. If they are not found, it does not mean that exudates could not exist. So the system will check for the number of CWSs and if they exist the corresponding DR level will be classified as R2, and check for the presence of maculopathy. In the case that CWSs do not exist, but HEs exist, we are in presence of R1, but it could be M1, if these exudates are located near macula.
Decision-Support System
Figure 5.2: Exudates annotation.
(1) (2)
Figure5.2we can see the exudates annotation image where hard exudates are annotated with red color and cotton wool spots with yellow color. This image is classified as R2 M1. Some regions appears on optic disc region, because the OD removal miss some partes, however it is a good example for R2M1 detection.
5.1.3 Maculopathy
Our System detects the macula and the purpose of having macula location is to know if the patient could already suffer from vision issues. A maculopathy is any pathological condition of the mac-ula, an area at the center of the retina that is associated with highly sensitive accurate vision. If there are exudates 1 OD distance from the macula they can cause vision loss, and when the patient is in presence of an R1 level, but exudates are near macula, it will be M1. However, if it is in R2 level and exudates are near the macula it is classified as R2M1.
5.1.4 Decision-Support System Algorithm
After the detection of microaneurysms, exudates and having macula location, it is possible to identify the DR risk level. The algorithm is based in conditions that determine the DR level having as reference the constraints based in the model of portuguese association.
Decision-Support System
Chapter 6
Exudates Detection Results
6.1
Performance of the Algorithms
One of the objectives of this project is running fast in smartphones, so the CWS detection needs to run low computational-cost algorithms. To test performance and the architecture of the algorithms, they were developed and tested in a desktop computer. The Risk Zone algorithm is the stage developed in the image pre-processing that takes more time and depends on the artifacts presented in eye fundus image. The other steps run under 0.5 seconds. The feature extractor library only runs geometry and color features, but in mobile context the library is optimized to study only some specified color features. The features that are running in the mobile version are the energy and the value of the color from hue and chroma channels.
The results of running the algorithms in a desktop computer with Intel CoreR TM i7-3770S
CPU @ 3.10GHz 8 gb RAM are presented in table6.1
On Messidor database the TCGFE library has a better performance, but risk zone algorithm is the opposite. TCGFE is faster when it is in presence of a low number of candidates and the risk zone algorithm constructs the candidates.
Table 6.1: E-Ophtha vs Messidor results (Time is in seconds)
Task E-Ophtha Messidor
Color Normalization 0.05 0.05
Contrast Enhancement + Morphological Operation (TopHat)
0.07 0.03
Haar Wavelet Transform (2 element sizes) 0.24 1.03
Remove Optic Disc 0.34 1.22
Risk Zone Algorithm 1.12 7.90
Remove Reflections 0.0066 0.01
Feature Extraction (TCGFE) 8.46 0.23
Classification + Decision Support System 0.01 0.015
Exudates Detection Results
When running in Android the algorithms, with E-Ophtha database, take about 35 seconds (average exam time). This is the duration between, in an Android system, the examination start and end. The smartphone used to test was a Samsung Galaxy S6 with a processor Quad-core 1.5 GHz Cortex-A53 and a second Quad-core 2.1 GHz Cortex-A57, 3 GB ram and Android 6.0.1. HWT operation, risk zone algorithm and TCGFE are the stages that consume more time. NDK, a tool used to program in C++ in Android devices, does not allow to determine the time of each stage.
The Android application is called EyeFundusScope and some screens are shown in figure6.1. Image (1) shows the main menu, image (2) the options menu, image (3) a list of profiles and image (4) the exam details.
6.2
E-Ophtha Database Results
E-Ophtha was the reference to build our system but we have not use it in the validation stage, because we want to know that it works with any image. E-Ophtha was the main database to improve the algorithms in the different stages of the project. This database has all type of eye diseases including R2. The database is also annotated and has lesion mask image, that allows a comparison with our results.
In figure6.2the image (2) shows the E-Ophtha data base annotation and (3) shows the result after running our algorithms. The elements are not in the same structure, the program uses contours from OpenCV that try to do an approximation.
6.3
Messidor Exudates Detection Results
Messidor is full annotated in terms of DR risk level. Using the final result of the exudates and mi-croaneurysms, we compare our diagnosis with Messidor diagnosis. This project tested two types of approaches. One of them does not have image calibration using images from the Messidor database, being calibrated using E-Ophtha database. In the second test, the system is calibrated using 10 images randomly chosen in Messidor database. Both methods only test exudates detec-tion.
The first test that combines exudates and microaneurysms with the exudates part calibrated with E-Ophtha images has an area under the Roc curve of 0.84, while the exudates part calibrated using only 10 images from Messidor database system also has the value of 0.85, the sensitivity of 87 percent and the specificity of 64 percent, as shown in figure6.3. This proves that the system works with any types of eye fundus images.
At this point we know that our algorithms work well with images from retinographer, but our objective is the same performance for smartphone images. To validate this algorithms we have a submission to Departamento de Ensino Formação e Investigação - Hospital Santo António Porto to do a smartphone image collection in DR patients that are going to appointements in ophthalmology
Exudates Detection Results
Figure 6.1: Android Application Images
(1) (2)

![Figure 2.2: Anatomy of the Eye [WPF + 10].](https://thumb-eu.123doks.com/thumbv2/123dok_br/15488924.1040924/27.892.181.750.413.826/figure-anatomy-eye-wpf.webp)
![Figure 2.3: Cotton wool spots and hard exudates in eye fundus [stu16].](https://thumb-eu.123doks.com/thumbv2/123dok_br/15488924.1040924/28.892.170.683.546.970/figure-cotton-wool-spots-hard-exudates-eye-fundus.webp)
![Figure 2.5: Snake algorithm process example [ZG16].](https://thumb-eu.123doks.com/thumbv2/123dok_br/15488924.1040924/30.892.176.679.478.790/figure-snake-algorithm-process-example-zg.webp)