for Knowledge-Based Competitiveness
in the European Union
Anita Pelle
University of Szeged, Hungary [email protected] Renáta Laczi
University of Szeged, Hungary [email protected]
The latest growth strategy of the European Union, the Europe 2020, repre-sents a new approach towards economic growth. From our point of view the most important innovation of the strategy is that, beside intelligent and sustainable growth, it sets out the establishment of an inclusive soci-ety as one of its priorities. We believe that member states’ competitiveness is a key factor of their economic growth. For that reason, we included the World Economic Forum’s Global Competitiveness Index in our analysis to ind the relationship between competitiveness and an inclusive society. We investigate the eu member states’ performance on country group level, and then we set up an inclusive indicator based on the main components of the inclusive pillar of the Europe 2020 strategy. Our indings suggest that an inclusive society is one of the necessary conditions for economic prosperity.
Key Words:society, education, economy, knowledge jel Classiication:i25, i32, j24
Introduction
growth instead. In our paper, we are focusing on the indicators that de-termine inclusive growth: employment, education, and people living in or at risk of poverty or social exclusion.
In this article, we would like to emphasize the importance of human aspects of competitiveness such as human capital and social inclusion. We claim that the human and social aspects of competitiveness are the basis of a knowledge-based economy. The aim of this paper is to discover the relationship between competitiveness and social inclusion. Our initial hypothesis is that social inclusion is one of the necessary conditions for a competitive economy. Moreover, we assume that there is a core-periphery divide in the performance of the member states.
In our paper, irst we overview the related literature, which suggests a correlation between social inclusion and competitiveness and gives a special highlight to the role of knowledge in the economy. Second, we thoroughly present our methodology (country groups, indicators) and the results of the calculations. Finally, we discuss the relationship of com-petitiveness and social inclusion based on our indings and we draw our conclusions.
Interpretations of an Inclusive Growth
The concept of inclusion is very open and has been the subject of vari-ous interpretations. A widely accepted deinition of inclusive growth was established by the Commission on Growth and Development: ‘output growth that is sustained over decades, is broad-based across economic sectors, creates productive employment opportunities for a great majority of the country’s working age population, and reduces poverty’ (Samans and Corrigan 2015, 3).
education plays a crucial role in building an inclusive society (Armstrong and Spandagou 2009, 4).
Besides this, we know from theoretical growth literature that educa-tion has a signiicant role in economic well-being as well. This issue is again rather complex and now we are trying to grasp the essence of the importance of education via three simple assumptions. Firstly, education improves human capital that is inherent in labour force and results in higher level of output (Mankiw 1992). Secondly, education also improves the innovative capacity of the economy leading to new products, pro-cesses, and technologies that promote growth (Lucas 1988; Romer 1990; Aghion and Howitt 1998). Finally, education facilitates the understand-ing, the use, and the implementation of new technologies (Nelson and Phelps 1966; Benhabib and Spiegel 1994). Nevertheless, it is important to note that the quality of education strongly matters in successfully reach-ing such outcomes (Hanushek and Woessmann 2010, 245).
In our paper, we refer to knowledge as an asset, which has a unique na-ture with special characteristics and a vital role in the production process. Knowledge can be assumed as a global public good (Stiglitz 2006): it does not devaluate when it is used by other people; the value of knowledge is in fact higher when it is shared; nobody can be excluded from possessing it, and it cannot be unlearned once it is learned (Witoń 2014). Moreover, knowledge can be understood as a form of capital and, as such, it also re-quires investment (Schultz 1961) or else it is going through amortization with time (Pelle 2013). On the other hand, knowledge is strongly linked to individuals: it can only be used by them, and it contributes to economic growth only when it is utilized. In this sense, education plays a crucial role in giving individuals skills and cognitive abilities (Hanuschek and Woess-mann 2008) and investment in education is indirectly an investment in human capital (Schultz 1979).
Ro-drik 2007; Acemoglu and Robinson 2012). In line with theory, we use the World Economic Forum’s deinition of competitiveness, according to which competitiveness is ‘a set of institutions, policies and factors that determine the level of productivity of a county’ (World Economic Forum 2014, 4). The deinition implies that the more productive a country, the more competitive it is and the more it is able to generate and provide wealth to the members of its society. At the same time, other compet-itiveness deinitions such as international competcompet-itiveness (Durand and Giorno 1987), trade competitiveness (Inter-American Development Bank 2001) and global comparative advantages are based on cost and price dif-ferentials. As some authors suggest, the member states of the European Union are developed economies that should not enter the race of cost competitiveness, but rather focus on a knowledge-based competitiveness to enhance aggregate productivity (Di Mauro and Foster 2011).
Furthermore, the quality of individuals and thus the quality of soci-ety has a strong efect on countries’ economic performance and competi-tiveness. Without a strong basis of skilled, healthy and active individuals, who are living in a society that is providing equal opportunities for its members, the success of economic performance is hindered. Moreover, the growing number of social groups living in poverty threatens the long-term growth prospects of an economy and, at the same time, appears as a major risk to stability and social progress (Stiglitz 2012).
Data and Methodology
In our analysis, we examine the European Union member states’ perfor-mance in terms of competitiveness and social inclusion. For this purpose, we rely on data from the World Economic Forum (wef) and the Eurostat. Based on the European Union member states’ performance on the wef Global Competitiveness Index (table 1), we create six country groups (ta-ble 2). These country groups are also aimed to relect the territorial cohe-sion problematique in the European Union. Furthermore, although the gci is comprised of 114 indicators, the components of social inclusion are not included in the index. In case there is a correlation between compet-itiveness and an inclusive society that is not on the level of data.
table 1 Ranking and Score on the gci of the eu Member States
Country - - Country - -
() () () () () () () ()
Austria . . Italy . .
Belgium . . Latvia . .
Bulgaria . . Lithuania . .
Croatia . . Luxembourg . .
Cyprus . . Malta . .
Czech Republic . . Netherlands . .
Denmark . . Poland . .
Estonia . . Portugal . .
Finland . . Romania . .
France . . Slovakia . .
Germany . . Slovenia . .
Greece . . Spain . .
Hungary . . Sweden . .
Ireland . . United Kingdom . .
notes Column headings are as follows: (1) rank, (2) score.
table 2 Country Groups
Country group Members
1 Northern Europe Denmark, Sweden, Finland
2 Western Europe Austria, Belgium, United Kingdom, France,
Nether-lands, Ireland, Luxembourg and Germany
3 Baltics Estonia, Latvia, Lithuania
4 Southern Europe Cyprus, Malta, Portugal, Spain, Italy
5 Central and Eastern Europe Czech Republic, Slovakia, Poland, Hungary, Slovenia
6 Balkans Croatia, Greece, Romania, Bulgaria
in points can be found in the Western European group, mainly because it is the most numerous country group with eight countries. The positions of the eu member states range between 4 and 81 on the gci index, with the biggest diference in ranks (33) in the group of Central and Eastern European Member States. These rankings already suggest a competitive-ness divide within the European Union.
perfor-table 3 Country Groups According to the Performance on the Global Competitiveness Index, 2014–2015
Country group Average (score) Range (points) Range (rank)
Northern Europe . . (–)
Western Europe . . (–)
Baltics . . (–)
Southern Europe . . (–)
Central and Eastern Europe . . (–)
Balkans . . (–)
eu (total) . . (–)
notes Adapted from World Economic Forum (2014).
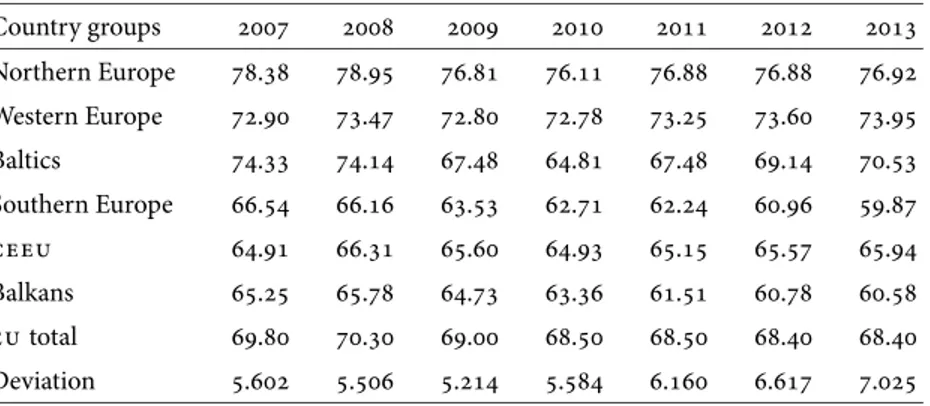
mance along the indicators under the inclusive priority of the Europe 2020 strategy. Nonetheless, we analyze the data on a larger time scale in order to reveal the dynamics of performance and the efects of the 2008 economic crisis. The irst such indicator is employment rate (table 4).
When calculating the employment rates (eji) for the country groups (cg), we add up the countries’ active (aji) and inactive (iaji) 20–64 year-old population groups, thus receiving the working-age population in each country group. Afterwards, we add up the number of employed persons in all country groups respectively. Then we divide the number of em-ployed persons by the number of people in the working-age population of the country group, for all six groups, and for all ive years.
j=1, 2, 3...6.
ij: i1=1, 2, 3, i2 =1, 2, 3...8, i3=1, 2, 3,
i4=1, 2, 3...5, i5=1, 2, 3...5, i6=1, 2, 3, 4, i∈cgj.
ecgj =
eji
aji+iaji
.
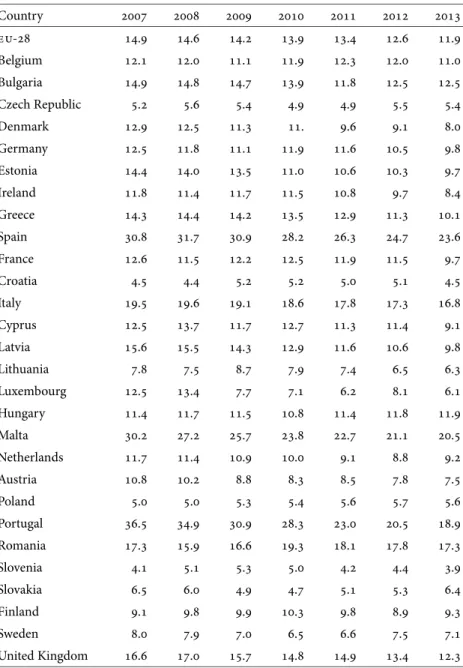
table 4 Employment Rates in the European Union, 2007–2013
Country
eu- . . . . . . .
Belgium . . . . . . .
Bulgaria . . . . . . .
Czech Republic . . . . . . .
Denmark . . . . . . .
Germany . . . . . . .
Estonia . . . . . . .
Ireland . . . . . . .
Greece . . . . . . .
Spain . . . . . . .
France . . . . . . .
Croatia . . . . . . .
Italy . . . . . . .
Cyprus . . . . . . .
Latvia . . . . . . .
Lithuania . . . . . . .
Luxembourg . . . . . . .
Hungary . . . . . . .
Malta . . . . . . .
Netherlands . . . . . . .
Austria . . . . . . .
Poland . . . . . . .
Portugal . . . . . . .
Romania . . . . . . .
Slovenia . . . . . . .
Slovakia . . . . . . .
Finland . . . . . . .
Sweden . . . . . . .
United Kingdom . . . . . . .
notes Based on data from Eurostat (http://ec.europa.eu/eurostat).
table 5 Employment Rates in the Country Groups, 2007–2013
Country groups
Northern Europe . . . . . . .
Western Europe . . . . . . .
Baltics . . . . . . .
Southern Europe . . . . . . .
ceeu . . . . . . .
Balkans . . . . . . .
eu total . . . . . . .
Deviation . . . . . . .
notes Based on data from Eurostat (http://ec.europa.eu/eurostat).
has risen above the eu average with 70.53 in 2013. Southern European countries and the Balkans group experienced the biggest setback in the period between 2007 and 2013: employment rate in their case has gradu-ally decreased (with the exemption of 2007–2008 in the Balkans group) and there are still no signs of improvement. For the Central and East-ern European countries, employment rate declined in the period between 2008 and 2010 while a moderate growth can be examined since 2011. Still, employment rate in this country group is below the eu average.
As it is indicated in the last line of the table, the deviation between the country groups in terms of employment rate has increased, suggesting that there are growing diferences in their performance. The situation is the most urging in the Southern European and Balkans country groups as their performance is lagging behind the others. They have not managed to even maintain their employment rates even though its importance is strongly emphasized in the Europe 2020 strategy.
table 6 Early School Leavers in the European Union, 2007–2013
Country
eu- . . . . . . .
Belgium . . . . . . .
Bulgaria . . . . . . .
Czech Republic . . . . . . .
Denmark . . . . . . .
Germany . . . . . . .
Estonia . . . . . . .
Ireland . . . . . . .
Greece . . . . . . .
Spain . . . . . . .
France . . . . . . .
Croatia . . . . . . .
Italy . . . . . . .
Cyprus . . . . . . .
Latvia . . . . . . .
Lithuania . . . . . . .
Luxembourg . . . . . . .
Hungary . . . . . . .
Malta . . . . . . .
Netherlands . . . . . . .
Austria . . . . . . .
Poland . . . . . . .
Portugal . . . . . . .
Romania . . . . . . .
Slovenia . . . . . . .
Slovakia . . . . . . .
Finland . . . . . . .
Sweden . . . . . . .
United Kingdom . . . . . . .
notes Based on data from Eurostat (http://ec.europa.eu/eurostat).
table 7 Tertiary Educational Attainment in the European Union, 2007–2013
Country
eu- . . . . . . .
Belgium . . . . . . .
Bulgaria . . . . . . .
Czech Republic . . . . . . .
Denmark . . . . . . .
Germany . . . . . . .
Estonia . . . . . . .
Ireland . . . . . . .
Greece . . . . . . .
Spain . . . . . . .
France . . . . . . .
Croatia . . . . . . .
Italy . . . . . . .
Cyprus . . . . . . .
Latvia . . . . . . .
Lithuania . . . . . . .
Luxembourg . . . . . . .
Hungary . . . . . . .
Malta . . . . . . .
Netherlands . . . . . . .
Austria . . . . . . .
Poland . . . . . . .
Portugal . . . . . . .
Romania . . . . . . .
Slovenia . . . . . . .
Slovakia . . . . . . .
Finland . . . . . . .
Sweden . . . . . . .
United Kingdom . . . . . . .
notes Based on data from Eurostat (http://ec.europa.eu/eurostat).
years in the period between 2007 and 2013 (1). This way we get the total population aged 18–24 years in the European Union member states and also in the country groups. In the following step, the number of the to-tal population aged 18–24 years (pop18-24ji) is divided by the percentage of early school leavers (eslji) of the Eurostat Europe 2020 indicator (2). This way we get the number of population aged 18–24 years not enrolled in education or training (eslij). As a inal step, the total number of popula-tion aged 18–24 year not enrolled in educapopula-tion or training in the country group is divided by the total number of population aged 18–24 years in the same country group. Finally, as a result, we arrive to the percentage of early school leavers in each country group (eslcgj).
pop18–24ji =
pop18ji+
pop19ji+
pop20ji
+
pop21ji+
pop22ji+
pop23ji
+
pop24ji. (1)
pop18–24ji
eslji =esl j
i. (2)
eslcgj=
eslji
pop18–24ji. (3)
Similarly, in the case of tertiary education attainment, the numbers of population from 30 to 34 years are summed up, in order to get the total number of population (pop30–34ji) in this age group (4). As a next step, this number is divided by the percentage of Europe 2020 tertiary educa-tion indicator (teaji) from the Eurostat, giving the result of the number of population with tertiary education attainment (teaji) in the age group of 30–34 years (2). Finally, the total number of population with tertiary level education attainment in the country group is divided by the total num-ber of population aged 30–34 years in the country group. As a result, the percentage of population aged 30–34 years with tertiary level educational attainment (teacgj) in the country groups is calculated (3).
pop30–34ji =
pop30ji+
pop31ji+
pop32ji
+
pop33ji+
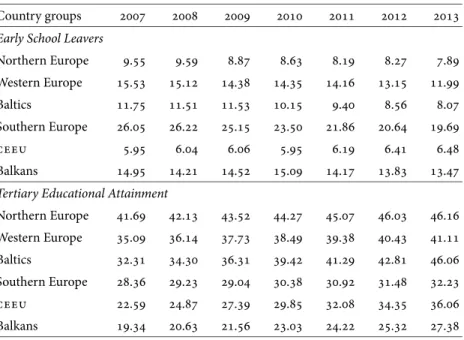
table 8 The Rates of Early School Leavers and Tertiary Educational Attainment, 2007–2013
Country groups
Early School Leavers
Northern Europe . . . . . . .
Western Europe . . . . . . .
Baltics . . . . . . .
Southern Europe . . . . . . .
ceeu . . . . . . .
Balkans . . . . . . .
Tertiary Educational Attainment
Northern Europe . . . . . . .
Western Europe . . . . . . .
Baltics . . . . . . .
Southern Europe . . . . . . .
ceeu . . . . . . .
Balkans . . . . . . .
notes Based on data from Eurostat (http://ec.europa.eu/eurostat).
pop30–34ji
teaji =tea j
i. (5)
teacgj =
teaji
pop30–34ji. (6)
The 10 percent target has already been achieved in the Northern Eu-ropean region where the rate of early school leavers is decreasing further. The rate of early school leavers is also under 10 in the Central and East-ern European country group (mainly due to political traditions); how-ever, there has been a growing tendency in the number of early school leavers in the past few years. For the Southern European region, the rate of early school leavers decreased by 6.36points but it is still the highest among the country groups with 19.69. In the case of the Baltic countries, the decrease in the rate of early school leavers was relatively the largest. In the Balkans group, the rate of early school leavers was increasing in the period between 2008 and 2010 when it gradually started to decrease.
in all country groups (the only exception is a slight drop in the Southern European group in year 2009). The greatest progress has been achieved in the Baltic group where the rate of tertiary educational attainment in-creased by 13.75points in the period between 2007 and 2013. Similarly, in the Central and Eastern European group, the rate of tertiary educa-tion attainment increased by 13.47points in the same period. The rela-tively smallest growth was experienced in the Southern European coun-try group, only 3.87points over the 7 years period.
Overall, the Member States of the European Union are heading to-wards the education targets of the Europe 2020 strategy. There is a clear progress in these terms but there are evident diferences in the perfor-mances of the country groups.
The third and inal indicator of an inclusive society under the Europe 2020 strategy is poverty. The indicator of people living at risk of poverty or social exclusion is composed of three sub-indicators, namely the peo-ple living in low work intensity households, the peopeo-ple living in poverty after social transfers, and the severely materially deprived people. At risk of poverty are the persons with an equivalized disposable income be-low the risk-of-poverty threshold, which is set at 60 of the national median equivalized disposable income (after social transfers). Material deprivation covers indicators relating to economic strain and durables. Severely materially deprived persons have living conditions severely con-strained by a lack of resources, they experience at least 4 out of 9 fol-lowing deprivations items: cannot aford (1) to pay rent or utility bills, (2) keep home adequately warm, (3) face unexpected expenses, (4) eat meat, ish or a protein equivalent every second day, (5) a week holiday away from home, (6) a car, (7) a washing machine, (8) a colour tv, or (9) a telephone. People living in households with very low work intensity are those aged 0–59 living in households where the adults (aged 18–59) work less than 20 of their total work potential during the past year (see http://ec.europa.eu/eurostat/data/database). It is important to note that the people who belong to more than one category are only considered once.
In the case of poverty rates, the number of people living at risk of poverty or social exclusion (aropeji) is divided by the number of total population (populationji) in each country group.
aropecgj=
aropeji
table 9 People living at risk of poverty or social exclusion, 2007–2013
Country
eu- – – – . . . .
Belgium . . . . . . .
Bulgaria . . . . . . .
Czech Republic . . . . . . .
Denmark . . . . . . .
Germany . . . . . . .
Estonia . . . . . . .
Ireland . . . . . . .
Greece . . . . . . .
Spain . . . . . . .
France . . . . . . .
Croatia – – – . . . .
Italy . . . . . . .
Cyprus . . . . . . .
Latvia . . . . . . .
Lithuania . . . . . . .
Luxembourg . . . . . . .
Hungary . . . . . . .
Malta . . . . . . .
Netherlands . . . . . . .
Austria . . . . . . .
Poland . . . . . . .
Portugal . . . . . . .
Romania . . . . . . .
Slovenia . . . . . . .
Slovakia . . . . . . .
Finland . . . . . . .
Sweden . . . . . . .
United Kingdom . . . . . . .
notes Based on data from Eurostat (http://ec.europa.eu/eurostat).
table 10 People Living at Risk of Poverty or Social Exclusion, 2007–2013
Country groups
Northern Europe . . . . . . .
Western Europe . . . . . . .
Baltics . . . . . . .
Southern Europe . . . . . . .
ceeu . . . . . . .
Balkans . . . . . . .
notes Based on data from Eurostat (http://ec.europa.eu/eurostat).
(table 9). Similarly to the previous indicators, we analyze the time period between 2007 and 2013. (Unfortunately, some data were unavailable for Croatia from 2007 to 2009. To solve this problem, we took the median value of the data 2010–2013 and substituted the missing information this way.)
The proportion of people living at risk of poverty or social exclusion shows a growing tendency in the period between 2007 and 2013 in four of the country groups, with the exception of the Central and Eastern Euro-pean region and the Balkans. However, it is still worrisome that 40.51 of the population in the Balkans region is living at risk of poverty or social exclusion. The largest increase in the portion of such people occurred in the Southern European country group where 28.07 of the population was exposed to this risk in 2013. The growing number of people living at risk of poverty or social exclusion in the Northern and Western Eu-ropean region is signalling a need for policy implications in this ield in these rather developed countries as well.
As a following step, we present the decomposition of the people living at risk of poverty or social exclusion indicator, revealing the very nature of the poverty issue.
worry-table 11 Decomposition of the Poverty Indicator, 2007–2013
Country groups
People Living in Very Low Work Intensity Households
Northern Europe . . . . . . .
Western Europe . . . . . . .
Baltics . . . . . . .
Southern Europe . . . . . . .
ceeu . . . . . . .
Balkans . . . . . . .
People Living in Poverty After Social Transfers
Northern Europe . . . . . . .
Western Europe . . . . . . .
Baltics . . . . . . .
Southern Europe . . . . . . .
ceeu . . . . . . .
Balkans . . . . . . .
Severely Materially Deprived People
Northern Europe . . . . . . .
Western Europe . . . . . . .
Baltics . . . . . . .
Southern Europe . . . . . . .
ceeu . . . . . . .
Balkans . . . . . . .
notes Based on data from Eurostat (http://ec.europa.eu/eurostat).
ing in the Southern European and Balkans country groups as the propor-tion of people living in low work intensity households here was clearly decreasing before the crisis but since then there has been no success in tackling this problem.
stably low in the Northern, the Western, and the Central and Eastern Eu-ropean country groups. The respective rate is the highest in the Balkans group, followed by the Baltics and Southern Europe although some ten-dencies of improvement can be traced in these groups since 2007.
The proportion of people living in severely materially deprived cir-cumstances shows the biggest deviation among the poverty indicators. In the Northern and in the Western European region the rate of these people is relatively low; however, it shows a growing tendency from 2010 onwards. The rate of severely materially deprived people reached its peak in 2011 in the Baltics group with 20.85. This ratio has decreased by 3.86 points until 2013, which is now lower than before the crisis in 2007. Still, it is the second highest among the country groups. The Central and Eastern European countries are performing well on this indicator: the portion of severely materially deprived people has been decreasing since 2007; their rate is currently 5.43points lower than it was 7 years ago. On the other hand, the respective rate is constantly growing in the Southern European region. In fact, it has almost doubled since 2007 and by now 9.96 of the population belongs to this group. Although the countries of the Balkans have achieved some improvements, the indicator for this country group is constantly high; 28.26 of the population was afected by the problem in 2013.
Competitiveness and an Inclusive Society
We were keen on inding relations between inclusion and competitive-ness. For this purpose, we created a new indicator that summarizes the performance of the eu member states along the four inclusion indicators that have been discussed above in detail (table 12). We named it ‘inclusive indicator’ and in our calculations we used the Eurostat headline indica-tors of the Europe 2020 strategy. The inclusive indicator is based on the wef’s methodology used for creating secondary indices, calculated by applying the following formula:
country score – sample minimum
sample maximum – sample minimum. (8)
table 12 Inclusive Indicator
Country () () () () ()
(a) (b) (a) (b) (a) (b) (a) (b) (b)
Austria . . . . . . . . .
Belgium . . . . . . . . .
Bulgaria . . . . . . . . .
Croatia . . . . . . . . .
Cyprus . . . . . . . . .
Czech Republic . . . . . . . . .
Denmark . . . . . . . . .
Estonia . . . . . . . . .
Finland . . . . . . . . .
France . . . . . . . . .
Germany . . . . . . . . .
Greece . . . . . . . . .
Hungary . . . . . . . . .
Ireland . . . . . . . . .
Italy . . . . . . . . .
Continued on the next page
(employment rate, rate of early school leavers, tertiary educational attain-ment, and poverty). In the following step, we take the simple average of these four scores that inally give us a value of the inclusive indicator for each individual member state (table 12). This indicator is relecting the diferences in the performance of the member states along the indicators related to the widely agreed criteria of an inclusive society.
Since the latest data available on Eurostat are from 2013, we have de-cided to use the scores of member states on the 2013–2014 Global Com-petitiveness Index representing their comCom-petitiveness performance. Fig-ure 1 presents the connection between competitiveness and the degree of social inclusion in the eu member states.
As the value ofR2 = 0.4741 suggests, there is a positive and medium
table 12 Continued from the previous page
Country () () () () ()
(a) (b) (a) (b) (a) (b) (a) (b) (b)
Latvia . . . . . . . . .
Lithuania . . . . . . . . .
Luxembourg . . . . . . . . .
Malta . . . . . . . . .
Netherlands . . . . . . . . .
Poland . . . . . . . . .
Portugal . . . . . . . . .
Romania . . . . . . . . .
Slovakia . . . . . . . . .
Slovenia . . . . . . . . .
Spain . . . . . . . . .
Sweden . . . . . . . . .
United Kingdom . . . . . . . . .
notes Column headings are as follows: (1) employment rate, (2) early school leavers, (3) tertiary education, (4) people at risk of poverty, (5) total, (a) percentage, (b) score. Based on data from Eurostat (http://ec.europa.eu/eurostat).
. . . . . . . . . . . . . . . . . . . . . . . . . . . . Austria Belgium Bulgaria Croatia
Cyprus Czech Rep.
Denmark Estonia Finland France Germany Greece Hungary Ireland Italy Latvia Lithuania Luxembourg Malta Netherlands Poland Portugal Romania Slovakia Slovenia Spain Sweden United Kingdom In cl usiv e indic at o r
Scores on the gci
y=0.2655x−0.6402,R2=0.4741
figure 1 The Connection between eu Member States’ Competitiveness and Social Inclusion
necessary but not suicient condition for a competitive economy. Never-theless, the cases of the Southern European and the Balkans group sup-port our basic hypothesis. The performance of the countries belonging to these groups shows that the absence of an inclusive society is hindering countries in their exploiting their full potential, thus their competitive-ness.
Accordingly, based on the relations between competitiveness and an inclusive society, we can distinguish three country groups: irstly, there are countries with relatively high scores on both the gci and our inclu-sive indicator (Northern and Western Europe in our grouping); secondly, countries with moderate scores on the gci but relatively high scores on our inclusive indicator (Central and Eastern Europe and the Baltic states); thirdly, countries with relatively lower scores both on the gci and the inclusive indicator (Southern Europe and the Balkans). Regarding the territorial aspects, there are two exceptions: Hungary and Cyprus. Hun-gary, although a Central and Eastern European country, shows a closer relation to the Southern European and Balkans groups according to its performance (relatively lower scores both on the gci and the inclusive indicator) while Cyprus’ position is more similar to that of the Central and Eastern European countries (moderate scores on the gci but rela-tively higher scores on the inclusive indicator). All the other countries’ performance is in line with that of the other members in their (territori-ally organized) country groups. All this suggests that there are fractions in the European Union that threaten not only the territorial cohesion but also the eu’s performance as a whole.
Conclusion
The aim of our analysis was to discover and present the components of an inclusive society in the European Union. For this purpose, we analyzed the eu member states’ performance along the four indicators of the Eu-rope 2020 strategy targeting inclusive growth. Furthermore, the classii-cation of eu member states into country groups on a geographical basis has enabled us to trace the discrepancies in territorial cohesion as well.
lagging behind. In the case of employment rates, nevertheless, which has been targeted by both the Lisbon and the Europe 2020 strategies, there is either a moderate growth or a decline in the country groups. The situation is somewhat brighter for the education targets where all member states are making progress; however, this progress is not even. Poverty appears to be the greatest social problem as the proportion of people living at risk of poverty or social exclusion has been increasing since 2007, reaching 40.51 in the Balkans and 28.07 in Southern Europe. Through a deeper analysis of the poverty indicator and its elements, we have shown that the rate of severely materially deprived people is the most diverse among the country groups, and it represents a threat on social inclusion, especially in the Balkans.
Overall, we assume that an inclusive society is a necessary condition for a competitive economy. To prove this assumption, we have established an inclusive indicator and have compared it with the eu member states’ scores on the Global Competitiveness Index. We have found that the lack of social inclusion worsens the competitiveness of countries; in addition, diferences among the member states can be identiied on these dimen-sions as well. Our results show that there are fractions in the European Union and imply the need for policies in the social ield, for competitive-ness reasons as well.
Acknowledgments
The research on which this article is based has been carried out in the framework of the project titled ‘Need for a competitiveness union in the eu,’ project id: 553486-epp-1-2014-1-hu-eppjmo-chair. All support is gratefully acknowledged. The authors also owe their thanks to Marcell Zoltán Végh for his intellectual support provided in the course of draft-ing this paper.
References
Acemoglu, D., and J. Robinson. 2012.Why Nations Fail: The Origins of Power, Prosperity and Poverty.New York: Crown Business.
Aghion, P., and P. Howitt. 1998.Endogenous Growth Theory.Cambridge, ma: mit Press.
Armstrong, A., and I. Spandagou. 2009. ‘Poverty, Inclusion and Inclusive Education: Exploring the Connections.’ Paper presented at the aare Annual Conference, Canberra, 29 November–3 December.
Benhabib, J., and M. Spiegel. 1994. ‘The Role of Human Capital in Eco-nomic Development: Evidence from Aggregate Cross-Country Data.’ Journal of Monetary Economics34 (2): 143–74.
Di Mauro, F., and K. Foster. 2011. ‘Competitiveness as a Multi-Dimensional Concept.’ InRecovery and Beyond: Lessons for Trade Adjustment and Competitiveness,ed. F. di Mauro and B. R. Mandel, 12–9. Frankfurt: European Central Bank.
Durand, M., and C. Giorno 1987. ‘Indicators of International Competi-tiveness: Conceptual Aspects and Evaluation.’oecd Economic Studies 9:147–82.
European Commission. 2010. ‘Europe 2020: A Strategy for Smart, Sustain-able and Inclusive Growth.’ com(2010) 2020, European Commission, Brussels.
Hanushek, E. A., and L. Woessmann. 2008. ‘The Role of Cognitive Skills in Economic Development.’Journal of Economic Literature46(3), 607–68. ———. 2010. ‘Education and Economic Growth.’ InInternational Encyclo-pedia of Education,ed. P. Peterson, E. Baker and B. McGaw, vol. 2, 245– 52. Oxford: Elsevier.
Inter-American Development Bank. 2001.Competitiveness: The Business of Growth.Washington, dc: Inter-American Development Bank. Lucas, R. E. 1988. ‘On the Mechanics of Economic Development.’Journal
of Monetary Economics22:3–42.
Mankiw, N. G., Romer, D., and D. Weil. 1992. ‘A Contribution to the Em-pirics of Economic Growth.’Quarterly Journal of Economics 107 (2): 407–37.
Nelson, R. R., and E. Phelps. 1966. ‘Investment in Humans, Technology Difusion and Economic Growth.’American Economic Review56 (2): 69–75.
Pelle, A. 2013. ‘The European Social Market Model in Crisis: At a Cross-roads Or at the End of the Road?’Social Sciences2 (3): 131–46. Pelle, A., and M. Végh. 2014a. ‘A Comparative Analysis of Competition
Across the eu Internal Market: Evidence from 11 eu Member States.’ Paper presented at the Inaugural winir Conference, London, 11–14 September.
———. 2014b. ‘Relations between the Common r&d&i Policy and the Competitiveness Divide in the European Union.’ Paper presented at the 13th eaces Conference, Budapest, 4–6 September.
Rodrik, D. 2007.One Economics, Many Recipes: Globalization, Institutions, and Economic Growth.Princeton, nj: Princeton University Press. Romer, P. 1990. ‘Endogenous Technological Change.’ Journal of Political
Economy99 (5, pt. 2): 71–102.
Fo-rum’s Global Competitiveness Index.’ InDimensions of Competitive-ness,ed. by P. De Grauwe, 1–18. Cambridge, ma: mit Press.
Samans, R., Blanke, J., Corrigan G., and M. Drzeniek. 2015. ‘Benchmarking Inclusive Growth and Development.’ World Economic Forum Discus-sion Paper, World Economic Forum, Geneva.
Schultz, T. W. 1961. ‘Investment in Human Capital.’The American Economic Review51 (1): 1–17.
———. 1979. ‘The Economics of Being Poor.’ Lecture to the memory of Alfred Nobel, 8 December. http://www.nobelprize.org/nobel_prizes/ economics/laureates/1979/schultz-lecture.html
Stiglitz, J. E. 2006. ‘Global Public Goods and Global Finance.’ InAdvancing Public Goods,ed. J. Toufut, 149–64. Cheltenham: Edward Elgar. ———. 2012.The Price of Inequality: How Today’s Divided Society
Endan-gers Our Future.New York: Norton.
World Economic Forum. 2014.The Global Competitiveness Report 2014– 2015.Geneva: World Economic Forum.
Witoń, A. 2014. Knowledge as a Public Good in the Modern Economy. InFirm-Level Internationalisation and its Business Environment,ed. N. Daszkiewicz and K. Wach, 59–9. Gdansk: Gdansk University of Tech-nology.