Performance of Baited Underwater Video:
Does It Underestimate Abundance at High
Population Densities?
Ben Stobart1,2
*, David Díaz1,3, Federico Álvarez1, Cristina Alonso4, Sandra Mallol1,
Raquel Goñi1
1Instituto Español de Oceanografía, Centro Oceanográfico de Baleares, Muelle de Poniente s/n, 07015, Palma de Mallorca, Spain,2South Australian Research and Development Institute, Port Lincoln Marine Science Centre, PO Box 1511, Port Lincoln, SA 5606, Australia,3Institut de Ciències del Mar, Consejo Superior de Investigaciones Científicas, Passeig Maritim de la Barceloneta, 37–49, 08003, Barcelona, Spain,
4I.M.E.M. Ramón Margalef, Universidad de Alicante, Alicante, Spain
Abstract
Video survey techniques are now commonly used to estimate animal abundance under the assumption that estimates relate to true abundance, a key property needed to make video a valid survey tool. Using the spiny lobsterPalinurus elephasas our model organism, we eval-uate the effectiveness of baited underwater video (BUV) for estimating abundance in areas with widely different population density. We test three BUV abundance metrics and com-pare the results with an independently obtained abundance index from trammel-net surveys (Trammel). Video metrics used to estimate relative abundance include a value for total num-ber of individuals per recording (TotN), the traditional maximum numnum-ber of fish observed in a single video frame (MaxN), and the recently suggested alternative, the average of the mean MaxN from 5-minute periods throughout the duration of the recording (MeanN). This is the first video study of a wild population to include an estimate for TotN. Comparison of TotN with the other two BUV relative abundance metrics demonstrates that both of the latter lack resolution at high population densities. In spite of this, the three BUV metrics tested, as well as the independent estimate Trammel, distinguished high density areas from low densi-ty areas. Thus they could all be used to identify areas of differing population densidensi-ty, but MaxN and MeanN would not be appropriate metrics for studies aimed at documenting in-creases in abundance, such as those conducted to assess marine protected area effective-ness, as they are prone to sampling saturation. We also demonstrate that time of first arrival (T1) is highly correlated with all of the abundance indices; suggesting T1 may be a potential-ly useful index of abundance. However, these relationships require further investigation as our data suggests T1 may not adequately represent lobster abundance in areas of high density.
OPEN ACCESS
Citation:Stobart B, Díaz D, Álvarez F, Alonso C,
Mallol S, Goñi R (2015) Performance of Baited Underwater Video: Does It Underestimate Abundance at High Population Densities? PLoS ONE 10(5): e0127559. doi:10.1371/journal.pone.0127559
Academic Editor:Judi Hewitt, University of Waikato
(National Institute of Water and Atmospheric Research), NEW ZEALAND
Received:November 12, 2014
Accepted:April 16, 2015
Published:May 26, 2015
Copyright:© 2015 Stobart et al. This is an open
access article distributed under the terms of the Creative Commons Attribution License, which permits unrestricted use, distribution, and reproduction in any medium, provided the original author and source are credited.
Data Availability Statement:All relevant data are
within the paper.
Funding:This work was supported by a grant from
Introduction
The use of video to study marine life has increased over the past twenty years, and a variety of video survey techniques are now commonly used for sampling marine populations (see reviews by [1–2]). Amongst others, the advantages of using video include the removal of the time and depth limitations associated with diver surveys, the potential for reductions in survey costs, the ability to check images as many times as necessary and the relative ease of training observers to process recordings. Importantly video sampling techniques are also non-extractive and there-fore well suited for studies on marine protected areas [3–4]. While video techniques do not necessarily outperform traditional sampling techniques such as visual census [5], they are free from diver bias and in many cases they have been demonstrated to perform better (e.g. [6–8]). In recent years the use of video systems has increased as technological improvements have made them cheaper and easier to use. Improvements include better video quality, increased filming times, a reduction in the size and cost of video recorders and changes to the recording media from tapes to direct storage on hard drives [2].
While video has been used for underwater surveys in many different ways [1–2], video sys-tems are commonly used as“traps”, with bait added to attract species of interest to the camera field of view (e.g. [4,7,9–11]). Baited underwater video (BUV) relies on target species being at-tracted to a bait and has been demonstrated to provide better statistical power than un-baited systems in the detection of spatial and temporal changes to both the relative abundance of spe-cies and the structure of fish assemblages [12–13]. The latter is possible because BUV systems attract more species and sample higher species diversity than un-baited systems [1]. The main disadvantage of using BUV is the unknown area of attraction of the bait that can vary depend-ing on the current [14] and estimatdepend-ing the attraction area to allow standardization of abun-dance estimates is inherently complicated (e.g. [15–16]). In addition, there may be variation in counts associated with interactions within and between species [17] and the upper limit of indi-viduals that can be counted in the field of view which is normally space-limited [18].
The introduction of video hardware to sample marine populations required the develop-ment of methods to retrieve information from recordings, particularly metrics that could be used as a proxy for true abundance. The most commonly used metric for this purpose has been MaxN, generally defined as the maximum number of fish observed in a single video frame [9–
10,19]. MaxN is popular as it is relatively easy to obtain and provides the minimum number of individuals known to occur in a recording, ensuring individuals are not counted more than once, and is considered a conservative index of abundance. Thus, to date, this statistic has been used as the standard index of abundance for video estimates (e.g. [1,8,11,17]). However, there is growing evidence that MaxN may provide dampened estimates of abundance with increasing true abundance, and therefore be prone to sampling saturation, as demonstrated by comparing MaxN with total numbers of fish in laboratory video deployments [20]. Thus using MaxN may result in positively biased indices of abundance for declining populations, or negatively biased indices when populations increase. If MaxN is prone to sampling saturation its use as a proxy for true abundance may be limited, in particular for studies that attempt to assess population recovery, such as those conducted in marine protected areas. Thus Schobernd et al. [20] pro-posed MeanCount, the mean number of fish observed in a series of snapshots over a viewing interval, as an alternative measure to MaxN because they found it to be linearly correlated with true abundance.
In this study we design, build and evaluate an effective, low cost, BUV system to sample the spiny lobsterPalinurus elephasin and around the Columbretes Islands Marine Reserve (hereaf-ter the“MPA”). We trialed BUV because the traditionally used method to capture this species for study is trammel netting which, while considered a highly efficient method for spiny lobster
Baited Video Performance at High Densities
Competing Interests:The authors have declared
fishing [21–22], is an extractive method and therefore not ideal for use in a MPA. BUV offered the advantage of being non-extractive and lends itself well to sampling lobsters which are scav-engers and therefore likely to be attracted to bait (e.g. [23]). Video is also ideal for use in the habitat depth range forP.elephasin and around the MPA of approximately 40–100 m, with possible extension to the full depth range of this species at other locations if required (200m; [24]). In this case underwater visual census by divers, the logical alternative non-extractive method, is not a viable option as the depth range lies below that considered safe to operate.
The aim of this study is to assess the performance of the BUV system and a range of metrics for measuring animal abundance in areas with widely different population density. We use the spiny lobsterP.elephasas our model organism and set out to evaluate the effectiveness of our design for estimating lobster abundance using three different metrics: the traditional MaxN metric for relative abundance, the more conservative MeanN, and the total number of lobsters visiting the bait, TotN, a value for total abundance per recording. We were able to estimate TotN for this spiny lobster species by capitalising on a key feature of spiny lobsters, their unique body patterns, that allow the identification of individuals [25–26], allowing them to be tracked through the recording. We evaluated the relationship between MaxN, MeanN and TotN and compared them with independently estimated abundance metrics from trammel-net surveys. This is the first study for which a comparison of the conventional MaxN metric and a total per recording metric has been possible under natural conditions. We also investigate, for the first time, the relationship between abundance metrics and time of first arrival as a possible abundance indicator.
Methods
Ethics statement
No ethics permits were required for the described study, which complied with all the relevant regulations. Permission to work in the Columbretes Marine Protected (center at 39°
52’32.70”N, 0°40’18.54”E) area was granted by the“Ministerio de Agricultura, Alimentación y Medio Ambiente”of Spain. The study did not use any endangered or protected species.
Study area
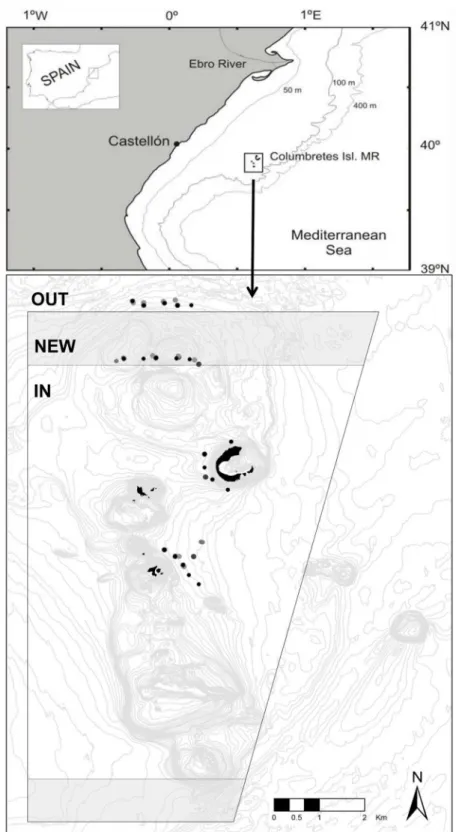
Fig 1. Map showing the location of the Columbretes Islands Marine Protected Area and detail of the levels of protection: IN, the MPA created in 1990; NEW, the area annexed to the MPA in 2009 and; OUT, the fished area outside the MPA.Marked points are the video deployment locations (on occasions shown as hollow points to facilitate viewing of multiple deployments in same general area).
doi:10.1371/journal.pone.0127559.g001
Sampling design
This study was conducted at the MPA and adjacent fishing grounds. Data presented are from 45 video deployments conducted during summer months (August—September) between 2006 and 2012. Deployments were made inside the MPA (n = 22), within the newly created protec-tion zone (NEW; n = 11) and in adjacent fishing grounds within 1 km of the MPA border (OUT; n = 12) (Fig 1). As an independent measure of abundance, we used data from experi-mental trammel net sampling (in the MPA and NEW zones), which has been the method of choice for monitoring lobster in the MPA since 1998, and by commercial trammel net fishing in the OUT area.
Baited video unit
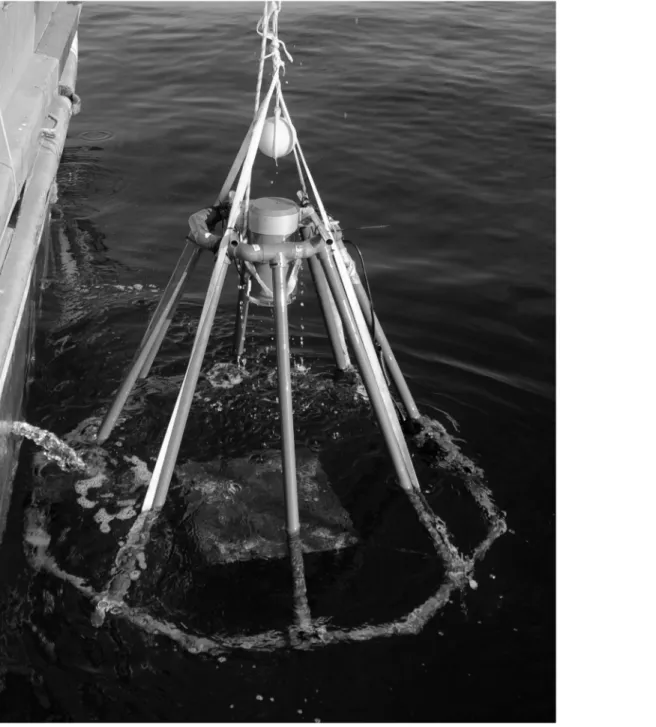
When considering BUV for sampling lobsters at depth we designed an economical, easy to build, BUV unit (similar to the fleet of BUVs designed by the Australian Institute of Marine Science; e.g. see [3]). Our design consisted of a digital video camcorder (Sony high resolution HDR-SR12E with BESEL super fish-eye 0.25 wide angle lens) held inside a custom made PVC underwater housing with acrylic viewing port. Recording time with a battery upgrade was in excess of 7 hours, with the duration of the light source used being the main limiting factor (ap-proximately 5–7 hrs). The housing was mounted vertically on a PVC tubing octopod (40 mm tubing) and octagonal base (50 mm tubing;Fig 2). This structure has the advantage of being very strong and stable, and the PVC tubing can be put together with relatively inexpensive“off the shelf”joints to minimise manufacture costs. The octopod base was ballasted using chain threaded inside the tubing which reduced the risk of snagging and ensured the unit landed up-right. Cameras provided a field of view of 90 x 60 cm, in the center of which was located a 60 x 40 cm bait bag. Recording was done on the“night shot”camera setting and illumination pro-vided by a 10w lamp with red filter. The red filter was considered useful to reduce the chance of light interfering with lobster presence as lobsters react less to red light than white light [29].
Video units attached to a surface buoy were deployed just after dark and left overnight for retrieval early next morning. A secondary weight (50kg) was used to avoid current force on the surface buoy line dragging the unit during its deployment period. Prior to each deployment ~500g of crushed sardines (Sardina pilchardus), an oily bait commonly used in baited video studies [30], were placed inside the mesh bait bag.
Video analysis
Video footage files were transferred to a hard drive for easy viewing on a PC. For each deploy-ment trained operators then recorded the time of first appearance for each lobster (T1) and the maximum number of lobsters attending the bait in 5 minute time blocks over 5 hours. The maximum abundance of lobsters for each recording was then calculated using (1) the highest record for the maximum number of lobsters visible at any one point in the 5 minute time inter-vals (MaxN), (2) the mean number of lobsters (MeanN) which was the mean MaxN from 5-minute periods throughout the duration of the recording as calculated by Schoberndet al. [20] and, (3) the total number of lobsters appearing in the entire recording, with individual lob-sters identified-in, and tracked through, the recordings using a combination of body patterns and/or damaged antennae and carapace size (TotN).
Trammel net sampling
MPA and in 2008 inside the NEW area. Trammel net abundance estimates from the fished area outside the MPA (OUT) come from onboard sampling of the commercial fishery around the MPA. Data used in this study were for the 2006 to 2012 period, totaling 135 fishing sets. The surveys are carried out with one of the commercial boats which operate in the area, with the same crew and gear type used in commercial fishing. Net length was 600 m and soak time 1 day for experimental fishing and 2–3 days for commercial fishing outside the MPA. As tram-mel net data was not available directly on the video deployment sites, we obtained an average trammel net abundance estimate for the vicinity of each video drop using trammel net data Fig 2. Baited underwater video system during deployment.
doi:10.1371/journal.pone.0127559.g002
from the three nearest experimental trammel net deployments, all within an average of ~400m from the video sites (max 850m). By doing this, we hoped to account for much of the variability associated with the spatial distribution of lobsters within the vicinity of the video deployments. This allowed us to compare mean abundance estimates of lobsters obtained using trammel nets (heareafter referred to as“Trammel”) with those from video deployments. A detailed descrip-tion of the trammel net survey methods is given in [31].
Data analyses
Correlations between T1, MaxN, MeanN, TotN and Trammel were explored using standard re-gression techniques (log, polynomial, and linear). The relationship between time and MaxN was explored by obtaining the MaxN for each 5 minute time period and calculating its percent-age in relation to the MaxN for the entire recording. Mean percent of MaxN ± SD was then computed across recordings and the relationship with time explored using a third order poly-nomial. Non-parametric Kendall’s tau (τ) correlations for pairwise comparisons was used to
assess the correlation between abundance estimates made with the four methods (MaxN, MeanN, TotN and Trammel) and with the time of first arrival (T1) of video deployments. Sig-nificance level was adjusted using the Bonferroni correction for multiple comparisons (ɑ=
0.005).
Differences between the three areas sampled (IN, NEW and OUT) in estimates of T1 and lobster abundance (MaxN, MeanN, TotN and Trammel) were tested using non-parametric Kruskal-Wallis tests. Where differences were significant a post-hoc Dunn’s test was used to identify which areas were significantly different (Bonferroni correctionɑ= 0.017).
Results
Performance of lobster baited video
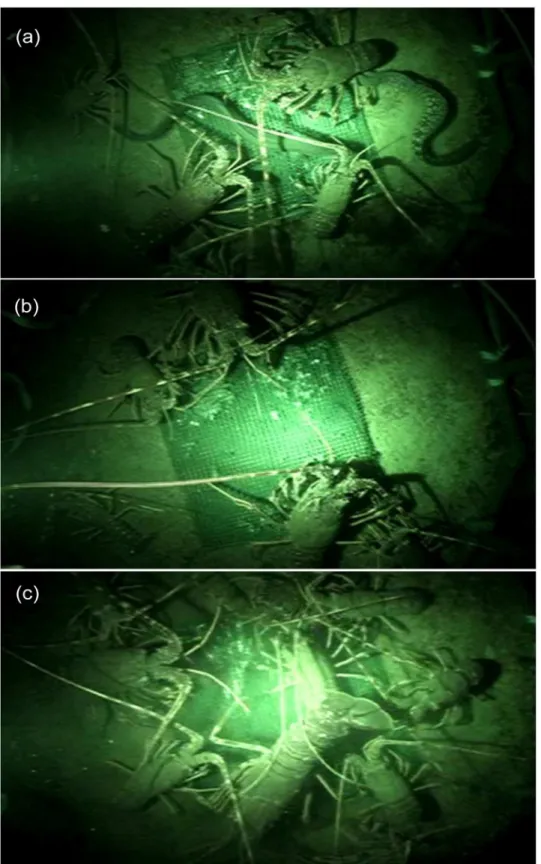
The baited video system proved to be very reliable, landing upright on all occasions and with few failures to record. The main species attracted to the bait was the targeted species,P.elephas
(Fig 3). In addition small unidentified crabs and hermit crabs were also relatively common. On rare occasions other species such as the eelsConger congerandMuraena helena(Fig 3a), grou-perEpinephelus marginatus, forkbeardPhycis phycisand octopusOctopus vulgarisalso at-tended the bait. With the exception of octopus leaving the bait when large eels arrived, there was no evidence of any one species excluding others from access to the bait. Within species, some largeP.elephaswere able to push smaller lobsters out of the way, but these still remained on the bait basket where it was common to have lobsters of all sizes side by side (Fig 3a–3c). Thus the presence of larger lobsters is not likely to have affected the counts.
Time of first arrival (T1) varied from as little as 5 minutes up to 2:30 hrs and generally de-creased with increasing MaxN on a logarithmic scale (Y = -1.724Ln(X) + 10.269, r2= 0.40;Fig
4a). Lobsters remained at the bait for an average of 66 minutes (±15 minutes SEM), with the maximum time a lobster remained at the bait being in excess of 5 hours. The highest MaxN reached was 10, with average values varying with protection level (see below). The relationship between mean percentage of MaxN and time was best explained by a third order polynomial where the percentage of MaxN generally increased fast over the first 1:30 hours and reached the highest mean percentage by 3:30 hours (Fig 5; Y = 7.653 + 0.556X
—0.002(X,2) + 1.057E-006
pow(X,3), r2= 0.77).
Fig 3. Video frame captures from the BUV system showing (a) lobsters (P.elephas) feeding at bait along with a moray eel (M.helena) and conger eel (C.conger); (b) large and small lobsters feeding at bait simultaneously; and (c) large number of lobsters feeding approaching the saturation point for the field of view.
doi:10.1371/journal.pone.0127559.g003
Fig 4. Relationships between (a) time of first arrival (T1) and lobster abundance metrics MaxN, MeanN, TotN, and Trammel; and (b) the estimation methods.Fitted solid lines are linear regressions and log fits (r2shown on graphs). Dashed lines indicate equal values for both metrics.
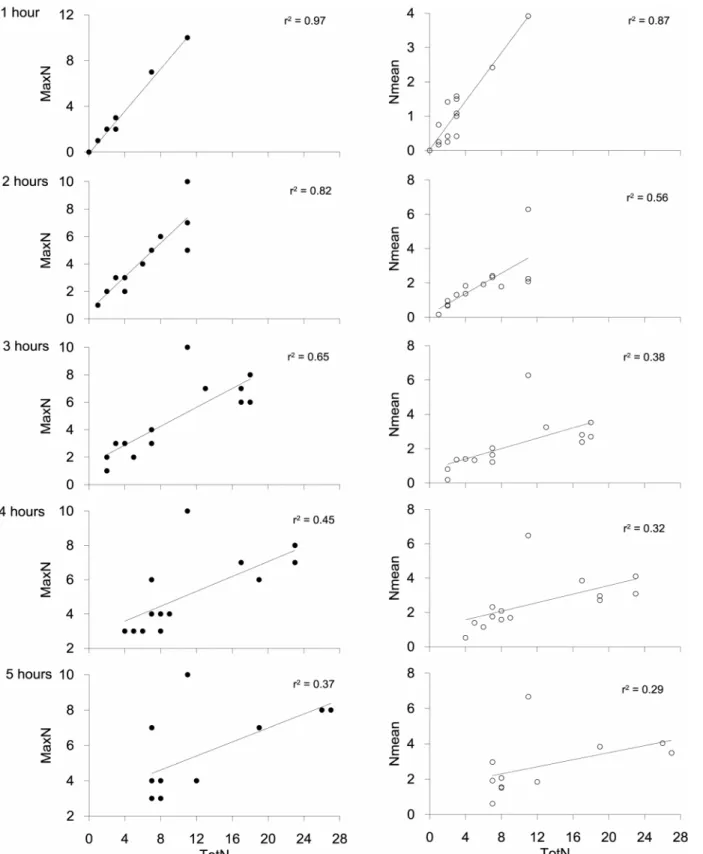
Both the highest MaxN (10) and MeanN (6) from all surveys were considerably lower than highest estimate of TotN (29;Fig 4b). MaxN was lower than TotN for ~60% of comparisons and, with the exception of one instance where MaxN and TotN were both 7, they were only equivalent when the total number of lobsters for the recording was 3 or less. MeanN is an aver-age for the entire recording and thus, as expected, was lower than TotN in all cases. Important-ly, the difference between TotN and both MaxN and MeanN was greatest in cases where TotN was high, as manifest by the levelling of the log curve for each of the comparisons (Fig 4b). Thus MaxN and MeanN are reaching a saturation point when the TotN exceeds approximately 10. This“saturation point”was only reached in the IN area, not in the NEW or OUT areas. The difference between MaxN, MeanN and TotN is not as apparent in the first two hours of re-cording, as suggested by the decreasing r values over time, probably due to the longer time needed for lobsters to accumulate at the bait (Fig 6). This suggests that longer deployment Fig 5. Mean percent of MaxN against video deployment time (minutes).Fitted solid line is a third order polynomial, dashed lines are the upper and lower standard deviations.
doi:10.1371/journal.pone.0127559.g005
Table 1. Kendalls tau (τ) correlations between video MaxN, MeanN and TotN and Trammel estimates of lobster abundance obtained in the study.
MeanN TotN Trammel T1
MaxN 0.87 (<0.001), n = 27 0.84 (<0.001), n = 34 0.59 (<0.001), n = 35 -0.51 (<0.001), n = 34
MeanN 0.74 (<0.001), n = 27 0.57 (<0.001), n = 27 -0.64 (<0.001), n = 27
TotN 0.59 (<0.001), n = 34 -0.45 (<0.001), n = 34
Trammel -0.27 (0.032), n = 34
Bonferroni correctedɑ= 0.005. Significant differences are in bold.
doi:10.1371/journal.pone.0127559.t001
Fig 6. Relationships between MaxN and MeanN against TotN by deployment time.r2and deployment times (hours) shown on graphs.
times are required to show the true extent of differences between areas of high and low density, as also suggested by the longer time taken (3:30 hrs) to reach Mean MaxN (Fig 5).
Abundance estimates and T1 inside and outside the MPA
Estimates of abundance obtained with BUV (all p0.0001) and T1 (p = 0.007) differed be-tween protection areas and are also consistent with those obtained for Trammel (p0.0001). Mean T1 in videos inside the MPA was 42% lower than videos in the NEW area of the MPA and 65% lower than videos deployed outside the MPA, with T1 for IN significantly different from OUT, but not between other combinations (Table 2;Fig 7). This is clear indication that lobsters arrive faster at the bait inside the MPA than they do outside, and suggests T1 may have some application as a proxy for abundance. The reduced number of videos for estimating means of T1 for OUT was due the high number of video deployments outside the MPA (70%) that did not record any lobsters, reflecting the lower abundance outside the MPA. MaxN, MeanN, TotN and Trammel estimates of abundance were also significantly higher inside the MPA than OUT (Table 2;Fig 8a) and did not show a significant difference between NEW and OUT. However, in contrast with T1, they also showed a significant difference between IN and NEW. Importantly, while the abundance estimates from the four methods used were quite dif-ferent from the difdif-ferent levels of protection, their percentage differences were similar between protection levels (Fig 8b). While the percentages were similar, it is noteworthy that estimates of lobster abundance from MeanN had a higher relative proportion at the IN protection level, possibly due to the influence“time at bait”has on the MeanN estimate. In contrast, trammel net estimates had a higher relative proportion outside the MPA, likely associated with the lon-ger soak time, but also possibly the larlon-ger area fished by trammel nets.
Discussion
The BUV system tested proved to be a reliable method for estimating relative density of lob-sters at depth and an effective, non-destructive, alternative to trammel net abundance estima-tion. We show, for the first time for a wild population, that the conventional BUV abundance metric MaxN, used as a measure of abundance for most BUV studies (e.g. [8,11,17]) lacks res-olution at high population densities, such as those found in well protected MPAs [28,32]. We demonstrate this by tracking individual lobsters throughout recordings, allowing us to estimate the total number of lobsters visiting the bait (TotN), and show that when lobster numbers are high, MaxN tends to asymptote. The point from which MaxN and TotN deviate is therefore likely the BUV field of view saturation point, lending weight to the concern that there is an
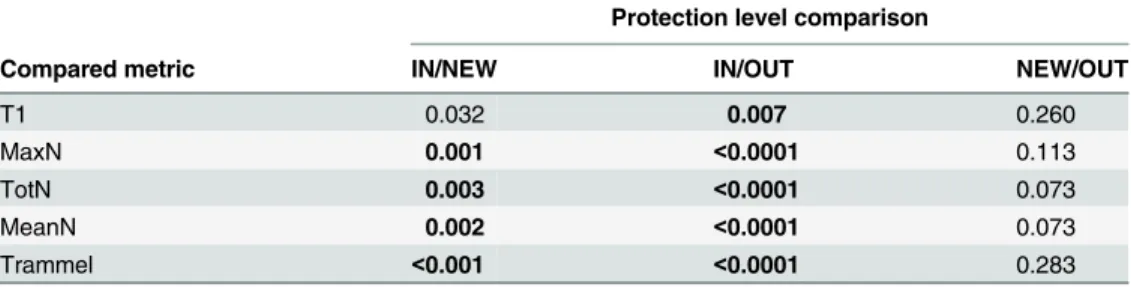
Table 2. Calculated p-values for multiple pairwise comparisons of time of first arrival (T1) and the four methods used for estimating lobster abundance, against the three levels of protection (IN, NEW and OUT), using Dunn’s procedure.
Protection level comparison
Compared metric IN/NEW IN/OUT NEW/OUT
T1 0.032 0.007 0.260
MaxN 0.001 <0.0001 0.113
TotN 0.003 <0.0001 0.073
MeanN 0.002 <0.0001 0.073
Trammel <0.001 <0.0001 0.283
Bonferroni correctedɑ= 0.017. Significant differences are in bold.
doi:10.1371/journal.pone.0127559.t002
upper limit to the number of target individuals that can occupy a BUV field of view [7,18], be it due to a physical limit to the space within the field of view or the bait canister, constraints as-sociated with species behavior or the declining probability of individuals all being within the frame of view simultaneously as abundance increases. This is consistent with a recent laborato-ry experiment by Schobernd et al. [20] that found MaxN was nonlinearly related to true abun-dance, and prone to sampling saturation. In addition, the other BUV metric we tested, MeanN, also showed a similar relationship with TotN and is therefore unlikely to be a more appropriate metric to use than MaxN. While Schobernd et al. [20] suggested MeanN may be useful as an al-ternative metric to MaxN for indexing abundance of fish, their trials may not have been close to the point of sampling saturation, and they concluded that further analysis would be appro-priate before concluding that MeanN could be a viable substitute for MaxN. There is also evi-dence that TotN is not linearly related to Trammel, suggesting a limit to counts from BUV may have been reached. However, direct comparison of these two methods is complicated by the longer soak time and larger sampling area of Trammel.
In spite of the differences between the methods outlined above, they all demonstrated that the abundance of lobsters was significantly greater inside the MPA than outside and that the NEW area in the MPA established in 2009 has not yet reached the same density of lobsters as the IN area that has been established since 1990. Therefore, all of these relative measures of abundance can be used to assess differences due to protection level and, in this case, that pro-tection leads to higher abundance. In addition, while the magnitude of the abundance estimates Fig 7. Mean time of first arrival±SD by protection level (MPA, NEW and OUT).Numbers on top of error bars indicate sample size.
we found between methods differed considerably, they all revealed a similar proportional dif-ference between the levels of protection. In particular, the corresponding patterns obtained for the independent metric Trammel and the BUV metrics highlight the potential for BUV to be-come a non-extractive alternative to Trammel. Other BUV studies, mostly focused on sampling Fig 8. (a) Mean number of lobsters counted±SD by protection level (IN, NEW and OUT; see legend) obtained from baited underwater video (MaxN, TotN and MeanN) and experimental trammel net fishing (Trammel). (b) Percent abundance comparison by method (see legend) and protection level (see legend).
doi:10.1371/journal.pone.0127559.g008
fish, have also demonstrated that BUV is suitable for detecting both spatial (e.g. [7,9]) and temporal differences [33] in relative abundance, while studies that have compared abundance indices obtained from BUV with those from alternative sampling methods have had mixed re-sults. These ranged from a high correlation in estimates between methods (e.g. longline—[9, 33]; seine nets—[34]; fish traps—[6]), to clear differences between them (underwater visual census—[7]). Thus correspondence between BUV and other sampling methods depends on the species being evaluated and the method being compared (see review by Mallet and Pelletier [2]). Importantly, our findings also indicate that MaxN and MeanN would not be the metrics of choice to conduct a study aimed at following the recovery of a population after rebuilding or protection measures have been implemented, such as in an MPA, as they would likely asymp-tote prior to full recovery, leading to the premature conclusion that recovery was complete. Willis et al. [7] also noted that the upper limit for MaxN could be“problematic when attempt-ing to detect differences between areas of high fish abundance”.
The close match highlighted above for the comparison of the proportions (percentages) ob-tained from the relative abundance metrics for the different levels of protection is reassuring. However, while they suggest all methods are suitable for detecting differences between levels of protection, there are differences that allude to the potential biases the different methods may have. In particular, MeanN gives a much higher percentage inside the MPA, and is very low outside. A likely explanation is that MeanN is influenced by the number of time blocks in which lobsters are present, and thus its value is raised inside the MPA. This bias, and the evi-dence that MeanN becomes saturated at high densities, suggests it may not be a suitable metric to substitute for MaxN as suggested by Schobernd et al. [20]. In contrast, Trammel is clearly more efficient at capturing lobsters at lower densities, in particular in the OUT area. In this case the likely cause of the bias is the longer soak time outside the MPA as well as the larger area being sampled by each Trammel deployment. It is noteworthy that despite this added
“fishing capacity”, catches from Trammel are not greatly different from those estimated by TotN that is limited to the relatively small video field of view and a smaller soak time. This can be in part explained by the fact that many lobsters will not be trapped by the net, as has also been found using fish and lobster traps rigged with video cameras that showed higher filmed abundances than were caught [6,23]. In addition, the bait used for BUV is attracting lobsters from a wider area which may be considerable, as lobsters arrived at the bait up to 2.5hrs after deployment. However, the effective attraction distance is difficult to estimate as, amongst oth-ers, it will depend on the current speed and direction (e.g. [14]).
regarded adequate at under an hour (e.g. [4,10,35]). Thus the added deployment time required for the lobster sampling ads to the processing time required, and therefore to the cost of analys-ing the video recordanalys-ings. In comparison with MaxN, estimation of TotN was an even more time consuming process due to the complexity of tracking individual lobsters throughout the recording. However in this instance TotN, a metric that to our knowledge has until now not been obtained for marine species in the wild, is critical to evaluating the limitations of MaxN and thus the added effort is justified. In view of the time investment required, and the fact that many species may not have unique patterns/features that allow identification of individuals, it is not surprising that TotN has not been explored previously. However, given time and re-sources this metric could be estimated as many marine species subject to video analysis have useful body markings. For example, bony fishes [36–37] and sharks [38–39] often have body patterns specific to individuals that could be used to track individuals through recordings. Im-portantly, modern video imagery provides better resolution than was available in the past, al-lowing use of finer scale markings and, in addition, the markings used do not have to be stable in time beyond the duration of the recording.
Our data demonstrate that all three estimates of abundance derived from the BUV are high-ly negativehigh-ly correlated with T1, suggesting that T1 may be a reliable proxy for abundance. As T1 can be quickly obtained from recordings, this relationship may be a useful way to dramati-cally reduce the processing costs associated with analyzing video recordings. However, at the high lobster abundance of the MPA reported here T1 was already close to zero, so it may not be as useful at higher abundance levels. In addition, T1 did not show the significant difference between the IN and NEW areas which was detected using the measures of relative abundance. This reduced sensitivity is likely due to the decrease in sample size for T1 that cannot be esti-mated when no lobsters are detected in the video recordings, whereas zero counts are repre-sented in estimates of relative abundance. Correlation between time of first arrival and abundance has been reported previously ([34,40]), although a study by Farnsworth et al. [15] using modelled data concluded that there was“no support from statistical theory”for their use. However, in view of the potentially large time savings to video processing, further exploration of the sensitivity and usefulness of this metric should be considered.
In conclusion, the BUV system we developed proved to be reliable for estimating the relative abundance ofP.elephas, almost exclusively attracting this species. Body markings specific to individual lobsters allowed us to estimate TotN and compare this estimation of the total num-ber of lobsters attracted to the BUV with the traditionally used and more recently suggested metrics MaxN and MeanN, respectively. Our findings demonstrate that all the metrics used (TotN, MaxN, MeanN and Trammel) are able to distinguish between high density areas and low density areas. However, neither MaxN nor MeanN would be appropriate metrics for stud-ies that seek to document increases in abundance, as they are prone to saturation and therefore likely to prematurely indicate that peak abundance has been reached. While TotN was useful to explore the relationships between these metrics, tracking lobsters through recordings requires a lot of video analysis time, so TotN is unlikely to be used extensively in future studies of lob-sters or other marine organisms without the aid of new software to automate the process. Time of first arrival may be a useful measure for some studies, but further work would be required to determine if it can be a useful index of abundance in areas of high density.
Acknowledgments
We thank the crews of the research vessels“Odon de Buen”and“SOCIB”and many team members for their assistance with video surveys, as well as the skipper and crews of the fishing lobster vessels“Calypso”and“Nuevo Calypso”. Thanks to the rangers at the Columbretes
Islands MPA for their assistance with logistics and to Diego Kersting for help in the field. We are grateful to Ana Parma for very useful comments to an earlier version of this manuscript and to two anonymous referees for their valuable suggestions in the revision of the manuscript.
Author Contributions
Conceived and designed the experiments: BS DD RG. Performed the experiments: BS DD RG SM. Analyzed the data: BS FA CA. Wrote the paper: BS RG.
References
1. Cappo M, Harvey E, Shortis M. Counting and measuring fish with baited video techniques—an over-view. In: Lyle JM, Furlani DM, Buxton CD eds. Proceedings of the 2006 Australian Society of Fish Biolo-gy Conference and Workshop on Cutting Edge Technologies in Fish and Fisheries Science, Hobart. August 2006. 2007; 101–114.
2. Mallett D, Pelletier D Underwater video techniques for observing coastal marine biodiversity: a review of sixty years of publications (1952–2012). Fish Res. 2014; 154: 44–62.
3. Cappo M, Harvey E, Malcolm H, Speare P. Potential of video techniques to monitor diversity, abun-dance and size of fish in studies of marine protected areas. In: Beumer JP, Grant A, Smith DC eds.“ A-quatic Protected Areas—what works best and how do we know?”. World Congress on Aquatic Protected Areas proceedings, Cairns, Australia. August 2002. 2003; pp 455–464.
4. Stobart B, García-Charton JA, Espejo C, Rochel E, Goñi R, Reñones O, et al. A baited underwater video technique to assess shallow-water Mediterranean fish assemblages: methodological evaluation. J Exp Mar Biol Ecol. 2007; 345: 158–174.
5. Tessier E, Chabanet P, Pothin K, Soria M, Lasserre G. Visual censuses of tropical fish aggregations on artificial reefs: slate versus video recording techniques. J Exp Mar Biol Ecol. 2005; 315: 17–30.
6. Bacheler NM, Schobernd CM, Schobernd ZH, Mitchell WA, Berrane DJ, Kellison GT, et al. Comparison of trap and underwater video gears for indexing reef fish presence and abundance in the southeast United States. Fish Res. 2013; 143: 81–88.
7. Willis TJ, Millar RB, Babcock RC. Detection of spatial variability in relative density of fishes: comparison of visual census, angling, and baited underwater video. Mar Ecol Prog Ser. 2000; 198: 249–260.
8. Harvey EA, Newman SJ, McLean D, Cappor M, Meeuwig JJ, Skepper CL. Comparison of relative effi-ciencies of stereo-BRUVs and traps for sampling tropical continental shelf demersal fishes. Fish Res. 2012; 125–126: 108–120.
9. Ellis D, DeMartini E. Evaluation of video camera technique for indexing abundances of juvenile pink snapper,Pristipomoides filamentosus, and other Hawaiian insular shelf fishes. Fishery Bull. 1995; 93: 67–77.
10. Willis TJ, Babcock RC. A baited underwater video system for the determination of relative density of carnivorous reef fish. Mar Freshw Res. 2000; 51: 755–763.
11. Merritt D, Donovan MK, Kelley C, Waterhouse L, Parke M, Wong K, et al.BotCam: a baited camera sys-tem form non-extractive monitoring of bottom species. Fish Bull. 2011; 109: 56–67.
12. Harvey ES, Cappo M, Butler JJ, Hall N, Kendrick GA. Bait attraction affects performance of remote un-derwater video stations in assessment of demersal fish community structure. Mar Ecol Prog Ser. 2007; 350: 245–254.
13. Bernard ATF, Götz A. Bait increases the precision in count data from remote underwater video for most subtidal reef fish in the warm-temperate Agulhas bioregion. Mar Ecol Prog Ser. 2012; 471: 235–252.
14. Taylor MD, Baker J, Suthers IM. Tidal currents, sampling effort and baited remote video (BRUV) sur-veys: Are we drawing the right conclusions? Fish Res. 2013; 140: 96–104.
15. Farnsworth KD, Thygesen UH, Ditlevsen S, King NJ. How to estimate scavenger fish abundance using baited camera data. Mar Ecol Prog Ser. 2007; 350: 223–234.
16. Heagney EC, Lynch TP, Babcock RC, Suthers IM. Pelagic fish assemblages assessed using mid-water baited video: standardising fish counts using bait plume size. Mar Ecol Prog Ser. 2007; 350: 255–266.
17. Birt MJ, Harvey ES, Langolis TJ. Within and between day variability in temperate reef fish assem-blages: learned response to baited video. J Exp Mar Biol Ecol. 2012; 416–417: 92–100.
19. Willis TJ, Millar RB, Babcock RC. Protection of exploited fish in temperate regions: high density and bio-mass of snapperPagrus auratus(Sparidae) in northern New Zealand marine reserves. J Appl Ecol. 2003; 40: 214–227.
20. Schobernd ZH, Bacheler N, Conn PB. Examining the utility of alternative video monitoring metrics for in-dexing reef fish abundance. Can J Fish Aquat Sci. 2014; 71(3): 464–471.
21. Gobert B. Impact of the use of trammel nets on a tropical reef resource. Fish Res. 1992; 13: 353–367.
22. McConneya P, Baldeob R. Evaluation and management of coastal fisheries in Latin America and the Caribbean. Fish Res. 2007; 87(1): 77–85.
23. Jury SH, Howell H, O’Grady DFO, Watson WH III. Lobster trap video:in situvideo surveillance of the behaviour ofHomarus americanusin and around traps. Mar Freshw Res. 2001; 52: 1125–1132.
24. Goñi R, Latrouite D. Review of the biology, ecology and fisheries of Palinurus spp. Species of European waters:Palinurus elephas(Fabricius, 1787) andPalinurus mauritanicus(Gruvell, 1911). Cah Biol Mar. 2005; 46: 127–142.
25. McDairmid AB, Stewart RA, Gopal D. Conservation of unique patterns of body markings at ecdysis en-ables identification of individual spiny lobster,Jasus edwardsii. New Zealand J Mar Freshw Res. 2005; 39: 551–555.
26. Frisch AJ, Hobbs J-PA. Photographic identification based on unique, polymorphic colour patterns: a novel method for tracking a marine crustacean. J Exp Mar Biol Ecol. 2007; 351: 294–299.
27. Goñi R, Hilborn R, Díaz D, Mallol S, Adlerstein S. Net contribution of spillover from a marine reserve to fishery catches. Mar Ecol Prog Ser. 2010; 400: 233–243.
28. Díaz D, Mallol S, Parma M, Goñi R. Decadal evolution of lobster reproductive output from a marine pro-tected area. Mar Ecol Prog Ser. 2011; 433:149–157.
29. Myer-Rochow VB, Tiang KM. The eye ofJasus edwardsii(Crustacea, Decapoda, Palinuridae): electro-physiology, histology and behaviour. Zoologica. 1984; 134: 1–58.
30. Wraith JA, Lynch T, Minchinton TE, Broad A, Davis AR. Bait type affects fish assemblages and feeding guilds observed at baited remote underwater video stations. Mar Ecol Prog Ser. 2013; 477: 189–199.
31. Goñi R, Quetglas A, Reñones O. Differential catchability of male and female European spiny lobster Palinurus elephas(Fabricius, 1787) in traps and trammelnets. Fish Res. 2003; 65: 295–307.
32. Babcock RC, Shears NT, Alcala AC, Barrett NS, Edgar GJ, Lafferty KD, et al. Decadal trends in marine reserves reveal differential rates of change in direct and indirect effects. Proc Nat Acad Sci USA. 2010; 107(43): 18256–18261. doi:10.1073/pnas.0908012107PMID:20176941
33. Brooks EJ, Sloman KA, Sims DW, Danylchuk AJ. Validating the use of baited remote underwater video surveys for assessing the diversity, distribution and abundance of sharks in the Bahamas. End Sp Res. 2011; 13: 231–234.
34. Stoner AW, Laurel BJ, Hurst TP. Using a baited camera to assess relative abundance of juvenile Pacific cod: Field and laboratory trials. J Exp Mar Biol Ecol. 2008; 354: 201–211.
35. Cappo M, Speare P, De’ath G. Comparison of baited remote underwater video stations (BRUVS) and prawn (shrimp) trawls for assessment of fish biodiversity in inter-reefal areas of the Great Barrier Reef Marine Park. J Exp Mar Biol Ecol. 2004; 302: 123–152.
36. Connolly RM, Melville AJ, Keesing JK. Abundance, movement and individual identification of leafy sea-dragons,Phycodurus eques(Pisces: Sygnathidae). Mar Freshw Res. 2002; 53(4): 777–780.
37. Wilson SK, Wilson DT, Lamont C, Evans E. Identifying individual great barracudaSphyraena barracuda using natural body marks. J Fish Biol. 2006; 69: 928–932.
38. Van Tienhoven AM, Hartog JED, Reijns RA, Peddemors VM. A computer-aided program for pattern-matching of natural marks on spotted raggedtooth sharkCarcharias taurus. J Appl Ecol. 2007; 44(2): 273–280.
39. Domeier ML, Nasby-Lucas N. Annual re-sightings of photographically identified white sharks (Carchar-odon carcharias) at an eastern Pacific aggregation site (Guadalupe island, Mexico). Mar Biol. 2007; 150: 977–984.
40. Sainte-Marie B, Hargrave BT. Estimation of scavenger abundance and distance of attraction to bait. Mar Biol. 1987; 94: 431–443.