Maternal Risk Factors for Low Birth Weight and
Intrauterine Growth Retardation in a
Guatemalan Population1
NANCEE R. NEEL~ & Josh 0. ALVAREZ~
Hospital data on 306 mother-infant pairs in Cob&, Guatemala, were studied to assess factors responsible for low infant birth weights involving the two general kinds of intrauterine growth retardation (IUGR), these being Type I (symmetric stunting) and Type II (asymmetric stunting or wasting). The results indicate that the Type I IUGR observed arose primarily porn long-term poverty, malnutrition, and chronic poor living conditions, while much of the Type II IUGR seemed attributable to maternal disorders affected by short interbirth intervals.
L
ow birth weight (LBW) neonates have poorer chances for survival, and for healthy growth and develop- ment, than those with normal birth weights (1). Besides being more apt to become sick and die, they also tend to experience greater mental, physical, and neurologic handicaps in later life (2-11).There are two basic types of low birth weight babies: (1) premature babies, born before the thirty-seventh week of gesta- tion; and (2) intrauterine growth-re- tarded (IUGR) babies, born at term with a birth weight below the tenth percentile for their gestational age. Premature babies predominate in the developed world, while IUGR babies are more preva- lent in developing countries (2, 3, 12, 13).
This article has been published in Spanish in the Bolefin de la Oficina Sanifaria Panamericana, Vol. 110, no. 2 (1991), pp. 93-107.
ZAssistant Professor, Department of Public Health Sciences, School of Public Health, University of Alabama at Birmingham, Alabama. Address corre- spondence to: Dr. Nancee R. Neel, University of Alabama at Birmingham, School of Public Health, Division of Maternal and Child Health, Bir- mingham, Alabama 35294, USA.
Trofessor, Department of Public Health Sciences, School of Public Health, University of Alabama at Birmingham, Alabama.
There are also two basic kinds of IUGR babies-known as types I and II (12, 14). Babies with Type I IUGR are small and normally proportioned, with a small head and reduced body length and weight (resulting from chronic fetal mal- nutrition or fetal stunting). Babies with Type II IUGR have heads of normal size and normal body lengths, but their weight-for-length is low (resulting from acute fetal malnutrition or fetal wasting). In developing countries, up to 80% of the IUGR newborns may be of the Type I va- riety (3, 23).
Type I IUGR babies have been found to score lower than both Type II IUGR and normal babies on mental tests at 24 months of age, and also in developmen- tal testing at three years of age (15). They also tend to be lighter and shorter than members of the latter groups, with smaller head circumferences, up to two and a half years of age (15). Other studies have found that either no catch-up growth or very little occurs in Type I IUGR, while children with Type II IUGR tend to show some catch-up growth (6, 12, 16,17).
The study reported here examined fac-
Top left: A view of Co-
b5n from atop the town’s
main church.
Topright:
Children of Cobin.
Bottom right: Dr. Neel
taking newborn mea-
surements for the study.
tors important to IUGR etiology, espe-
cially the etiology of chronic fetal malnu-
trition (Type I IUGR) in a population of
Guatemalan women. This article de-
scribes relationships
between
these
women’s
nutritional,
demographic,
socioeconomic, and obstetric characteris-
tics and their newborns’ birth weights
and IUGR.
MATERIALS AND METHODS
Mother-infant
pairs from Coban, a
Guatemalan town in the Central High-
lands, were enrolled in the study after
the mothers entered the regional hospi-
tal, Helen Losi de Laugerud, for child-
birth. (Approximately 20% of the women
in the area have hospital deliveries--18.)
Participants were limited to those deliv-
ering during the period 18 July-30 No-
vember 1988. Mothers who refused to
participate or whose newborns were pre-
mature (delivered at less than 37 weeks
of gestation), had congenital anomalies,
were twins, or manifested illness were
not included in the study. Also, the
mothers finally enrolled were ones from
whom nurses collected samples of blood,
urine, stool, and placenta during labor
and delivery for later examination. Such
samples were collected from 306 mothers
out of 531 possible study participants who delivered during the study period.
Within 36 hours of her delivery, each mother was interviewed by a trained as- sistant who spoke Kekchf, the local In- dian language, to obtain demographic and socioeconomic information together with her medical, obstetric, and prenatal history. After the interview the mother’s weight, height, head circumference, arm circumference, and triceps skinfold thick- ness were measured. Also, each infant was given an anthropometric evaluation that included measurement of its length, head circumference, arm circumference, triceps skinfold thickness, and chest cir- cumference. Trained personnel measured the infant’s weight at birth with a cali- brated scale.
The Ballard method of gestational age assessment was used to determine gesta- tional age (19). All the determinations were made by one person (NRN) to help maintain consistency and reliability. De- pending on whether each infant’s weight was above or below the tenth percentile of weight for gestational age reported by Williams et al. (20), the infant was classi- fied as “IUGR” or “normal.” Rohrer’s ponderal index was calculated for all newborns to incorporate body length into the assessment of possible intra- uterine malnutrition (21). Each infant classified as IUGR was further classified as either chronically malnourished (Type I IUGR, stunted, symmetric) or acutely malnourished (Type II IUGR, wasted, asymmetric) (22).
Simple and multivariable linear regres- sions were used to analyze the relation- ships between birth weight and variables expressing the mother’s demographic, socioeconomic, obstetric, and nutritional status. Stratified analysis was performed to control for the confounding effects of factors shown to have a relationship with birth weight and IUGR (23). Unadjusted and adjusted odds ratios (OR) controlling for the effect of potential confounding variables were calculated. P values < 0.05 and odds ratio values >l (with a lower 95% confidence interval 21) were con- sidered significant.
RESULTS
As Table 1 shows, the incidence of IUGR (< 10th percentile) found among
the 306 study infants was 34.3%. Type I
IUGR (chronic fetal malnutrition) oc- curred in 26.5% of these newborns (or 77.1% of all the growth-retarded new- borns), and Type II IUGR (acute fetal malnutrition) occurred in 7.8% (or 22.9% of all the growth-retarded newborns).
Sex
The mean birth weight by sex in this sample was 2,984 g for males and 2,932 g for females (Table 2). Fifty-five of the 158 males (34.8%) were IUGR at birth, with 42 exhibiting Type I IUGR. Similarly, 50 of the 148 females (33.7%) were IUGR at birth, with 39 exhibiting Type I IUGR
Table 1. Newborns in the study sample classified as having Type I or Type II intrauterine growth retardation (IUGR), by sex.
Total Male Female
No. % No. % No. %
IUGR 105 (34.3) 55 (34.8) 50 (33.7)
Jype 1 81 (26.5) 42 (26.5) 39 (26.3)
Type If 24 (7.8) 13 K?) 11 (7.41
Table 2. Anthropometric values (mean & 1 standard deviation) for the newborns studied. bv sex.
Male values Female values (N=l58) (N=l48) Mean (+lSD) Mean (+lSD)
Weight(g) 2,984 (It4471 2,932 (k379)
Length (cm) 49.2 (zk2.0) 49.0 (ztl.71
Head circumference (cm) 34.3 UI1.2) 33.9 (f1.0) Chest circumference (cm) 32.9 kk1.6) 32.7 (+1.61 Arm circumference (cm) 10.8 (+o.g) 10.7 (rtO.9) Triceps skinfold (cm) 3.6 UzO.8) 3.6 w3.9)
(see Table 1). No significant differences were found between males and females with regard to birth weight, IUGR, or the type of IUGR involved.
As Table 3 indicates, mothers who identified themselves as Indian had sig- nificantly smaller babies than those who identified themselves as Ladino (2,900 g vs. 3,122 g; p < 0.0001). This difference
remained significant after adjustment for the effects of socioeconomic status and maternal height (p=O.O002). Also, the percentage of IUGR babies delivered was higher among the Indian mothers than the Ladino mothers (37.8% vs. 24.7%, p=O.O33). Eighty percent of the IUGR In- dian babies were chronically malnour- ished (Type I), as compared to 65% of the IUGR Ladino babies (p=O.15). In other words, 30% of the Indian babies in the whole sample were Type I, while about
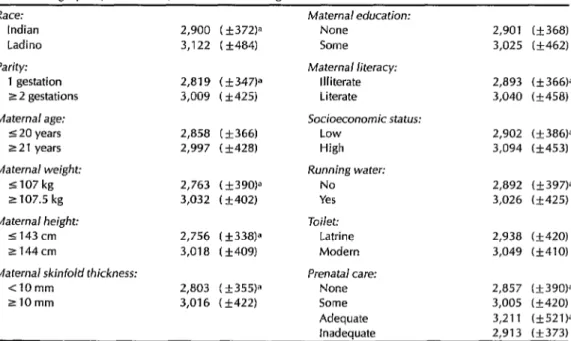
Table 3. Mean birth weights (& 1 standard deviation) of the study infants in each of the sociodemographic, nutritional, and obstetric categories indicated.
Race: Indian Ladino Parity:
1 gestation 2 2 gestations Maternal age:
5 20 years 2 2 1 years Maternal weight:
5107 kg z 107.5 kg Maternal height:
1143cm zl44cm
Maternal skinfold thickness: <lOmm
ZlOmm
Maternal education:
2,900 (k372)a None 2,901 (+368) 3,122 ( f484) Some 3,025 (+462)
Maternal literacy:
2,819 ( +347)” Illiterate 2,893 (f366)a 3,009 (*425) Literate 3,040 (+458)
Socioeconomic status:
2,858 ( +366) Low 2,902 (+386)=
2,997 (+428) High 3,094 t&453) Running water:
2,763 (+39O)a No 2,892 (+397)a
3,032 (+402) Yes 3,026 (+425)
Toilet:
2,756 t&338)= Latrine 2,938 (+420) 3,018 (+409) Modern 3,049 C&410)
Prenatal care:
2,803 (+355)= None 2,857 (+390)” 3,016 ( +422) Some 3,005 (+420)
aStatIstically significant difference (p < 0.05).
Adequate inadequate
3,211 (f521)” 2,913 (k373)
half that proportion (16%) of the Ladino babies were Type I.
Parity
Parity was positively correlated with birth weight (R=0.27). Figure 1A shows that birth weight increased with increas- ing parity up through the fourth preg- nancy. The average weight of babies delivered by mothers in their first preg- nancy was lower than the average weight of babies delivered by mothers in their second or higher pregnancies (2,819 g vs. 3,009 g; p=O.O007; see Table 3). Of the former, 47.6% were IUGR, compared to 29.4% of the latter (p=O.O03). Signifi- cantly higher percentages of both Type I and Type II babies resulted from first pregnancies than from later pregnancies
(39.7% vs. 25.0%
for Type I, p=O.O2;20.0% vs. 7.7%
for Type II, p=O.Ol).3,200 - g 3,150 - A g 3,100 -
.c - ",
3,050 'D 3,000 - - g
2,950 2,900 - E z%
2,850 - 2,800 - 2,750 fi
1 2 3 4 25
Parity Age
3,250 - $ 3,200 - - - .C 3,150 5 3,100 -
g 3,050 - $ 3,000 - 6 2,950 - s 2,900 -
2,850 I I I I 1 l-3 4-6 7-9 10-12
Years of school
Maternal Age
As shown in Figure lB, a direct rela- tionship was found between increasing maternal age and birth weight (R=O.24). Moreover, mothers younger than the 25th percentile of the sample (20 years or younger) had a higher percentage of IUGR babies than older mothers (47.6% vs. 29.3%, p=O.O03) and more Type I IUGR babies (42.7% vs. 23.8%, p =0.002). In contrast, no significant difference was found between the percentages of Type II babies born to mothers less than 21 years old and to older mothers.
Maternal Anthropometrics
After controlling for race, significant relationships were found between birth weight and certain maternal anthropo- metric measurements, these being post-
3,300 - 3,250 - B 33':::
31100 3,050 3,000 2,950 E% 2:800 2,750
iy?f
<20 20-24 25-29 30-34 235
3,200 3,150 3,100 3,050 3,000 2,950 2,900 2.850 2,800
2,750 4 I 1 I
517 18-35 36-47 48-59 gi0 Blrlh Interval In months
Figure 1. The four charts below show the relationships observed between the birth weights of the 306 newborns studied and their mothers’ parity (A), age (B), education (C), and birth interval (D). The points on each chart show the newborns’ mean birth weights, and the vertical lines show 1 stan- dard deviation (+/-) from the mean.
partum weight, height, arm circum- babies whose mothers had larger skin- ference, and triceps skinfold thickness. fold measurements (p =O.OOl).
Maternal postpartum weight, mea- sured 24 to 36 hours after birth, was in- cluded as a nutritional parameter because previous research had found a high cor- relation between maternal prepregnancy and postpartum weights (24). In addi- tion, the mean weight loss at delivery is similar for all women-regardless of in- fant birth weight, maternal prepregnancy height and weight, and gestational weight gain (25). Mothers whose post- partum weight was 107 pounds or less (25th percentile) had higher percentages of small babies, IUGR babies, and Type I and Type II babies than heavier mothers (53.0% vs. 27.4% for IUGR, p<O.OOl;
45.8% vs. 22.9%
for Type I, p<O.OOl;22.0% vs. 7.4%
for Type II, p=O.O03).Interestingly, this statistically signifi- cant relationship applied to Type I babies only (the Type I percentages were 42.5% among those delivered by mothers in the lowest quartile for triceps skinfold thick- ness, versus 23.9% among those deliv- ered by the other mothers, p=O.O03). No statistically significant difference was found for Type II babies. The odds ratios for IUGR in general and for Type I re- mained significant after adjusting for the effect of maternal height (Table 4).
Maternal height is an indicator of chronic nutritional status. Mothers with heights in the lowest quartile (143 cm or less) delivered babies significantly smaller than taller mothers (p <O.OOOl; R=0.31). Likewise, these shorter mothers bore a higher percentage of IUGR babies than did the taller mothers (50.6% vs. 28.6%, p=O.O005); and the shorter mothers had higher percentages of both Type I and Type II babies than did the taller mothers (41.8% vs. 24.7% for Type I, p=O.O07; and 23.6% vs. 6.9% for Type II, p=O.OOl). The resulting odds ratios, adjusted for the effect of race, were significant for IUGR, Type I, and Type II (Table 4).
The relationship between birth weight and maternal arm circumference, another indicator of current nutritional status, was similar to that found between birth weight and triceps skinfold thickness. As maternal arm circumference increased, birth weight also increased. Mothers with arm circumference measurements in the lowest quartile (22 cm) had signifi- cantly smaller babies (p=O.O3) and more IUGR babies (46.2% versus 30.3%, p=O.Ol) than other mothers.
Education
Maternal triceps skinfold thickness, an indicator of current nutritional status, was related to birth weight (R=0.28). Mothers with measurements in the low- est quartile (less than 10 centimeters) had significantly smaller babies than other mothers (p<O.OOOl). In all, 48.8% of those born to mothers with skinfold mea- surements under 10 centimeters were IUGR, as compared to 29.0% of the
Fifty-four percent of the mothers in the sample had never attended school. The mean birth weight of the infants born to these uneducated women was 2,901 g, while the mean birth weight of the in- fants born to mothers with some educa- tion was 3,025 g (p=O.OlO, see Table 3). After correction for socioeconomic status, this difference was not found to be signif- icant (p=O.O59).
Nevertheless, it appears that formal education was an important factor in IUGR. Mothers with no education had a higher percentage of both IUGR and Type I infants than did mothers with some formal education. Of the babies born to uneducated mothers, 41.0% were IUGR, as compared to 27% of the babies
Table 4. Odds ratios for the sociodemographic, nutritional, and obstetric variables shown relating to IUCR, Type I IUGR, and Type II IUCR. Both raw and adjusted odds ratios are shown, the adjusted ratios for particular variables being adjusted as follows: race was adjusted for socioeconomic status (SES); maternal age for parity; parity for maternal age; birth interval for SES; education for race and SES; literacy for race and SES; and maternal height, maternal weight, triceps skinfold thickness, maternal arm circumference, SES, toilet availability, and running water were all adjusted for race. The 95% confidence interval appears in parentheses below each odds ratio.
IUGR odds ratio Raw Adjusted
Type I odds ratio Raw Adjusted
Type II odds ratio Raw Adjusted Race (Indian, Ladino) 1.85 1.60 2.28 1.88 1.06
(1.05-3.27) (0.88-2.91) (1.18-4.39) (0.95-3.73) (0.42-2.69)
1.10 (0.40-3.02)
Maternal age
(520, 221 yrs)
Parity(1, 22)
2.20 (1.32-3.66)
2.18 (1.31-3.64)
2.68 (0.81-8.88)
2.56 (1.52-4.30)
3.00 (1.80-5.00)
2.33 (1.39-3.90)
1.56 2.33 1.84 1.78 (0.88-2.80) (1.34-4.04) (0.99-3.44) (0.72-4.41)
1.72 1.98 1.26 3.00 (0.96-3.08) (1.13-3.46) (0.67-2.38) (1.29-6.96)
0.79 (0.30-2.09)
2.78a (1.12-6.89)
Birth interval
(<18, 218 months) Maternal height
(5143, >143cm) Maternal weight
(5107, >107lb) Triceps skinfold
thickness (< 10, 210 mm) Arm circumference
(zz22,>22cm)
Education (none vs. some)
1.90= 1.98 1.69 3.29 (1.15-3.15) (1.17-3.35) (0.98-2.94) (1.43-7.57)
2.36a 2.19 1.95a 4.15 (1.38-4.05) (1.24-3.89) (1.07-3.54) (1.82-9.49)
2.92= 2.86 2.78a 3.52 (1.74-4.91) (1.64-4.97) (1.58-4.89) (1.52-8.13)
2.27a 2.35 2.23a 2.27 (1.32-3.75) (1.35-4.09) (1.27-3.92) (0.94-5.46)
2.77= (1.17-6.53)
4.41= (1.87-10.39)
3.53" (1.52-8.21)
2.30 (0.94-5.64)
Literacy (yes, no) SES (higher l/3
vs. lower 2/3) Toilet (latrine
vs. modern) Running water
1.98 (1.17-3.33)
1.86 (1.14-3.03)
2.10 (1.29-3.42)
2.32 (1.33-4.06)
2.17 (1.18-3.99)
1.96
1.87a 2.00 1.89= 1.89 (1.10-3.20) (1.14-3.52) (1.06-3.36) (0.77-4.67)
1.66 2.39 2.06= 0.88 (0.96-2.86) (1.38-4.14) (1.12-3.81) (0.38-2.07)
1.88a 2.65 2.26a 1.05 (1.08-3.27) (1.53-4.59) (1.22-4.17) (0.45-2.46)
1.55 2.08 1.78a 0.92 (0.93-2.57) (1.23-3.52) (1.03-3.06) (0.36-2.34)
1.78 2.48 1.94 1.49 (0.91-3.49) (1.24-4.97) (0.90-4.20) (0.53-4.19)
1.81= 2.03 1.82a 1.76
1.91 (0.76-4.79)
0.89 (0.33-2.36)
1.12 (0.39-3.18)
0.90 (0.33-2.46)
1.42 (0.46-4.43)
1.82
(yes, no) (1.22-3.17) (1.10-2.96) (1.20-3.43) (1.06-3.12) (0.75-4.13) (0.74-4.50)
&tatisticallysignificantodds ratio (p < 0.05).
born to mothers with some education; and 83.3% of the former IUGR babies (those born to uneducated mothers) were Type I, as compared to 64.9% of the IUGR babies born to mothers with some education (p=O.O13 and p=O.O33, respectively).
When compared to mothers with no
education, mothers with at least three years of school had larger babies, fewer IUGR babies, and fewer Type I IUGR babies (p=O.OlO; p=O.O05; p=O.O18, re- spectively). As maternal education (years of school) increased, birth weight in- creased (R=0.15, Figure lC), but the dif- ference in birth weight between those
born to mothers with at least three years of school and those born to mothers with more education was not significant.
Socioeconomic Status
The variables used to obtain a socio- economic status (SES) score were years of maternal and paternal education and housing quality indicators: presence or absence of running water, presence or ab- sence of a toilet and type of toilet, pres- ence or absence of a radio, and presence or absence of a refrigerator. The scores attained with respect to these variables were added, and linear regression analy- sis was used to compare birth outcomes for the mothers scoring in the two lower terciles with mothers scoring in the up- per tercile.
As Table 3 indicates, neonates in the lower SES group had a lower average birth weight than those in the higher group (2,902 g vs. 3,094 g, p=O.O05). Af- ter adjustment for race, this difference re- mained significant (p =0.034). Also, a higher percentage of IUGR babies was born to mothers in the lower SES group. Growth retardation occurred in 39.5% of these babies, as compared to only 22.0% of those with mothers in the higher SES group (p=O.O03). Also, 38.6% of the IUGR babies in the lower group were Type I, as compared to only 23.2% of those in the higher group (p=O.OO@. Similar results were seen when only housing quality variables were used to compute the SES score.
In addition, a positive association was found between the presence of running water and birth weight (R=0.13). Babies born to mothers who reported having running water in the home had a mean birth weight of 3,026 g, as compared to a mean birth weight of 2,892 g for the rest (p =0.004). A higher percentage of IUGR babies and a higher percentage of Type I IUGR babies were born to mothers who
had no running water in the home than were born to those who did (41.8% vs. 26.8%, p=O.O06, OR=l.lO for IUGR; 36.0% vs. 21.7%, p=O.OOS, OR=1.82 for Type I).
Prenatal Care
Prenatal care was defined as care pro- vided during pregnancy by the formal health care system. Variables examined with regard to birth outcome were whether or not a woman received prena- tal care, whether the care provided was public or private, and whether or not it was adequate.
A direct relationship was found be- tween the number of prenatal visits and birth weight (R=0.21). Women who had at least one prenatal care visit delivered babies with larger average birth weights than women who received no prenatal care (3,005 g vs. 2,857 g, p=O.O04; see Table 3). Similarly, the average birth weight of babies whose mothers had one to three prenatal visits was lower than the average birth weight of those whose mothers had four to six visits, and the latter was lower than the average birth weight of those whose mothers had seven to nine visits (2,924 g vs. 3,037 g vs. 3,201 g; p=O.43).
Also, women with first prenatal visits in the first trimester delivered babies with larger average birth weights than those whose first visits came in the sec- ond or third trimester (3,029 g for the first trimester group vs. 3,002 g for the second trimester group vs. 2,909 g for the third trimester group; p = 0.43). Although these differences were not found to be statistically significant, there was a trend toward higher birth weights among those having an earlier first prenatal visit,
The difference between the mean birth weight of infants whose mothers re- ceived prenatal care from the public health care system (either a health center
or the regional hospital clinic) and the mean birth weight of those whose mothers received care from a private physician (2,965 g and 3,078 g, respec- tively) was not found to be significant (p=O.O6). Also, race and the site of pre- natal care were found to be associated (R=0.43); and after controlling for the ef- fect of race, the above difference became even smaller (p=O.66).
Women with “adequate” prenatal care (this being defined as a first prenatal visit during the first trimester and seven to nine visits in all-26) delivered infants with a higher mean birth weight than did women with “inadequate” prenatal care (defined as no prenatal visits until the third trimester or less than five visits in all-26), the average birth weights being 3,211 g vs. 2,913 g (p=O.O003). Unedu- cated women who received adequate prenatal care tended to deliver heavier babies than uneducated women who did not receive such care, the average birth weights being 3,170 g vs. 2,886 g (p=O.Ol). Because only 11 uneducated women received adequate prenatal care, an attempt was made to determine what other characteristics of these women were important in their delivering larger babies. There were, however, no obvious factors that could readily account for this difference.
Birth Interval
Overall, 10% of the babies in this study were born less than 18 months after the mother’s previous delivery. This group had an average birth weight almost 300 g lower than that of babies born between 18 and 23 months after the last birth (2,913 g vs. 3,211 g, p=O.O22). Also, higher percentages of IUGR, Type I, and Type II babies were born after a birth in- terval of less than 18 months (42.9% vs. 21.9% for IUGR, 36.8% vs. 19.4% for
Type I, and 14.3% vs. 3.9% for Type II). Because of the relatively small numbers involved, these differences were not sta- tistically significant. After adjustment for maternal postpartum weight, odds ratios were significant only for birth interval and IUGR and for birth interval and Type II (see Table 4).
As Figure 1D indicates, mean birth weight increased as the birth interval in- creased up to an interval of 48 months. However, after 48 months further in- creases in the birth interval were accom- panied by a decline in the average birth weight.
DISCUSSION
Birth Weight
Variables found to have a significant re- lationship with birth weight, after con- trolling for confounding effects, can be grouped into three categories: nutri- tional, sociodemographic, and pregnan- cy-related.
Maternal height (an indicator of chronic nutritional status) and maternal triceps skinfold thickness and maternal weight (indicators of current nutritional status) were all associated with birth weight. This suggests an association be- tween the mothers’ childhood nutritional status and infant birth weight, as well as an association between the mothers’ cur- rent nutritional status and infant birth weight. Other studies (23, 27, 28) have found similar relationships between these maternal variables and birth weight. A relationship between maternal head circumference (another indicator of chronic nutritional status) and birth weight has been reported by others (27, 29) but was not found in this study.
Sociodemographic variables found re- lated to birth weight in this study were
race, maternal education, and socio- economic status. Indian women tended to deliver babies with lower birth weights than did Ladino women. Ethnic differ- ences in birth weight have been found by others (23, 28). Kramer, in trying to ex- plain the lower birth weights seen in some racial/ethnic groups (23), postulates that Indian racial characteristics lead to development of shorter, smaller women, which in turn leads to LBW. However, the poor nutritional status common among Indians makes it hard to separate the effects of Indian racial characteristics from the effects of malnutrition during childhood.
Regarding maternal education, illit- erate mothers, mothers with no formal education, and mothers in the lower so- cioeconomic status group (as defined above) all tended to have babies with lower birth weights than mothers in the remainder of the study sample. Most studies of factors associated with birth weight combine maternal education with socioeconomic status (SES). Some of these studies have found an association between SES and birth weight, while others have found no association (23, 27). The results of the present study suggest an association between maternal educa- tion and birth weight that is separate from SES .
The pregnancy-related variables that we examined (parity, birth interval, and prenatal care) were all found to be associ- ated with birth weight. Mothers deliver- ing as a result of their first pregnancy, regardless of their age, tended to deliver babies with lower birth weights. This is consistent with other studies (23, 28), which have found a relationship between parity and birth weight after adjusting for the effect of maternal age.
Women delivering less than 18 months after their last previous delivery also ten- ded to have babies with lower birth weights. Mean birth weight increased
with the birth interval until that interval reached four years, after which birth weight began to fall. DaVanzo et al. (28) found this same relationship between in- creasing birth weight and increasing birth interval up to an interval of four years in Malaysia. Other studies have shown relatively lower birth weights with short birth intervals, and have also shown relatively lower birth weights with intervals longer than four years (30-32). It is likely that the usual etiology of LBW following a short birth interval differs from the etiology of LBW fol- lowing a long birth interval. Babies may have LBW after short birth intervals be- cause of the mother’s inability to re- plenish her nutritional reserves between pregnancies, while the cause of LBW fol- lowing longer birth intervals may be re- lated to maternal disease (28, 33).
Women who received inadequate pre- natal care also tended to deliver babies with lower birth weights. This finding agrees with other studies that have found an association between prenatal care and birth weight (23, 34, 35). Two interesting findings from our study that relate to pre- natal care deserve mention. First, the mean birth weight of babies born to women receiving prenatal care from the public health care system did not differ significantly from that of babies born to women receiving prenatal care from pri- vate physicians. This implies that the public health care system is effective in preventing low birth weight among the babies of women who utilize its services. Second, when women with no education received adequate prenatal care they de- livered significantly heavier babies than uneducated women receiving inadequate prenatal care. Before concluding that pro- viding adequate prenatal care to unedu- cated women prevents LBW babies, it must be acknowledged that factors re- lated to care-seeking behavior in general, and prenatal care-seeking behavior in
particular, were not measured in this in- vestigation and could have influenced the results. The fact remains, however, that provision of adequate prenatal care to these women was associated with higher birth weights.
Women in the study population did not smoke, and either did not drink alco- hol or did not admit to it. Therefore, the effects of smoking and alcohol consump- tion on LBW could not be studied.
General Intrauterine Growth
Retardation
The maternal anthropometric variables showing significant adjusted odds ratios for IUGR after correction for potential confounders were postpartum weight, height, triceps skinfold thickness, and arm circumference (Table 4). These vari- ables include indicators of both chronic and current maternal nutritional status, and our findings are very similar to those obtained from a different population of women in Guatemala (29).
The birth interval and the socio- demographic variables of literacy and the presence of running water in the home were also associated with significant ad- justed odds ratios for IUGR. Lechtig et al. (27) have suggested that certain maternal characteristics may help explain the rela- tionship between sociodemographic vari- ables and IUGR. A possible interpreta- tion in our case is that literacy and running water reflect better economic conditions, conditions that lead to lower levels of maternal malnutrition and dis- ease, and to less IUGR in general.
Type I IUGR
Significant adjusted odds ratios for Type I IUGR were only found for nutri- tional and socioeconomic variables. Ma- ternal postpartum weight, height, skin- fold thickness, and arm circumference
(all indicators of nutritional status) were all associated with Type I IUGR.
Before controlling for the effect of ma- ternal postpartum weight, the odds ratio for length of time between births was sig- nificant for Type I IUGR. After adjust- ment, however, the birth interval was not significant. Ferraz et al., who found simi- lar results in Brazil (24), have suggested that the effect of birth interval on IUGR is mediated through maternal weight. For example, if a short birth interval prevents the mother from restoring her nutritional reserves before her next pregnancy, her poorer nutritional status may lead to IUGR, especially Type I IUGR.
Illiteracy, lack of education, and low socioeconomic status were all found to be significantly associated with Type I IUGR. All of these factors reflect the chronic effects of poverty, relatively poor living conditions, and lack of oppor- tunity. Taken together, the relationship of these factors to chronic malnutrition, in the absence of factors that reflect other maternal characteristics, suggests that the etiology of Type I IUGR is directly related to long-term poverty, malnutri- tion, and chronic poor living conditions.
Type II IUGR
Odds ratios for Type II IUGR were sig- nificant for two pregnancy-related vari- ables, parity and birth interval.
IUGR may result from medical disorders of pregnancy, and also with findings as- sociating Type II IUGR with pregnancy- induced hypertension (37).
The odds ratio for birth interval was significant for women heavier than the 25th percentile of the sample (107 pounds) and for birth intervals of under 18 months. This association between heavier women with short birth intervals and Type II IUGR suggests that mothers with short birth intervals who delivered Type II babies had been able to restore their nutritional reserves between the preceding and present pregnancies. The relationship implied, then, is between maternal disorders affected by short in- terbirth intervals and Type II IUGR, rather than between poor nutritional sta- tus and Type II IUGR.
Maternal postpartum weight and ma- ternal height had significant odds ratios for Type II IUGR among Indian women but not among Ladino women. This find- ing cannot be fully explained, but it is possible that the high incidence of mal- nutrition among Indian women con- founded these results.
CONCLUSIONS
AND
RECOMMENDATIONS
The data from this investigation should be utilized in planning public health in- terventions. In the short term, adequate prenatal care should be provided to more women, with special attention to first- time mothers. In this regard, two impor- tant points need to be made. First, when uneducated women received adequate prenatal care, they delivered significantly heavier babies than uneducated women who did not receive adequate care. Sec- ond, the mean birth weight of babies born after prenatal care by private physi- cians was 113 g higher than that of babies born after care by public health pro- viders. However, this difference com-
pletely disappeared when the effect of race was controlled. Therefore, providing adequate prenatal care from either source to more women should result in the birth of heavier babies; this makes it essential that health care providers, women, and their families be taught about the impor- tance of prenatal care.
Babies born soon after the mother’s last previous delivery weighed signifi- cantly less than babies born after longer birth intervals, and a higher percentage of these short-interval babies had IUGR. Moreover, a trend of increasing birth weight with increasing birth interval was observed up to the point where the birth interval reached four years. These data clearly show that ways of increasing short birth intervals need to be explored. In particular, measures that provide edu- cation about contraception and increase its accessibility and acceptability should positively affect birth weight and help re- duce growth retardation.
Long-term measures also need to be implemented. Prevention of infant and childhood malnutrition now will lead to taller mothers and heavier babies in the next generation. Improving the educa- tional status of female children by specifi- cally requiring at least three years of school will have a similar effect.
As seems always to be the case, our data indicate that a general improvement of socioeconomic status would positively influence birth weight and reduce IUGR. (Babies born into the lower socio- economic group had a lower average birth weight and a higher proportion of IUGR individuals than the babies born into the higher group.) Interestingly, our data indicate that the provision of run- ning water to more households would have a positive effect on both birth weight and reduction of IUGR.
The very high incidence of Type I IUGR observed in this study, together with the well-known chronic effects of
this type of growth retardation, strongly reinforce an obvious conclusion-that the etiology of Type I IUGR must be further studied. Among other things, the results reported here indicate Type I IUGR is as- sociated with chronic malnutrition and poor socioeconomic conditions that can- not be easily remedied. Superficially, it
appears that an environment of chronic
malnutrition and poor socioeconomic conditions would predispose mothers to chronic or frequent infections which, in turn, could lead to stunting of the rapidly growing fetus in a manner akin to the way infections have been shown to cause
chronic malnutrition in infants (40, 41,
42). Therefore, in view of the well-estab-
lished relationship between malnutri-
tion, poor socioeconomic conditions, and
infection (38, 39, 40), the role of chronic or frequent maternal infections in Type I IUGR needs to be explored.
Acknowledgments. The authors wish to thank the following people for their assistance with this study: Dr. Kirk Avent, Dr. Mario Barrios, Dr. Roderico Monzon, Dr. Laura Perkins, Dr. Rafael
Vidaurre, and the nurses in Labor and Delivery at the Coban Regional Hospital.
REFERENCES
1. WHO, Division of Family Health. The in- cidence of low birth weight: a critical re-
view of available information. World
Health Stat Q. 1980;33:197-224.
2. Villar J, Belizdn JM. The relative contribu- tion of prematurity and fetal growth retar- dation to low birth weight in developing
and developed societies. Am J Obstet
Gynecol. 1982;143:793-98.
3. Villar J, Altobelli L, Kestler E, Belizan J. A health priority for developing countries: the prevention of chronic fetal malnutri- tion. Bull WHO. 1986;64(6):847-51. 4. Hearst N. Infant mortality in Guatemala:
an epidemiological perspective. Int J Epi- demiol. 1985;14(4):575-81.
5.
6.
7.
8.
9.
10.
11.
12.
13.
14.
15.
16.
17.
Mata LJ, Urrutia JJ, Kronmal RA, Joplin C. Survival and physical growth in infancy and early childhood. Am J Dis Child. 1975;129:561-65.
Fancourt R, Campbell S, Harvey D, Nor- man A. Follow-up study of small-for- dates babies. Br Med J. 1976;1:1435-37.
Walther FJ, Ramaekers LHJ, Van En-
gelshoven JMA. Skeletal maturity at birth and at the age of 3 Years of infants mal- nourished & uteri. Early Hum Dev. 1981;5:139-43.
Starfield B, Shapiro S, McCormick M,
Bross D. Mortality and morbidity in in- fants with intrauterine growth retarda- tion. J Pediatr. 1982;101(6):978-83.
Low JA, Galbraith RS, Muir D, Killen H, Karchmar J, Campbell D. Intrauterine growth retardation: a preliminary report of long-term morbidity. Am J Obstet Gyne- col. 1978;130(5):534-45.
Fledelius HC. Inhibited growth and de- velopment as permanent features of low birth weight. Acta Paediatr Stand. 1982; 71:645-50.
Walther FJ, Ramaekers LHJ. Growth in
early childhood of newborns affected
with disproportionate intrauterine
growth retardation. Acta Paediatr Stand. 1982;71:651-56.
Villar J, Belizdn JM. The timing factor in the pathophysiology of the intrauterine
growth retardation syndrome. Obstet
Gynecol Rev. 1982;37(8):499-506.
Belizan JM, Lechtig A, Villar J. Distribu- tion of low birth weight babies in devel- oping countries. Am J Obstet Gynecol. 1978;132(6):704.
Rosso P, Winick M. Intrauterine growth retardation: a new systematic approach based on the clinical and biochemical characteristics of this condition. J Perinat Med. 1974;2:147-60.
Villar J, Smeriglio V Martorell R, Brown CH, Klein RE. Heterogenous growth and
mental development of intrauterine
growth-retarded infants during the first 3 years of life. Pediatrics. 1984;74(5):783-91. Beck GJ, van den Berg BJ. The relation- ship of the rate of intrauterine growth of low-birth-weight infants to later growth. J Pediatr. 1975;86(4):504-11.
Davies DE, Platts P, Pritchard JM, Wilkin- son PW. Nutritional status of light-for- date infants at birth and its influence on
18.
19.
20.
21.
22.
23.
24.
25.
26.
27.
28.
early postnatal growth. Arch Dis Child. 1979;54:703-06.
Guatemala, Ministry of Health, Depart- ment of Aha Verapaz. Area healfh plan. Cob&n, Alta Verapaz, Guatemala; 1988. Ballard JL, Novak KK, Driver M. A sim- plified score for assessment of fetal matu- ration of newly born infants. J Pediafr. 1979;95(5):769-74.
Williams RL, Creasy RK, Cunningham
CC, Hawes WE, Norris FD, Tashiro M. Fetal growth and perinatal viability in Cal- ifornia. Obsfef Gynecol. 1982;59:624-32. Walther FJ, Ramaekers LHJ. The Ponderal Index as a measure of the nutritional sta- tus at birth and its relation to some as- pects of neonatal morbidity. J Perinaf Med. 1982;10:4247.
Lubchenco LO, Hansman C, Boyd E. In- trauterine growth in length and head cir- cumference as estimated from live births at gestational ages from 26 to 42 weeks. Pediufrics. 1966;37(3):403-08.
Kramer MS. Determinants of low birth
weight: methodological assessment and
meta-analysis. Bull WHO. 1987; 65(5):
663-737.
Ferraz EM, Gray RH, Fleming PL, Maia
TM. Interpregnancy interval and low
birth weight: findings from a case-control
study. Am J Epidemiol. 1988;128(5):
1111-16.
Luke B, Petrie RH. Intrauterine growth: correlation of infant birth weight and ma- ternal postpartum weight. Am J Clin Nufr. 1980;33:2311-17.
Kessner DM, Singer J, Kalk CE, Schle- singer ER. Infant death: an analysis by maternal risk and health care. In: Volume I: confrasfs in heuIfh status. Washington, DC: National Academy of Sciences; 1973. Lechtig A, Delgado H, Lasky R, et al. Ma- ternal nutrition and fetal growth in devel- oping societies. Am J fiis Child. 1975; 129:434-37.
DaVanzo J, Habicht JP, Butz Wl? As-
sessing socioeconomic correlates of birth weight in peninsular Malaysia: ethnic dif- ferences and changes over time. Sot Sci Med. 1984;18(5):387-404.
29. Villar J, Khoury MJ, Finucane FF, Delgado HL. Differences in the epidemiology of
30.
31.
32.
33.
34.
35.
36.
37.
38.
39.
40.
41.
42.
prematurity and intrauterine growth re- tardation. Early Hum Dev. 1984;14:307-20. Erickson JD, Bjerkedal T. Interpregnancy interval: association with birth weight, stillbirth, and neonatal death. J Epidemiol Community Health. 1978;32:124-30. Fortney JA, Higgins JE. The effect of birth interval on perinatal survival and birth weight. Public Health. 1984;98:73-83. Fedrick J, Adelstein I? Influence of preg- nancy spacing on outcome of pregnancy. Br Med J. 1973;4:753-56.
Eastman NJ. The effect of the interval be- tween births on maternal and fetal out- look. Am J Obsfef Gynecol. 1944; 47(4): 445-63.
Donaldson PJ, Billy JOG. The impact of prenatal care on birth weight: evidence from an international data set. Med Cure. 1984;22(2):177-88.
Elster AB. The effect of maternal age, par- ity, and prenatal care on perinatal out- come in adolescent mothers. Am J Obsfet Gynecol. 1984;149(8):845-47.
Brar HS, Rutherford SE. Classification of
intrauterine growth retardation. Semin
Perinafol. 1988;12(1):2-10.
Miller HC, Hassanein K. Fetal malnutri- tion in white newborn infants: maternal factors. Pediafrics. 1973;52:504-12.
Scrimshaw NS, Taylor CE, Gordon JE. In- feracfions of nufrifion and infection. Geneva:
World Health Organization; 1968. (WHO monograph series, no. 57).
Chandra RK. Malnutrition and infection. In: Scrimshaw NS, Wallerstein MB, eds. Nutrition policy implemenfafion: issues and
experience. New York: Plenum; 1982:
41-51.
Mata L. The children of Santa Maria Cauque’: a prospective field sfudy of health and growth. Cambridge: MIT; 1978.
Martorell R, Habicht JR Yarbrough C,
Lechtig A, Klein RE, Western KA. Acute morbidity and physical growth in rural
Guatemalan children. Am J Dis Child.
1975;129:1296-301.
Mata L, Urrutia JJ, Albertazzi C, Pellecer 0, Arellano E. Influence of recurrent in- fections on nutrition and growth of chil-
dren in Guatemala. Am J Clin Nufr.
1972;25:1267-75.