Socioeconomic status, birth weight, maternal
smoking during pregnancy and adiposity in
early adult life: an analysis using structural
equation modeling
Situação sócio-econômica, peso ao nascer,
tabagismo na gravidez e adiposidade na vida
adulta jovem: uma análise utilizando-se
modelagem com equações estruturais
1 Departamento de Saúde Pública, Universidade Federal do Maranhão, São Luís, Brasil.
2 Escola Nacional de Saúde Pública Sergio Arouca, Fundação Oswaldo Cruz, Rio de Janeiro, Brasil. 3 Faculdade de Medicina de Ribeirão Preto, Universidade de São Paulo, Ribeirão Preto, Brasil.
Correspondence A. A. M. Silva
Departamento de Saúde Pública, Universidade Federal do Maranhão. Rua Barão de Itapary 155, São Luís, MA
65020-070, Brasil. [email protected]
Antônio Augusto Moura da Silva 1 Ana Glória Godoi Vasconcelos 2 Heloisa Bettiol 3
Marco Antonio Barbieri 3
Abstract
We describe here an example of structural equa-tion modeling in epidemiology. The associaequa-tion between birth weight and adiposity in early adult life, adjusted for the number of cigarettes smoked during pregnancy and socioeconomic status at birth, was evaluated. Data involving 2,063 adults from the 1978/1979 Ribeirão Preto cohort study were used. Adiposity was measured by body mass index (BMI), waist circumference (WC) and the sum of triceps and subscapular skinfolds (STSS). Models were submitted to maximum likelihood estimation, separately for men and women. Birth weight had a small and significant effect on adiposity in men (standardized coefficient, SC = 0.08) and women (SC = 0.09). Smoking during pregnancy did not influence adiposity in men (SC = 0.004), but its effect was marginally significant in women (SC = 0.07; P = 0.056). Socioeconomic status at birth had a small and positive effect on adiposity in men (SC = 0.08) and a moderate and negative effect in women (SC = -0.16). In this young adult population, BMI, WC and STSS used alone or in combination were valid estimators of body adiposity.
Birth Weight; Smoking; Adisposity; Mathemati-cal Models; Methods
Introduction
Birth weight has been associated with the risk of obesity in adolescence and adult life. Most studies conducted in developed countries have reported a positive association between birth weight and body mass index (BMI) in adult life 1,2,3,4. An asso-ciation between maternal smoking during preg-nancy and increased BMI in adolescence and adult life has also been described in some studies 5,6, but reports are contradictory 7. Associations between birth weight, maternal smoking during pregnancy and BMI have been investigated very little in developing countries 8,9,10.
Although BMI has been used for the evalu-ation of obesity and its risk factors because it is a simple technique of easy applicability, there is still some disagreement as to whether BMI is a good indicator of adiposity. Since BMI reflects total body mass (fat, lean and bone mass), it is possible that some individuals with BMI in the normal range have excess body fat 11. Other stud-ies have suggested the combined use of BMI and other variables that measure body fat, such as waist circumference and skinfold thicknesses, for the evaluation of the risks associated with cardio-vascular diseases in order to reduce the limita-tions of BMI 12,13,14.
Among these new methods, structural equation modeling has been recently introduced for the evaluation of causal associations in epidemiol-ogy 15,16,17. This method consists of the simulta-neous estimation of a series of multiple linear regression equations and has some advantages over linear regression. First, a theoretical model of hypothetical relationships between variables is submitted to a test in which distal, intermediate and proximal variables are arranged hierarchi-cally in a causal chain 18. Only if this theoretical model fits the data will the association studied be analyzed.
Structural equation modeling allows for measurement error, for model correlations be-tween explanatory variables and for estimating indirect effects (effects of an explanatory vari-able on the outcome mediated by one or more intervening variables). If a variable is measured in an imperfect manner, instead of working with a single indicator variable it is possible to work simultaneously with more than one measure of the same construct, with the creation of a latent variable. A latent variable is a non-observable variable which is deduced from covariances be-tween two or more indicator variables. Latent variables are free of measurement error (con-sisting of a random error plus singularity, which is the portion of variance present in the vari-able that measures something different from the dimension of interest) 19. Thus, only the com-mon variance (variance related to the dimen-sion of interest) shared by different indicators of a latent variable remains, a fact permitting the estimation of effects free of bias caused by measurement error. In contrast to multiple re-gression, adjustment for confounding factors is more complete because indirect effects are taken into account and it is also possible to control for common causes 20. The use of latent variables also allows the researcher to deal with the problem of colinearity between explanatory variables 20. The disadvantages of some estima-tion methods in structural equaestima-tion modeling are the assumptions of multivariate normality and of the fact that the variables are continuous and the relationships are linear 18,19.
The objective of the present study was to de-scribe an example of the use of structural equa-tion modeling in epidemiology and compare the results with the conventional linear regression model. This approach was used to determine the association between birth weight and adiposity in early adult life, adjusted for maternal smoking during pregnancy and socioeconomic status at birth. Adiposity, measured by BMI or waist cir-cumference or the sum of triceps and subscapu-lar skinfolds (STSS) as continuous indicators, was
analyzed in separate models, and was also mod-eled as a latent variable in order to determine whether the inclusion of measures of adiposity other than BMI adds information for a more valid estimation of body adiposity.
Subjects and methods
Study design
Between June 1, 1978 and May 31, 1979, a total of 9,067 live births from eight maternity hospi-tals in Ribeirão Preto, São Paulo State, Brazil, cor-responding to 98% of all births in the city, were examined and their mothers were interviewed. Immediately after birth and after verbal consent was obtained, the mothers responded to a stan-dardized questionnaire from which the following variables were extracted: number of cigarettes smoked during pregnancy, father’s occupation, family income (as a multiple of the minimum wage), and maternal schooling. The newborns were weighed immediately after birth using stan-dardized techniques 21.
Among the births recorded, 2.5% were dis-charged before the interview and less than 1% of mothers refused to participate in the study, with 6,484 subjects being eligible for follow-up after exclusion of non-residents (n = 2,094), multiple births (n = 146) and deaths up to 20 years of age (n = 343).
A total of 5,665 participants (87.4% of the eligible subjects) were located for the fourth follow-up of this study when they were 23 to 25 years old. The city was divided into four geo-eco-nomic regions according to the income of the head of the household based on census data: poor, middle poor, middle rich and rich. Con-tact was established by telephone or letter with one-third of the eligible subjects of each geo-eco-nomic region. In the case of refusal (209 cases), no contact because the subject was in prison (34 cases) or failure to attend the scheduled inter-view (431 cases), the next subject on the list was contacted. Thus, 705 subjects were replaced and 2,063 adults participated in the fourth phase of the study, corresponding to 31.8% of the original sample. Lower follow-up rates were observed for men (p = 0.004), subjects whose parents had a less qualified occupation (p < 0.001) and moth-ers of low educational level (p < 0.001). There were no differences in follow-up rate according to birth weight (p = 0.618). Details of the methods have been published elsewhere 21,22.
triceps and subscapular skinfold thickness were measured using standardized techniques 23.
Theoretical model
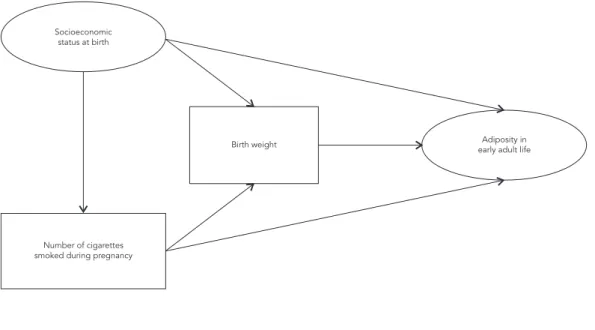
Figure 1 shows the theoretical model tested. The response variable is a construct, a latent variable not directly observed, i.e., adiposity in early adult life, represented by an ellipse. This variable is composed of three directly observed continuous variables: BMI, waist circumference and STSS. The explanatory variables are socioeconomic status, birth weight and number of cigarettes smoked during pregnancy. The variable ‘socio-economic status’ is also a construct and is com-posed of three ordinal (directly observed) indica-tor variables: father’s occupation at the time of birth, per capita family income at the time of birth and maternal schooling at the time of birth. The variables birth weight and number of cigarettes smoked during pregnancy are directly observed continuous variables represented by rectangles. In the model, direct and indirect effects are es-timated. According to this hypothesis, socioeco-nomic status, birth weight and number of ciga-rettes smoked during pregnancy exert a direct ef-fect on adiposity. Socioeconomic status directly influences the number of cigarettes smoked dur-ing pregnancy and birth weight. The number of cigarettes smoked during pregnancy has a direct effect on birth weight. In addition, indirect effects
are estimated: socioeconomic status interferes with adiposity measured by birth weight and by the number of cigarettes smoked during preg-nancy. The number of cigarettes smoked during pregnancy exerts an indirect effect on adiposity mediated by birth weight.
Variables
The structural equation model includes both directly observed variables and not directly ob-served variables, known as latent variables or constructs.
• Socioeconomic status at the time of birth
Socioeconomic status at birth was treated as a latent variable measured using the following in-dicators: father’s occupation, family income and maternal schooling at the time of birth.
• Indicators of socioeconomic status at
the time of birth
Father’s occupation at the time of birth was clas-sified as follows: 1 = manual unskilled work or unemployed; 2 = manual skilled and semi-skilled work; and 3 = non-manual work.
Family income at the time of birth, reported as a multiple of the national minimum wage, was divided into ten categories: 1: ≤ 1; 2: 1.01 to 2;
Figure 1
Theoretical model tested using structural equations.
Socioeconomic status at birth
Birth weight
Number of cigarettes smoked during pregnancy
3: 2.01 to 30; 4: 3.01 to 4; 5: 4.01 to 5; 6: 5.01 to 6; 7: 6.01 to 7; 8: 7.01 to 8; 9: 8.01 to 9, and 10: ≥ 9.
Maternal schooling at the time of birth was classified as follows: 0 = illiterate; 1 = acquiring literacy by other means or incomplete primary school; 2 = complete primary school; 3 = incom-plete secondary school; 4 = comincom-plete secondary school; 5 = incomplete high school; 6 = complete high school; 7 = incomplete higher education, and 8 = complete higher education.
• Adiposity of young adults
Adiposity was measured by BMI, waist circum-ference and STSS and was also treated as a la-tent variable in another model measured by the following continuous indicators: BMI, waist cir-cumference and STSS.
• Directly observed variables
Birth weight (in grams) and the number of ciga-rettes smoked during pregnancy were treated as continuous numerical variables.
• Missing values
Family income was the variable with the largest number of missing answers (n = 371). The other variables presented a small number of miss-ing data: father’s occupation (n = 60), cigarettes smoked during pregnancy (n = 52), and maternal schooling (n = 40). No data were missing for birth weight.
• Statistical analysis
Multiple linear regression and structural equa-tion modeling were used for the data analysis. In the multiple regression model BMI was regressed on maternal schooling, birth weight and the number of cigarettes smoked during pregnancy.
The structural equation model consists of two sub-models: the measurement model which establishes how the constructs are measured and the structural model which analyzes the structur-al relationships, corresponding to associations between variables. Latent variables are repre-sented by circles or ellipses and observed vari-ables are represented by squares or rectangles. The elaboration of a latent variable is made in the measurement model, in which the indicators of the latent variable are specified. A good latent variable presents convergent validity, showing that its indicators measure the same construct, as measured by the loads of the indicators (fac-tor loadings) that should be high (higher than
0.60). In addition, there should be discriminant validity, i.e., the correlations between indicators should not be excessively high (> 0.85), since each indicator should measure a distinct aspect of the construct 18. The models proposed were estimated using the AMOS 16.0 program (SPSS Inc., Chicago, United States). Instead of exclud-ing cases without information, full information maximum likelihood (FIML) estimation was used since studies have shown this method to be the best alternative to deal with missing data 24. Separate models were fitted for men and women. Since ordinal indicators of socioeconomic status were treated as continuous variables, bootstrap-ping was used to determine the consistency of the results.
The standardized coefficients (SC) were in-terpreted according to Kline 18, where an SC of about 0.10 indicates a small effect, an SC of about 0.30 indicates a medium effect, and SC > 0.50 in-dicates a strong effect.
• Measures of model fit
The following measures were analyzed to test the fit of the model: χ² (likelihood ratio chi-square statistic): a statistically significant value indicates discrepancy between the observed and estimated matrices, with consequent rejection of the theoretical model under analysis; χ²/d.f. normed chi-square: there is no exact critical val-ue to decide the adequacy or not of the model based on this index, with indices of 5.00 or low-er being accepted in practice and values lowlow-er than 1 indicating overfitted models; root mean square error of approximation (RMSEA) which is directly based on residues: a value close to zero indicates that the theoretical model fits the data, while values less than 0.08 indicate a satisfac-tory fit; normed fit index (NFI) and Tucker-Lewis index (TLI): values higher than 0.90 indicate a good fit; Akaike information criterion (AIC) used for the comparison of models: lower values in-dicate a better fit; R2 (coefficient of determina-tion): indicates how much of the variability in the response variable is explained by explana-tory variables 18,25,26.
Ethical aspects
Results
Measurement model
The coefficients of the measurement models were high and statistically significant. The factor loadings of the indicators of the latent construct “socioeconomic status at the time of birth” were higher than 0.60 and were statistically significant (Table 1) for both men and women.The indicator with the highest load for this construct was fam-ily income, with the socioeconomic status con-struct explaining 66% of the variability in family income among women and 68% among men. This indicates that the latent variable adequately predicted the variability of the observed variable (Figure 2). Cronbach’s alpha coefficient was close to 0.70 (0.69 for women and 0.68 for men).
With regard to the adiposity construct, el-evated (generally higher than 0.80) and statisti-cally significant factor loadings (Table 1) were observed for all indicators, as shown in Figure 2. Particularly for BMI the factor loading was 0.98 in women, indicating that 97% of the variability in BMI was explained by the adiposity construct. A similar result was obtained for men (factor load-ing of 0.96). Cronbach’s alpha coefficient for the latent adiposity variable was 0.87 for men and
0.88 for women. One potential drawback of this construct is its low discriminant validity, with all factor loadings being higher than 0.85.
Structural model
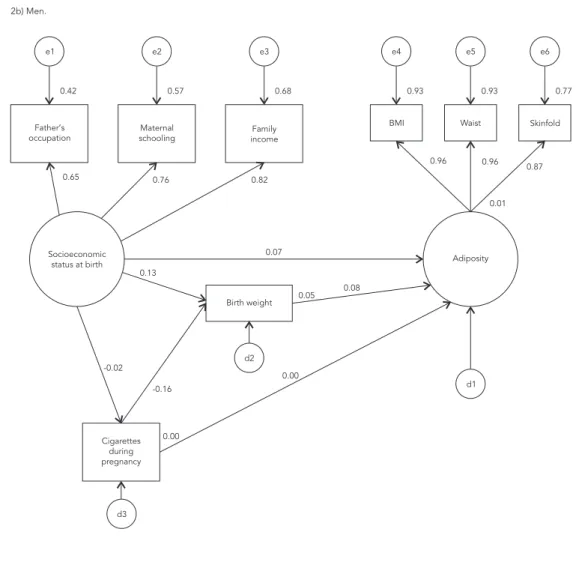
Figure 2 shows the standardized coefficients of the structural model obtained for women (Fig-ure 2a) and men (Fig(Fig-ure 2b). These coefficients indicate the impact, expressed as standard devia-tion units, on the response variable relative to the variation of one standard deviation unit in the explanatory variable. This coefficient is similar to the beta weight coefficient of regression models and allows for the evaluation of the relative im-portance of variables in the model.
The direct effect of birth weight on adiposity in adult life, adjusted for socioeconomic status at the time of birth and the number of cigarettes smoked by the mother during pregnancy, was of low magnitude (0.08 for men and 0.09 for women) but statistically significant (p < 0.05). This means that for each variation of one standard deviation in birth weight there was a significant increase of 0.09 standard deviation in adiposity for women and of 0.08 standard deviation for men, corre-sponding to a small effect. The number of ciga-rettes smoked by the mother during pregnancy
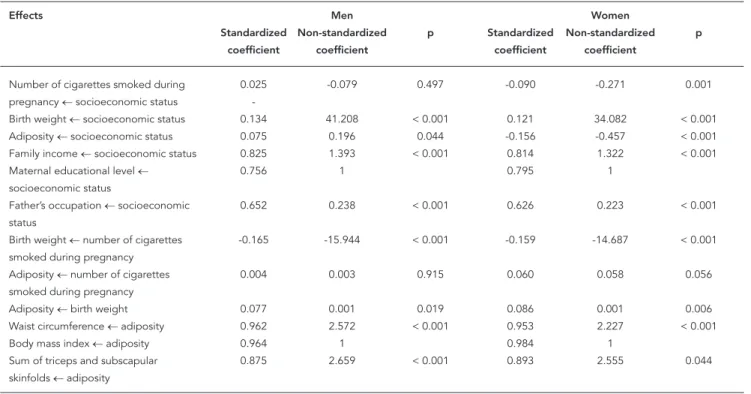
Table 1
Standardized and non-standardized coeffi cients of the structural equation models using adiposity as latent response variable.
Effects Men Women
Standardized Non-standardized p Standardized Non-standardized p
coefficient coefficient coefficient coefficient
Number of cigarettes smoked during 0.025 -0.079 0.497 -0.090 -0.271 0.001 pregnancy ← socioeconomic status
Birth weight ← socioeconomic status 0.134 41.208 < 0.001 0.121 34.082 < 0.001 Adiposity ← socioeconomic status 0.075 0.196 0.044 -0.156 -0.457 < 0.001 Family income ← socioeconomic status 0.825 1.393 < 0.001 0.814 1.322 < 0.001
Maternal educational level ← 0.756 1 0.795 1
socioeconomic status
Father’s occupation ← socioeconomic 0.652 0.238 < 0.001 0.626 0.223 < 0.001 status
Birth weight ← number of cigarettes -0.165 -15.944 < 0.001 -0.159 -14.687 < 0.001 smoked during pregnancy
Adiposity ← number of cigarettes 0.004 0.003 0.915 0.060 0.058 0.056 smoked during pregnancy
Adiposity ← birth weight 0.077 0.001 0.019 0.086 0.001 0.006 Waist circumference ← adiposity 0.962 2.572 < 0.001 0.953 2.227 < 0.001
Body mass index ← adiposity 0.964 1 0.984 1
had no effect on adiposity in adult life among men (SC = 0.004, p = 0.91), but was marginally significant among women (SC = 0.06, p = 0.056) (Table 1).
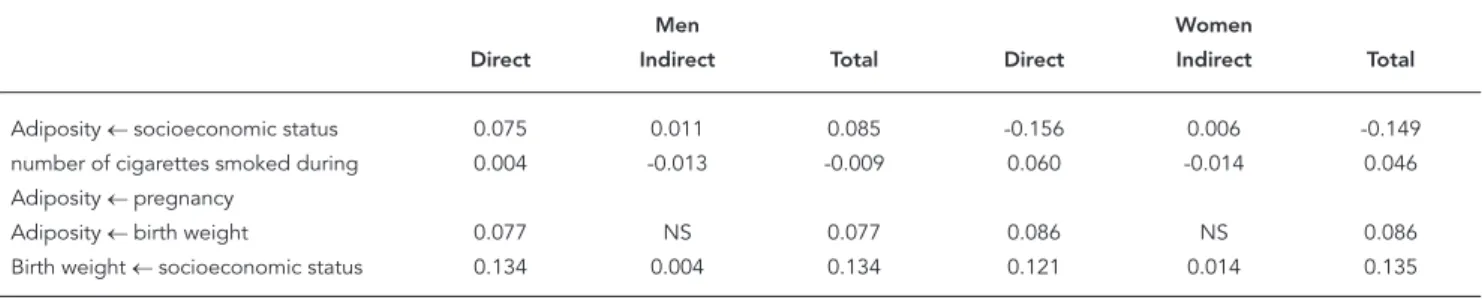
The portion of the indirect effect of the num-ber of cigarettes smoked by the mother during pregnancy on adult adiposity measured by birth weight was not relevant.The indirect effect was estimated by multiplying the coefficient of the effect of the number of cigarettes on birth weight by the coefficient of the effect of birth weight on adiposity, and was -0.014 (-0.16 x 0.09) for women and -0.013 (-0.16 x 0.08) for men (Table 2).
The socioeconomic status of the family at the time of birth was the variable that most influenced adiposity in adult life, but its effect
differed between men and women. For women, socioeconomic status interfered negatively with obesity (-0.16), whereas for men the effect was positive (0.07), with both effects being significant (Figure 2). This finding indicates that adiposity was greater among men of better socioeconom-ic status and among women of poor socioeco-nomic status. The total effect (sum of the direct effect and of indirect effects) of socioeconomic status on adiposity presented a similar pattern to that observed for part of the direct effect, being positive for men (0.085) and negative for women (-0.149) (Table 2). Most of the effect of socioeco-nomic status at the time of birth on adiposity was direct, with a non-relevant portion being medi-ated by the variables included in the model. Figure 2
Structural equation model with adiposity as latent response variable.
e1
0.39 0.63 0.66 0.97 0.91 0.80
0.63 0.80 0.81
0.98 0.95 0.89
0.03
-0.16 0.12
-0.09 -0.16
0.01
0.06
0.04 0.09
d1 d2
d3
e2 e3
Father’s occupation
Socioeconomic
status at birth Adiposity
Cigarettes during pregnancy
Birth weight Maternal
schooling
Family income
BMI Waist Skinfold
e4 e5 e6
2a) Women.
Figure 2 (continued)
e1
0.42 0.57 0.68 0.93 0.93 0.77
0.65 0.76 0.82
0.96 0.96 0.87
0.01
0.07 0.13
-0.02 -0.16
0.00
0.00
0.05 0.08
d1 d2
d3
e2 e3
Father’s occupation
Socioeconomic
status at birth Adiposity
Cigarettes during pregnancy
Birth weight Maternal
schooling incomeFamily
BMI Waist Skinfold
e4 e5 e6
2b) Men.
The models including adiposity as the re-sponse variable presented satisfactory fit indices for both men and women; for example, a nonsig-nificant χ² for both men (p = 0.076) and women (p = 0.107). The model for men presented an RMSEA of 0.023 (< 0.08 indicates a good fit) and TLI of 0.995 (> 0.90 suggests a good fit). Accord-ing to most indices, the model fit was better for women than for men (Table 3).
In view of the elevated factor loadings of BMI, waist circumference and STSS indicators on the composition of the latent adiposity construct, we tested a model in which the adiposity construct was replaced with the BMI indicator. Figure 3 shows the results obtained with this model for women (Figure 3a) and men (Figure 3b). The es-timates of the structural relations in the model including BMI (Figure 1) did not change in a
rel-evant manner compared to those obtained with the model including adiposity (Figure 2). Most indices indicated a better fit of the models in-cluding BMI as response variable. In the model for women, χ² were 3.785 and not significant (p = 0.706), and AIC was 45.785. For men, the es-timated χ² value was 5.558 and not significant (p = 0.474), and AIC was 47.558. On the other hand, the models including BMI might be over-fitted as suggested by the normed chi-square (χ²/d.f.) values lower than 1, thus reducing the possibility of generalizing the results to other populations. These models are more parsimoni-ous, including a smaller number of parameters since parameters associated with the adiposity construct were excluded (Table 3).
indices obtained were similar to those observed for the model including only BMI (data not shown, available from the authors).
Multiple linear regression model
Figure 4 shows the standardized coefficients of a multiple linear regression model obtained for women (Figure 4a) and men (Figure 4b). For women direct effects of maternal schooling (SC = -0.11; p = 0.010), birth weight (SC = 0.08; p < 0.001) and the number of cigarettes smoked during pregnancy (SC = 0.07; p = 0.021) on BMI were significant. For men only birth weight in-fluenced BMI (SC = 0.06; p = 0.045).
Discussion
Birth weight influenced adiposity in both male and female young adults, with its effect be-ing direct and small. Maternal smokbe-ing durbe-ing
pregnancy did not influence adiposity in either gender, although the model for women suggests a small effect of marginal significance. The vari-able that influenced adiposity of young adults the most was socioeconomic status of the family at the time of birth. Its adjusted effect was small and positive for men, indicating that men who had a better socioeconomic status at birth tended to present greater adiposity when adults. For wom-en, the effect of socioeconomic status on adipos-ity was moderate and negative, demonstrating that women who had a better socioeconomic status at the time of their birth presented lower adiposity in early adult life. The most important effects were direct, with the effect of socioeco-nomic status on adiposity mediated by birth weight or maternal smoking during pregnancy being very small.
The addition of abdominal circumference and STSS to BMI to compose the adiposity con-struct resulted in models with good fit indices. However, the elevated indicator factor loadings Table 2
Standardized direct, indirect and total effects of the structural equation models using adiposity as a latent response variable.
Men Women
Direct Indirect Total Direct Indirect Total
Adiposity ← socioeconomic status 0.075 0.011 0.085 -0.156 0.006 -0.149 number of cigarettes smoked during 0.004 -0.013 -0.009 0.060 -0.014 0.046 Adiposity ← pregnancy
Adiposity ← birth weight 0.077 NS 0.077 0.086 NS 0.086
Birth weight ← socioeconomic status 0.134 0.004 0.134 0.121 0.014 0.135
NS: effects not specifi ed in the model.
Table 3
Fit indicators of the structural equation models.
Indicators Response variable: adiposity Response variable: BMI
Men Women Men Women
χ2 (p value) 24.648 (0.076) 23.249 (0.107) 5.558 (0.474) 3.785 (0.706)
χ2/d.f. 1.540 1.453 0.926 0.631
RMSEA (90%CI) 0.023 (0.000-0.041) 0.021 (0.000-0.038) 0.000 (0.000-0.040) 0.000 (0.000-0.030)
NFI 0.994 0.995 0.993 0.996
TLI 0.995 0.997 1.00 1.00
AIC 80.648 79.249 47.558 45.785
R2 1.3% 3.2 % 1.0% 3.0%
χ2: likelihood ratio chi-square statistic; χ2/d.f.: normed chi-square; RMSEA: root mean square error of approximation; NFI: normed fi t index; TLI: Tucker-Lewis
Figure 3
Structural equation model with body mass index as observed response variable.
e1
0.39 0.63 0.66
0.03
0.63 0.80 0.81
-0.15 0.12
-0.09 -0.16
0.01
0.07
0.04 0.09
d2
d3
e2 e3
d1 Father’s
occupation
Socioeconomic status at birth
Cigarettes during pregnancy
Birth weight Maternal
schooling
Family income
BMI
3a) Women.
(continues)
pointed to low discriminant validity, suggesting that BMI alone is a good estimator of adiposity and that the addition of abdominal circumfer-ence and STSS seems to be unnecessary. How-ever, both the model including only BMI and the model including adiposity presented good fit indices, with a better fit being observed for the more parsimonious model including only BMI. In addition, the fact that the estimates of struc-tural relationships and fit indices obtained with models including either waist circumference or STSS were similar to those observed for the model including only BMI suggests that in this population of young adults these three measures alone or in combination are good estimators of body adiposity.
of non-abdominal and abdominal subcutaneous and visceral fat in both men and women 13. In the present study, both BMI and waist circumference were treated as continuous variables. However, we do not know if the result would be the same if these variables were analyzed as categorical variables.
Positive associations between birth weight and BMI in childhood 30,31,32, adolescence 33 and adult life 2,3,32 were the predominant findings in studies on this subject. However, a Finnish study only described this association for men 34, where-as an Indian study only observed this where-association in women 35. On the other hand, a recent English study found no association between birth weight and BMI 36. The interpretation of this associa-tion would be that birth weight influences BMI in adult life or that both are influenced by other
variable(s) or common cause(s). In most studies, this association even persisted after adjustment for socioeconomic status 2,3,32,33, in agreement with the present results. However, although the relationship between higher birth weight and higher BMI in adult life seems to be consistent, in some studies adjustment for other confounding factors such as parental adiposity and gestational age resulted in the disappearance of this asso-ciation 32. In the present investigation no data regarding parental adiposity were collected and the results were not adjusted for gestational age. Since the main objective of the present study was to describe a didactic example of the use of struc-tural equation modeling in epidemiology, the number of variables to be included in the model was limited in order to facilitate their interpreta-tion. The proposed model is a simplification of a Figure 3 (continued)
e1
0.42 0.57 0.68
0.01
0.65 0.76 0.82
0.06 0.13
-0.02 -0.16
0.00
0.02
0.05 0.06
d2
d3
e2 e3
d1 Father’s
occupation
Socioeconomic status at birth
Cigarettes during pregnancy
Birth weight Maternal
schooling incomeFamily
BMI
Figure 4
Multiple linear regression with only direct effects and directly observed variables.
0.02 -0.11
0.10
-0.06
-0.17
0.08
0.07
d1
Cigarettes during pregnancy Birth weight
Maternal schooling
BMI
4a) Women.
0.01 0.05
0.08
-0.03
-0.17
0.06
0.02
d1
Cigarettes during pregnancy Birth weight
Maternal schooling
BMI
4b) Men.
complex reality and it is not intended to be a full causal model.
The observation of a positive association between socioeconomic status and adipos-ity among men and negative association among women agrees with other Brazilian studies 37,38,39. This association seems to involve historicity and to depend on the social context. In developed countries, at the beginning of the nutritional transition, obesity predominated among both men and women of a higher socioeconomic
of poor socioeconomic status may explain why the relationship between socioeconomic status and adiposity is positive among men 39. It is pos-sible and expected that the inversion of this rela-tionship will also be observed among men as the nutritional transition advances in Brazil 45.
In contrast to various studies, we observed no association between maternal smoking dur-ing pregnancy and adiposity in men 6,46,47,48. For women, the effect of the number of cigarettes smoked during pregnancy on adiposity was small and marginally significant. However, in all studies this association was evaluated by treating smok-ing and obesity as categorical variables, whereas in the present investigation these two parameters were analyzed as continuous variables.
Main estimates of direct effects in the struc-tural equation modeling model were similar to those derived from the multiple linear regres-sion model. However, it is important to note that multiple linear regression is not conceptually appropriate to answer questions of temporality because it does not consider the temporal se-quence among the factors. Moreover, had struc-tural equation modeling not been performed it would not be possible to answer two questions: if inclusion of other measures of body fat other than BMI contributes to a better measure of body adiposity and if indirect effects of socioeconomic status and maternal smoking on body adipos-ity are important or not. Hierarchical modeling could have been used to study mediation includ-ing only directly observed variables 49. However, this approach does not produce fit indices of the whole model, nor does it estimate indirect ef-fects with its standard errors, being necessary to implement as many regressions as the number of endogenous variables to study mediation.
The present study has some positive points. This was a cohort study conducted in a develop-ing country and involvdevelop-ing a large sample, facts that confer high power to detect associations. The use of structural equation modeling permit-ted a better adjustment for socioeconomic status, which is a common confounding factor in stud-ies on the association of birth weight and mater-nal smoking during pregnancy with adiposity in early adult life. The use of latent variables also permitted the consideration of measurement er-ror in the evaluation of socioeconomic status and adiposity, thus providing effect estimates that were less contaminated by measurement bias for these variables. In addition, structural equation modeling permitted the estimation of indirect effects which, in this case, were not important. One limitation of the present study was the use of maximum likelihood estimation using the AMOS program. This method requires multivariate
nor-mality, linear relationships and the measurement of all variables on a continuous scale. Since all variables were treated as continuous variables, with some being ordinal variables or showing elevated degrees of asymmetry and/or kurtosis, bootstrap estimation was performed 26 to test the robustness of the results, which were similar. Sim-ulation studies have shown that the maximum likelihood method produces good estimates even in the presence of excessive kurtosis and when the number of categories of ordinal variables is at least four 19. Another limitation of this study was the high percentage of missing information about family income (16.1%). FIML was used to reduce this limitation since this method is more efficient in the treatment of missing data than deleting records with incomplete information for some variable (listwise deletion) 24. Finally, there was selective loss to follow-up since sub-jects of low socioeconomic status and children born to mothers who smoked during pregnancy, presented the lowest follow-up rates. There was no difference in follow-up rate according to birth weight 21. However, although the differences in follow-up rates were statistically significant due to the large sample size, the percentage differ-ences were small. As a consequence, the esti-mates of the association of socioeconomic status and birth weight with adiposity obtained here might have been underestimated. Selective loss probably did not yield a false-negative result in the analysis of the association between maternal smoking during pregnancy and adiposity among men because the estimated coefficient was close to zero.
Resumo
O objetivo desse artigo é apresentar um exemplo da modelagem com equações estruturais. Foi avaliada associação entre peso ao nascer e adiposidade na vida adulta jovem, ajustando-se para número de cigarros fumados na gravidez e situação sócio-econômica ao nascimento. Dados de 2.063 adultos da coorte de Ri-beirão Preto, São Paulo, Brasil, de 1978/1979 foram utilizados. A adiposidade foi medida pelo índice de massa corporal (IMC), circunferência da cintura, e somatório das pregas cutâneas subescapular e a trici-pital. Os modelos foram estimados por máxima veros-similhança, separadamente para homens e mulheres. O peso ao nascer teve efeito pequeno e significante na adiposidade em homens (CP – coeficiente padroniza-do = 0,08) e mulheres (CP = 0,09). Tabagismo materno durante a gravidez não influenciou a adiposidade em homens (CP = 0,004), mas em mulheres a significância foi marginal (CP = 0,07; p = 0,056). O efeito da situ-ação sócio-econômica da família ao nascimento foi pequeno e positivo para os homens (CP = 0,08) e mo-derado e negativo (CP = -0,16) para as mulheres. Nes-ta população adulNes-ta jovem, os indicadores utilizados sozinhos ou em conjunto mediram bem a adiposidade corporal.
Peso ao Nascer; Tabagismo; Adisposidade; Modelos Matemáticos; Métodos
Contributors
A. A. M. Silva was responsible for the conception of the article, review of the literature, elaboration of the method, analysis of the results, and final draft of the manuscript. A. G. G. Vasconcelos was responsible for the elaboration of the method, statistical analysis of the results and final draft of the manuscript. H. Bettiol and M. A. Barbieri coordinated the data collection and con-tributed to the literature review, analysis of the results and manuscript writing.
References
1. Baird J, Fisher D, Lucas P, Kleijnen J, Roberts H, Law C. Being big or growing fast: systematic review of size and growth in infancy and later obesity. BMJ 2005; 331:929.
2. Sorensen HT, Sabroe S, Rothman KJ, Gillman M, Fischer P, Sorensen TI. Relation between weight and length at birth and body mass index in young adulthood: cohort study. BMJ 1997; 315:1137. 3. Rasmussen F, Johansson M. The relation of weight,
length and ponderal index at birth to body mass index and overweight among 18-year-old males in Sweden. Eur J Epidemiol 1998; 14:373-80.
4. Kuh D, Hardy R, Chaturvedi N, Wadsworth ME. Birth weight, childhood growth and abdominal obesity in adult life. Int J Obes Relat Metab Disord 2002; 26:40-7.
5. von Kries R, Toschke AM, Koletzko B, Slikker Jr. W. Maternal smoking during pregnancy and child-hood obesity. Am J Epidemiol 2002; 156:954-61.
6. Wideroe M, Vik T, Jacobsen G, Bakketeig LS. Does maternal smoking during pregnancy cause child-hood overweight? Paediatr Perinat Epidemiol 2003; 17:171-9.
7. Tome FS, Cardoso VC, Barbieri MA, Silva AA, Simões VM, Garcia CA, et al. Are birth weight and maternal smoking during pregnancy associated with malnutrition and excess weight among school age children? Braz J Med Biol Res 2007; 40:1221-30. 8. Hui LL, Schooling CM, Leung SS, Mak KH, Ho LM,
Lam TH, et al. Birth weight, infant growth, and childhood body mass index: Hong Kong’s children of 1997 birth cohort. Arch Pediatr Adolesc Med 2008; 162:212-8.
10. Goldani MZ, Haeffner LS, Agranonik M, Barbieri MA, Bettiol H, Silva AA. Do early life factors influ-ence body mass index in adolescents? Braz J Med Biol Res 2007; 40:1231-6.
11. Romero-Corral A, Somers VK, Sierra-Johnson J, Thomas RJ, Collazo-Clavell ML, Korinek J, et al. Accuracy of body mass index in diagnosing obesity in the adult general population. Int J Obes (Lond) 2008; 32:959-66.
12. Ardern CI, Katzmarzyk PT, Janssen I, Ross R. Dis-crimination of health risk by combined body mass index and waist circumference. Obes Res 2003; 11:135-42.
13. Janssen I, Heymsfield SB, Allison DB, Kotler DP, Ross R. Body mass index and waist circumference independently contribute to the prediction of non-abdominal, abdominal subcutaneous, and visceral fat. Am J Clin Nutr 2002; 75:683-8.
14. Janssen I, Katzmarzyk PT, Ross R. Waist circumfer-ence and not body mass index explains obesity-re-lated health risk. Am J Clin Nutr 2004; 79:379-84. 15. Singh-Manoux A, Clarke P, Marmot M. Multiple
measures of socio-economic position and psycho-social health: proximal and distal measures. Int J Epidemiol 2002; 31:1192-9.
16. Silva AA, Metha Z, O’Callaghan FJ. The relative ef-fect of size at birth, postnatal growth and social factors on cognitive function in late childhood. Ann Epidemiol 2006; 16:469-76.
17. Silva AA, Mehta Z, O’Callaghan FJ. Duration of breast feeding and cognitive function: Popula-tion based cohort study. Eur J Epidemiol 2006; 21: 435-41.
18. Kline RB. Principles and practice of structural equation modeling. 2nd Ed. New York: Guilford
Press; 2004.
19. Hoyle RH. Structural equation modeling: concepts, issues, and applications. Thousand Oaks: Sage; 1995.
20. Maruyama GM. Basics of structural equation mod-eling. Thousand Oaks: Sage; 1997.
21. Barbieri MA, Bettiol H, Silva AA, Cardoso VC, Si-moes VM, Gutierrez MR, et al. Health in early adulthood: the contribution of the 1978/79 Ri-beirao Preto birth cohort. Braz J Med Biol Res 2006; 39:1041-55.
22. Cardoso VC, Simões VM, Barbieri MA, Silva AA, Bettiol H, Alves MT, et al. Profile of three Brazilian birth cohort studies in Ribeirao Preto, SP and Sao Luis, MA. Braz J Med Biol Res 2007; 40:1165-76. 23. Frisancho AR. Anthropometric standards for the
assessment of growth and nutritional status. Ann Arbor: University of Michigan Press; 1990. 24. Little RJA, Rubin DB. Statistical analysis with
miss-ing data. 2nd Ed. New Jersey: John Wiley & Sons;
2002.
25. Hair JF, Anderson RE, Tatham R, Black WC. Análise multivariada de dados. Porto Alegre: Bookman; 2005.
26. Byrne B. Structural equation modelling with AMOS: basic concepts, applications and program-ming. Mahwah: Lawrence Erlbaum; 2001. 27. Cheng TO. Waist circumference versus body mass
index in risk prediction of coronary heart disease: comparing apples and oranges. J Intern Med 2004; 255:690-1.
28. Iwao S, Iwao N, Muller DC, Elahi D, Shimokata H, Andres R. Does waist circumference add to the predictive power of the body mass index for coro-nary risk? Obes Res 2001; 9:685-95.
29. Dobbelsteyn CJ, Joffres MR, MacLean DR, Flow-erdew G. A comparative evaluation of waist cir-cumference, waist-to-hip ratio and body mass in-dex as indicators of cardiovascular risk factors. The Canadian Heart Health Surveys. Int J Obes Relat Metab Disord 2001; 25:652-61.
30. Martins EB, Carvalho MS. Associação entre peso ao nascer e o excesso de peso na infância: revisão sistemática. Cad Saúde Pública 2006; 22:2281-300. 31. Hui LL, Nelson EA, Yu LM, Li AM, Fok TF. Risk
fac-tors for childhood overweight in 6- to 7-y-old Hong Kong children. Int J Obes Relat Metab Disord 2003; 27:1411-8.
32. Parsons TJ, Power C, Logan S, Summerbell CD. Childhood predictors of adult obesity: a system-atic review. Int J Obes Relat Metab Disord 1999; 23 Suppl 8:S1-107.
33. Monteiro PO, Victora CG, Barros FC, Monteiro LM. Birth size, early childhood growth, and adolescent obesity in a Brazilian birth cohort. Int J Obes Relat Metab Disord 2003; 27:1274-82.
34. Eriksson J, Forsen T, Tuomilehto J, Osmond C, Barker D. Size at birth, childhood growth and obe-sity in adult life. Int J Obes Relat Metab Disord 2001; 25:735-40.
35. Sachdev HS, Fall CH, Osmond C, Lakshmy R, Dey Biswas SK, Leary SD, et al. Anthropometric indica-tors of body composition in young adults: relation to size at birth and serial measurements of body mass index in childhood in the New Delhi birth cohort. Am J Clin Nutr 2005; 82:456-66.
36. McCarthy A, Hughes R, Tilling K, Davies D, Smith GD, Ben-Shlomo Y. Birth weight; postnatal, infant, and childhood growth; and obesity in young adult-hood: evidence from the Barry Caerphilly Growth Study. Am J Clin Nutr 2007; 86:907-13.
37. Monteiro CA, Conde WL, Castro IRR. A tendência cambiante da relação entre escolaridade e risco de obesidade no Brasil (1975-1997). Cad Saúde Públi-ca 2003; 19 Suppl 1:S67-75.
38. Monteiro CA, Conde WL, Popkin BM. Independent effects of income and education on the risk of obe-sity in the Brazilian adult population. J Nutr 2001; 131:881S-6.
39. Monteiro CA, Benício MHD’A, Conde WL, Popkin BM. Shifting obesity trends in Brazil. Eur J Clin Nutr 2000; 54:342-6.
40. Sobal J, Stunkard AJ. Socioeconomic status and obesity: a review of the literature. Psychol Bull 1989; 105:260-75.
41. McLaren L. Socioeconomic status and obesity. Epi-demiol Rev 2007; 29:29-48.
42. Popkin BM, Gordon-Larsen P. The nutrition transi-tion: worldwide obesity dynamics and their deter-minants. Int J Obes Relat Metab Disord 2004; 28 Suppl 3:S2-9.
44. Monteiro CA, Moura EC, Conde WL, Popkin BM. Socioeconomic status and obesity in adult popula-tions of developing countries: a review. Bull World Health Organ 2004; 82:940-6.
45. Monteiro CA, Conde WL, Popkin BM. Income-spe-cific trends in obesity in Brazil: 1975-2003. Am J Public Health 2007; 97:1808-12.
46. von Kries R, Bolte G, Baghi L, Toschke AM. Parental smoking and childhood obesity: is maternal smok-ing in pregnancy the critical exposure? Int J Epide-miol 2008; 37:210-6.
47. Power C, Jefferis BJ. Fetal environment and subse-quent obesity: a study of maternal smoking. Int J Epidemiol 2002; 31:413-9.
48. Al Mamun A, Lawlor DA, Alati R, O’Callaghan MJ, Williams GM, Najman JM. Does maternal smoking during pregnancy have a direct effect on future off-spring obesity? Evidence from a prospective birth cohort study. Am J Epidemiol 2006; 164:317-25. 49. Victora CG, Huttly SR, Fuchs SC, Olinto MT. The
role of conceptual frameworks in epidemiological analysis: a hierarchical approach. Int J Epidemiol 1997; 26:224-7.
Submitted on 08/Sep/2008