PAN AMERICAN HEALTH ORGANIZATION
WORLD HEALTH ORGANIZATION
25th PAN AMERICAN SANITARY CONFERENCE
50th SESSION OF THE REGIONAL COMMITTEE
Washington, D.C., 21-25 September 1998
Provisional Agenda Item 4.7
CSP25/13, Add. 1 (Eng.)
23 September 1998
ORIGINAL: ENGLISH-SPANISH
ACQUIRED IMMUNODEFICIENCY SYNDROME (AIDS)
IN THE AMERICAS
The Director is pleased to present to the Conference, for its consideration, an
updated report on the epidemiological surveillance of AIDS in the Americas as of
September, 1998.
AI DS Surve illa nc e in t he
AI DS Surve illa nc e in t he
Am e ric a s
Am e ric a s
Qua rt e rly Re port
Qua rt e rly Re port
Se pt e m be r, 1 9 9 8
Se pt e m be r, 1 9 9 8
AIDS Surveillance in the Americas
September, 1998
TABLE OF CONTENTS
n
AIDS cases as of September of 1998
n
Global estimates of the HIV/AIDS epidemic as of end 1997
n
Regional Program on AIDS and STD
n
AIDS Surveillance in the Americas
n
Table 1. Number of reported cases of AIDS by year, and cumulative cases and deaths, by
country and subregion, as of 31 August 1998
n
Table 2. Annual incidence rates of AIDS (per million population), by country and by year,
1991-1998, as 31 August 1998
n
Table 3. Annual incidence rates of AIDS (per million population), by sex, by country and by year,
1991-1998, as of 31 August 1998
n
Table 4. Male:Female ratio of reported AIDS cases, by country and by year, 1991-1998, as of 31
August 1998
n
Table 5. Total cases, pediatric cases, percent of pediatric cases from total; perinatal cases, and
percent of perinatal cases from total pediatric, by subregion and country, cumulative to 31
August 1998
n
Cumulative total, percent distribution and trend of the number of AIDS cases in the Andean Area
n
Cumulative total, percent distribution and trend of the number of AIDS cases in Brazil
n
Cumulative total, percent distribution and trend of the number of AIDS cases in the Caribbean
n
Cumulative total, percent distribution and trend of the number of AIDS cases in Central America
n
Cumulative total, percent distribution and trend of the number of AIDS cases in the Latin
Caribbean
n
Cumulative total, percent distribution and trend of the number of AIDS cases in Mexico
n
Cumulative total, percent distribution and trend of the number of AIDS cases in North America
n
Cumulative total, percent distribution and trend of the number of AIDS cases in the Southern
Cone
Wor ldwide cases:
1 ,8 9 3 ,7 8 4
Cases in the Amer icas:
9 1 5 ,8 5 8
Adu lts:
8 9 9 ,0 3 9
Ch ildr en :
1 6 ,8 1 9
Nu m ber of Dea th s:
5 1 0 ,4 3 8
AI DS Ca se s
AI DS Ca se s
AIDS Surveillance in the Americas
September, 1998
Global estimates of the HIV/AIDS epidemic as of end 1997
People newly infected with HIV in 1997
Total
Adults
Women
Children <15 years
5,8 million
5,2 million
2,1 million
590 000
Number of people living with HIV/AIDS
Total
Adults
Women
Children <15 years
30,6 million
29,4 million
12,2 million
1,1 million
AIDS deaths in 1997
Total
Adults
Women
Children <15 years
2,3 million
1,8 million
800 000
460 000
Total number of AIDS deaths since the beginning of
the epidemic
Total
Adults
Women
Children <15 years
11,7 million
9,0 million
3,9 million
2,7 million
Total number of AIDS orphans since the beginning
of the epidemic
(defined as children who lost their mother
or parents to AIDS when they were under the age of 15)
AIDS Surveillance in the Americas
September, 1998
n
The Regional Program on AIDS and STD
The Regional Program on AIDS and STD of the Division of Disease Prevention and Control of the Pan
American Health Organization (PAHO) provides technical expertise for the prevention and control of
HIV/AIDS and other sexually transmitted diseases in the Region of the Americas. The mandate for
PAHO'S Regional Program on AIDS/STD is to promote, design and facilitate technical activities and
policies to improve the capacity of Member Countries to reduce the number of future infections and to
provide timely and adequate care for people living with HIV/AIDS/STD.
The Regional Program is part of a broader set of culturally-sensitive, gender-specific, multinational and
multisectoral responses to HIV/AIDS and STD in the Americas. The following types of technical
assistance provide a framework for the Program's many activities.
•
dissemination of information
•
training
•
direct technical cooperation
•
resource mobilization
The objectives of the Regional Program on AIDS and STD are:
ADVOCATE
for HIV/STD prevention and control at the country level in Latin America and the
Caribbean;
STRENGTHEN MANAGEMENT
capacity to develop and implement policies for HIV and STD
prevention and control;
INVOLVE
nongovernmental organizations (NGOs) in prevention and control efforts and build
networks among NGOs at the country level;
PROVIDE
direct technical cooperation to Member Countries including (but not limited to):
epidemiological analysis; development of educational materials and country HIV/STD
surveillance reports; laboratory support for STD diagnosis, and improvement of blood safety
measures, etc;
PROMOTE
research about HIV/AIDS epidemiological trends, their relation to other STD,
prevention messages, surveillance of socioeconomic impact, etc;
DISSEMINATE
information (technical and scientific) to and from Member Countries;
AIDS Surveillance in the Americas
September, 1998
n
n
AIDS Surveillance in the Americas
PAHO began its AIDS surveillance system in 1996, although cases had been reported informally to
PAHO since 1983. The information is currently submitted to PAHO from 47 countries and territories of
the Region of the America. These data are received within 30 to 45 days after the end of each quarter.
PAHO then produces the present report, which is distributed to all the countries in the Region. Twice a
year PAHO sends the information to the World Health Organization headquarters in Geneva, Switzerland,
where data are gathered from all regions, and published as the Global AIDS Report.
As of September of 1998, a cumulative total of
899,039
cases were reported in the Americas. From
these,
16,819
are pediatric cases (<15 years old). A total of
510,438
cumulative deaths have been
reported since 1986. The figures could be higher since data is incomplete for 1998.
Certain factors such as under diagnosis, underreporting and delayed reporting affect the completeness of
the data. This should be considered when analyzing the data. Additionally, many times the countries
provide the number of cases by year but do not report the corresponding age, sex and exposure category
for those cases.
PAHO and its Member States are working continuously to improve the quality and completeness of the
information, to be able to analyze and provide a better profile of the epidemic in each consecutive report.
In August of 1998, a revision to improve quality of the data contained in the regional database was
undertaken. Many countries have already sent their updated information. However other countries are in
the process of sending the data, and it is expected that the revision will be completed by the end of this
year.
The Regional Program on AIDS and STD in collaboration with the WHO/PAHO/UNAIDS Working Group
on Global HIV/AIDS and STD Surveillance has developed a document –
Epidemiological Fact
Table 1. Number of reported cases of AIDS by year, and cumulative cases and deaths, by country and subregion, as of 31 August 1998.
SUBREGION Number of cases
Country or Territory Throug h 1991
1992 1993 1994 1995 1996 1997 Unkno w
Cumulative total
Total deaths
Date of last report
REGIONAL TOTAL 334,353 105,896 109,843 104,565 100,559 87,326 66,542 6,774 915,858 510,438 31-Aug-98
LATIN AMERICA 66,315 24,947 28,870 31,089 31,701 29,569 24,569 6,774 243,834 112,856
ANDEAN AREA 6,868 2,554 2,498 3,385 3,033 3,019 1,819 670 23,846 10,416
Bolivia 47 19 21 19 15 28 30 0 179 107 16-Apr-98
Colombia 2,804 934 740 1,361 910 1,095 589 0 8,433 3,375 31-Dec-97
Ecuador 198 69 90 117 69 67 15 0 625 430 15-Aug-97
Peru 1,339 646 669 787 1,067 1,162 991 670 7,331 2,220 31-Dec-98 Venezuela 2,480 886 978 1,101 972 667 194 0 7,278 4,284 24-Apr-98
SOUTHERN CONE 2,706 1,422 1,819 2,494 2,163 2,783 3,700 0 17,087 5,994
Argentina 1,876 1,103 1,423 2,048 1,689 2,186 2,788 0 13,113 3,582 11-Aug-98 Chile 535 199 238 292 297 367 503 0 2,431 1,558 14-Aug-98
Paraguay 50 30 55 35 50 74 130 0 424 242 15-Jul-98
Uruguay 245 90 103 119 127 156 279 0 1,119 612 28-Aug-98
BRAZIL 34,478 14,043 15,809 17,157 17,666 17,775 11,893 0 128,821 66,636 15-Feb-98
CENTRAL AMERICA 3,362 1,326 1,891 1,962 2,123 2,738 2,825 110 16,337 3,915
Belize 46 13 24 18 28 38 ---- 31 198 190 2-Apr-97
Costa Rica 325 127 128 164 212 202 219 6 1,383 704 15-Dec-97 El Salvador 315 114 176 387 380 417 555 0 2,344 305 20-Aug-98 Guatemala 277 94 178 110 141 835 760 0 2,395 537 17-Apr-98 Honduras 2,012 851 1,183 1,058 1,138 978 929 68 8,217 1,081 28-Jan-98
Nicaragua 29 10 24 38 21 25 28 5 180 105 22-Apr-98
Panama 358 117 178 187 203 243 334 0 1,620 993 11-Feb-98
MEXICO 9,057 3,210 5,058 4,111 4,310 905 2,495 5,923 35,069 16,636 30-Mar-98
LATIN CARIBBEAN (b) 6,061 1,254 475 504 599 494 523 30 9,940 1,739
Cuba 108 71 82 102 116 99 165 0 743 532 29-Jul-98
Dominican Republic 1,792 377 393 402 483 395 358 30 4,230 910 18-May-98 Haiti 4,161 806 ---- ---- ---- ---- ---- 0 4,967 297 26-Jan-94 Puerto Rico 8,495 2,475 2,612 2,279 2,043 1,923 1,439 0 21,266 8,183 27-Aug-98
CARIBBEAN 3,783 1,138 1,320 1,476 1,807 1,855 1,314 41 12,734 7,520
Anguilla 5 ---- ---- ---- ---- ---- ---- 0 5 3 30-Dec-95 Antigua and Barbuda 16 14 18 16 7 13 7 0 91 70 20-Jan-98
Aruba 11 3 1 ---- 6 1 2 0 24 17 15-Apr-96
Bahamas 838 254 297 322 390 374 389 0 2,864 1,845 6-May-98
Barbados 252 78 88 119 95 130 113 0 875 742 19-Mar-98
Cayman Islands 11 4 ---- 3 ---- 3 1 0 22 18 5-Jan-98
Dominica 12 ---- 14 6 5 14 21 0 72 85 10-Aug-98
French Guiana 230 73 52 70 78 62 35 41 641 267 31-Dec-97
Grenada 31 4 21 7 18 18 4 0 103 68 10-Nov-97
Guadeloupe 311 81 77 104 106 73 38 0 790 226 31-Dec-97
Guyana 230 160 107 105 96 144 142 0 984 377 3-Jun-98
Jamaica 333 100 236 359 505 527 370 0 2,430 1,320 4-Nov-97
Martinique 193 44 44 49 41 42 23 0 436 184 31-Dec-97
Montserrat 6 ---- 1 ---- ---- ---- ---- 0 7 0 29-Jul-97 Netherlands Antilles 100 10 47 ---- 76 ---- ---- 0 233 74 12-Mar-96
Saint Kitts and Nevis 31 4 3 5 5 6 4 0 58 33 8-Sep-97
Saint Lucia 33 8 12 13 10 14 19 0 109 103 10-Aug-98
St. Vincent and the Grenadines 41 5 8 8 6 19 24 0 111 106 13-Nov-97
Suriname 106 28 35 20 20 2 ---- 0 211 191 27-Jul-95
Trinidad and Tobago 968 263 243 269 340 412 118 0 2,613 1,754 2-Jul-97 Turks and Caicos Islands 21 4 14 ---- ---- ---- ---- 0 39 30 3-Nov-93
Virgin Islands (UK) 4 1 2 1 3 1 4 0 16 7 10-Aug-98
NORTH AMERICA 268,038 80,949 80,973 73,476 68,858 57,757 41,973 0 672,024 397,582
Bermuda 181 17 15 44 48 17 13 0 335 241 9-Jul-97
Canada 7,700 1,711 1,735 1,678 1,509 919 276 0 15,528 11,373 15-Apr-98 United States of America (c) 260,157 79,221 79,223 71,754 67,301 56,821 41,684 0 656,161 385,968 27-Aug-98 Virgin Islands (USA) 132 53 52 41 41 28 38 0 385 31 27-Aug-98 (a) Information of 1997 is incomplete due to delayed reporting and includes cases of 1998 when the year of last report is 1998.
(b) Total number of cases and deaths reported by Puerto Rico has not been included in the Latin Caribbean totals.
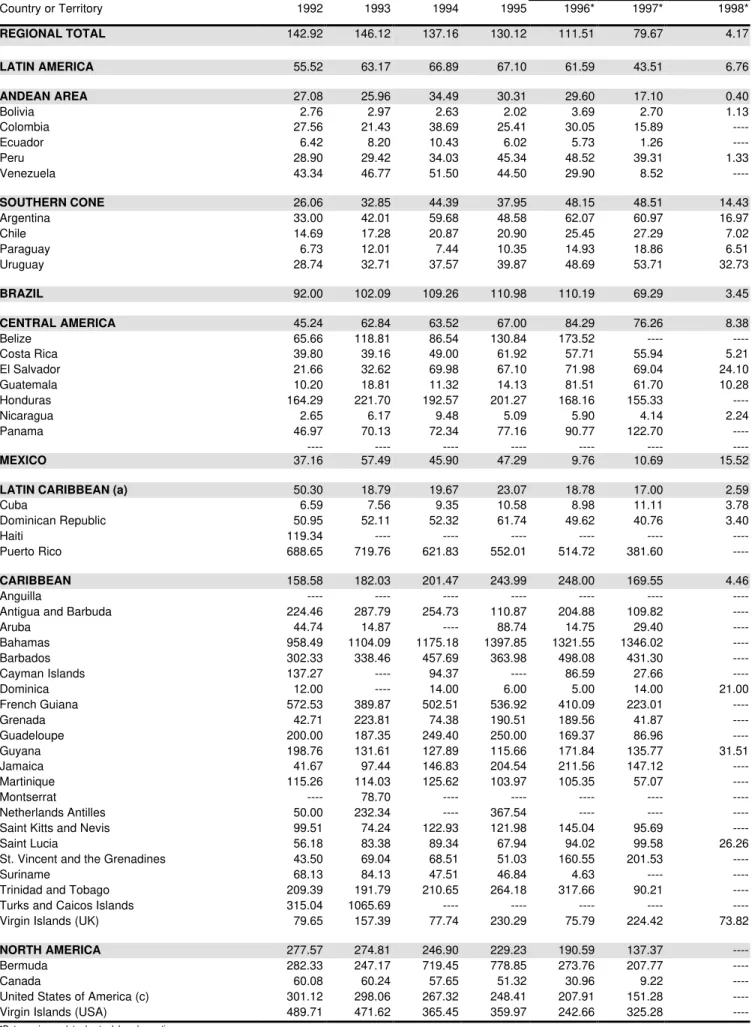
Table 2 Annual incidence of AIDS (per million population), by country and by year, as of 31 August 1998.
SUBREGION RATE PER MILLION
Country or Territory 1992 1993 1994 1995 1996* 1997* 1998*
REGIONAL TOTAL 142.92 146.12 137.16 130.12 111.51 79.67 4.17
LATIN AMERICA 55.52 63.17 66.89 67.10 61.59 43.51 6.76
ANDEAN AREA 27.08 25.96 34.49 30.31 29.60 17.10 0.40 Bolivia 2.76 2.97 2.63 2.02 3.69 2.70 1.13 Colombia 27.56 21.43 38.69 25.41 30.05 15.89 ----Ecuador 6.42 8.20 10.43 6.02 5.73 1.26 ----Peru 28.90 29.42 34.03 45.34 48.52 39.31 1.33 Venezuela 43.34 46.77 51.50 44.50 29.90 8.52
----SOUTHERN CONE 26.06 32.85 44.39 37.95 48.15 48.51 14.43 Argentina 33.00 42.01 59.68 48.58 62.07 60.97 16.97 Chile 14.69 17.28 20.87 20.90 25.45 27.29 7.02 Paraguay 6.73 12.01 7.44 10.35 14.93 18.86 6.51 Uruguay 28.74 32.71 37.57 39.87 48.69 53.71 32.73
BRAZIL 92.00 102.09 109.26 110.98 110.19 69.29 3.45
CENTRAL AMERICA 45.24 62.84 63.52 67.00 84.29 76.26 8.38 Belize 65.66 118.81 86.54 130.84 173.52 ---- ----Costa Rica 39.80 39.16 49.00 61.92 57.71 55.94 5.21 El Salvador 21.66 32.62 69.98 67.10 71.98 69.04 24.10 Guatemala 10.20 18.81 11.32 14.13 81.51 61.70 10.28 Honduras 164.29 221.70 192.57 201.27 168.16 155.33 ----Nicaragua 2.65 6.17 9.48 5.09 5.90 4.14 2.24 Panama 46.97 70.13 72.34 77.16 90.77 122.70 --- ---- ---- ---- ---- ----
----MEXICO 37.16 57.49 45.90 47.29 9.76 10.69 15.52
LATIN CARIBBEAN (a) 50.30 18.79 19.67 23.07 18.78 17.00 2.59 Cuba 6.59 7.56 9.35 10.58 8.98 11.11 3.78 Dominican Republic 50.95 52.11 52.32 61.74 49.62 40.76 3.40 Haiti 119.34 ---- ---- ---- ---- ---- ----Puerto Rico 688.65 719.76 621.83 552.01 514.72 381.60
----CARIBBEAN 158.58 182.03 201.47 243.99 248.00 169.55 4.46 Anguilla ---- ---- ---- ---- ---- ---- ----Antigua and Barbuda 224.46 287.79 254.73 110.87 204.88 109.82 ----Aruba 44.74 14.87 ---- 88.74 14.75 29.40 ----Bahamas 958.49 1104.09 1175.18 1397.85 1321.55 1346.02 ----Barbados 302.33 338.46 457.69 363.98 498.08 431.30 ----Cayman Islands 137.27 ---- 94.37 ---- 86.59 27.66 ----Dominica 12.00 ---- 14.00 6.00 5.00 14.00 21.00 French Guiana 572.53 389.87 502.51 536.92 410.09 223.01 ----Grenada 42.71 223.81 74.38 190.51 189.56 41.87 ----Guadeloupe 200.00 187.35 249.40 250.00 169.37 86.96 ----Guyana 198.76 131.61 127.89 115.66 171.84 135.77 31.51 Jamaica 41.67 97.44 146.83 204.54 211.56 147.12 ----Martinique 115.26 114.03 125.62 103.97 105.35 57.07 ----Montserrat ---- 78.70 ---- ---- ---- ---- ----Netherlands Antilles 50.00 232.34 ---- 367.54 ---- ---- ----Saint Kitts and Nevis 99.51 74.24 122.93 121.98 145.04 95.69 ----Saint Lucia 56.18 83.38 89.34 67.94 94.02 99.58 26.26 St. Vincent and the Grenadines 43.50 69.04 68.51 51.03 160.55 201.53 ----Suriname 68.13 84.13 47.51 46.84 4.63 ---- ----Trinidad and Tobago 209.39 191.79 210.65 264.18 317.66 90.21 ----Turks and Caicos Islands 315.04 1065.69 ---- ---- ---- ---- ----Virgin Islands (UK) 79.65 157.39 77.74 230.29 75.79 224.42 73.82
NORTH AMERICA 277.57 274.81 246.90 229.23 190.59 137.37 ----Bermuda 282.33 247.17 719.45 778.85 273.76 207.77 ----Canada 60.08 60.24 57.65 51.32 30.96 9.22 ----United States of America (c) 301.12 298.06 267.32 248.41 207.91 151.28 ----Virgin Islands (USA) 489.71 471.62 365.45 359.97 242.66 325.28
----*Data are incomplete due to delayed reporting.
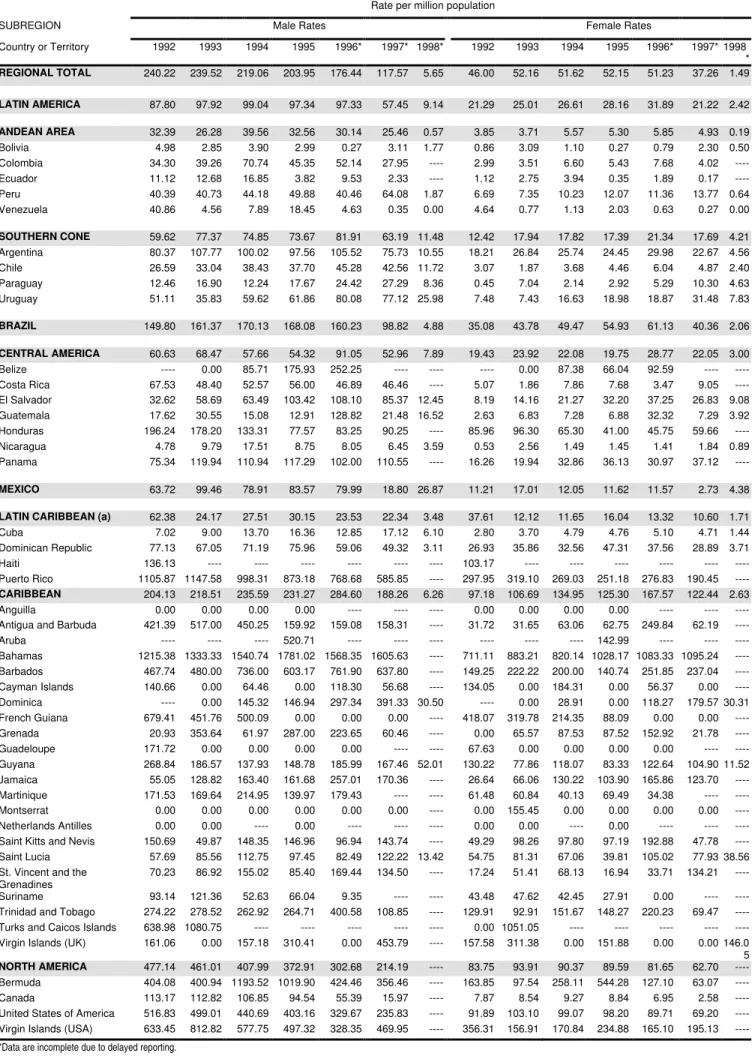
Table 3 Annual incidence of AIDS (per million population), by sex, by country and by year, 1991-1998n as of 31 August 1998.
Rate per million population
SUBREGION Male Rates Female Rates
Country or Territory 1992 1993 1994 1995 1996* 1997* 1998* 1992 1993 1994 1995 1996* 1997* 1998 *
REGIONAL TOTAL 240.22 239.52 219.06 203.95 176.44 117.57 5.65 46.00 52.16 51.62 52.15 51.23 37.26 1.49
LATIN AMERICA 87.80 97.92 99.04 97.34 97.33 57.45 9.14 21.29 25.01 26.61 28.16 31.89 21.22 2.42
ANDEAN AREA 32.39 26.28 39.56 32.56 30.14 25.46 0.57 3.85 3.71 5.57 5.30 5.85 4.93 0.19 Bolivia 4.98 2.85 3.90 2.99 0.27 3.11 1.77 0.86 3.09 1.10 0.27 0.79 2.30 0.50 Colombia 34.30 39.26 70.74 45.35 52.14 27.95 ---- 2.99 3.51 6.60 5.43 7.68 4.02 ----Ecuador 11.12 12.68 16.85 3.82 9.53 2.33 ---- 1.12 2.75 3.94 0.35 1.89 0.17 ----Peru 40.39 40.73 44.18 49.88 40.46 64.08 1.87 6.69 7.35 10.23 12.07 11.36 13.77 0.64 Venezuela 40.86 4.56 7.89 18.45 4.63 0.35 0.00 4.64 0.77 1.13 2.03 0.63 0.27 0.00
SOUTHERN CONE 59.62 77.37 74.85 73.67 81.91 63.19 11.48 12.42 17.94 17.82 17.39 21.34 17.69 4.21 Argentina 80.37 107.77 100.02 97.56 105.52 75.73 10.55 18.21 26.84 25.74 24.45 29.98 22.67 4.56 Chile 26.59 33.04 38.43 37.70 45.28 42.56 11.72 3.07 1.87 3.68 4.46 6.04 4.87 2.40 Paraguay 12.46 16.90 12.24 17.67 24.42 27.29 8.36 0.45 7.04 2.14 2.92 5.29 10.30 4.63 Uruguay 51.11 35.83 59.62 61.86 80.08 77.12 25.98 7.48 7.43 16.63 18.98 18.87 31.48 7.83
BRAZIL 149.80 161.37 170.13 168.08 160.23 98.82 4.88 35.08 43.78 49.47 54.93 61.13 40.36 2.06
CENTRAL AMERICA 60.63 68.47 57.66 54.32 91.05 52.96 7.89 19.43 23.92 22.08 19.75 28.77 22.05 3.00 Belize ---- 0.00 85.71 175.93 252.25 ---- ---- ---- 0.00 87.38 66.04 92.59 ---- ----Costa Rica 67.53 48.40 52.57 56.00 46.89 46.46 ---- 5.07 1.86 7.86 7.68 3.47 9.05 ----El Salvador 32.62 58.69 63.49 103.42 108.10 85.37 12.45 8.19 14.16 21.27 32.20 37.25 26.83 9.08 Guatemala 17.62 30.55 15.08 12.91 128.82 21.48 16.52 2.63 6.83 7.28 6.88 32.32 7.29 3.92 Honduras 196.24 178.20 133.31 77.57 83.25 90.25 ---- 85.96 96.30 65.30 41.00 45.75 59.66 ----Nicaragua 4.78 9.79 17.51 8.75 8.05 6.45 3.59 0.53 2.56 1.49 1.45 1.41 1.84 0.89 Panama 75.34 119.94 110.94 117.29 102.00 110.55 ---- 16.26 19.94 32.86 36.13 30.97 37.12
----MEXICO 63.72 99.46 78.91 83.57 79.99 18.80 26.87 11.21 17.01 12.05 11.62 11.57 2.73 4.38
LATIN CARIBBEAN (a) 62.38 24.17 27.51 30.15 23.53 22.34 3.48 37.61 12.12 11.65 16.04 13.32 10.60 1.71 Cuba 7.02 9.00 13.70 16.36 12.85 17.12 6.10 2.80 3.70 4.79 4.76 5.10 4.71 1.44 Dominican Republic 77.13 67.05 71.19 75.96 59.06 49.32 3.11 26.93 35.86 32.56 47.31 37.56 28.89 3.71 Haiti 136.13 ---- ---- ---- ---- ---- ---- 103.17 ---- ---- ---- ---- ---- ----Puerto Rico 1105.87 1147.58 998.31 873.18 768.68 585.85 ---- 297.95 319.10 269.03 251.18 276.83 190.45
----CARIBBEAN 204.13 218.51 235.59 231.27 284.60 188.26 6.26 97.18 106.69 134.95 125.30 167.57 122.44 2.63 Anguilla 0.00 0.00 0.00 0.00 ---- ---- ---- 0.00 0.00 0.00 0.00 ---- ---- ----Antigua and Barbuda 421.39 517.00 450.25 159.92 159.08 158.31 ---- 31.72 31.65 63.06 62.75 249.84 62.19 ----Aruba ---- ---- ---- 520.71 ---- ---- ---- ---- ---- ---- 142.99 ---- ---- ----Bahamas 1215.38 1333.33 1540.74 1781.02 1568.35 1605.63 ---- 711.11 883.21 820.14 1028.17 1083.33 1095.24 ----Barbados 467.74 480.00 736.00 603.17 761.90 637.80 ---- 149.25 222.22 200.00 140.74 251.85 237.04 ----Cayman Islands 140.66 0.00 64.46 0.00 118.30 56.68 ---- 134.05 0.00 184.31 0.00 56.37 0.00 ----Dominica ---- 0.00 145.32 146.94 297.34 391.33 30.50 ---- 0.00 28.91 0.00 118.27 179.57 30.31 French Guiana 679.41 451.76 500.09 0.00 0.00 0.00 ---- 418.07 319.78 214.35 88.09 0.00 0.00 ----Grenada 20.93 353.64 61.97 287.00 223.65 60.46 ---- 0.00 65.57 87.53 87.52 152.92 21.78 ----Guadeloupe 171.72 0.00 0.00 0.00 0.00 ---- ---- 67.63 0.00 0.00 0.00 0.00 ---- ----Guyana 268.84 186.57 137.93 148.78 185.99 167.46 52.01 130.22 77.86 118.07 83.33 122.64 104.90 11.52 Jamaica 55.05 128.82 163.40 161.68 257.01 170.36 ---- 26.64 66.06 130.22 103.90 165.86 123.70 ----Martinique 171.53 169.64 214.95 139.97 179.43 ---- ---- 61.48 60.84 40.13 69.49 34.38 ---- ----Montserrat 0.00 0.00 0.00 0.00 0.00 0.00 ---- 0.00 155.45 0.00 0.00 0.00 0.00 ----Netherlands Antilles 0.00 0.00 ---- 0.00 ---- ---- ---- 0.00 0.00 ---- 0.00 ---- ---- ----Saint Kitts and Nevis 150.69 49.87 148.35 146.96 96.94 143.74 ---- 49.29 98.26 97.80 97.19 192.88 47.78 ----Saint Lucia 57.69 85.56 112.75 97.45 82.49 122.22 13.42 54.75 81.31 67.06 39.81 105.02 77.93 38.56 St. Vincent and the
Grenadines
70.23 86.92 155.02 85.40 169.44 134.50 ---- 17.24 51.41 68.13 16.94 33.71 134.21 ----Suriname 93.14 121.36 52.63 66.04 9.35 ---- ---- 43.48 47.62 42.45 27.91 0.00 ---- ----Trinidad and Tobago 274.22 278.52 262.92 264.71 400.58 108.85 ---- 129.91 92.91 151.67 148.27 220.23 69.47 ----Turks and Caicos Islands 638.98 1080.75 ---- ---- ---- ---- ---- 0.00 1051.05 ---- ---- ---- ---- ----Virgin Islands (UK) 161.06 0.00 157.18 310.41 0.00 453.79 ---- 157.58 311.38 0.00 151.88 0.00 0.00 146.0 5
NORTH AMERICA 477.14 461.01 407.99 372.91 302.68 214.19 ---- 83.75 93.91 90.37 89.59 81.65 62.70 ----Bermuda 404.08 400.94 1193.52 1019.90 424.46 356.46 ---- 163.85 97.54 258.11 544.28 127.10 63.07 ----Canada 113.17 112.82 106.85 94.54 55.39 15.97 ---- 7.87 8.54 9.27 8.84 6.95 2.58 ----United States of America 516.83 499.01 440.69 403.16 329.67 235.83 ---- 91.89 103.10 99.07 98.20 89.71 69.20 ----Virgin Islands (USA) 633.45 812.82 577.75 497.32 328.35 469.95 ---- 356.31 156.91 170.84 234.88 165.10 195.13 ----*Data are incomplete due to delayed reporting.
"---" Data not available by sex.
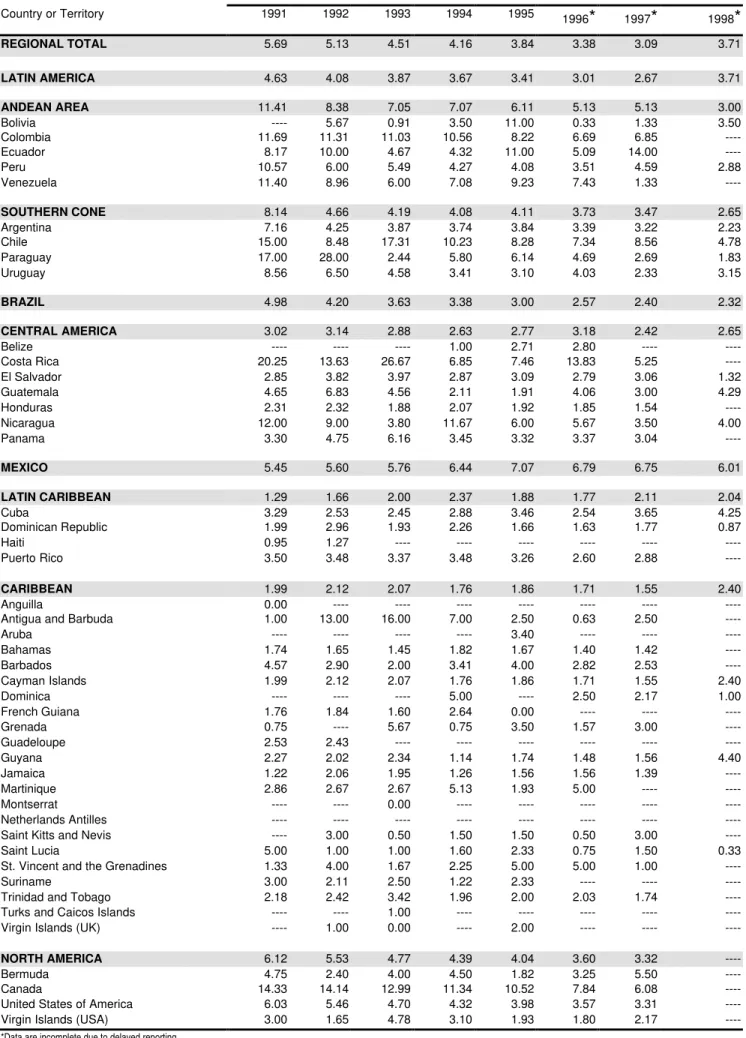
Table 4 Male-Female ration of reported AIDS cases, by country and year, 1991-1998n as of 31 August 1998.
SUBREGION Male-Female Ratio
Country or Territory 1991 1992 1993 1994 1995 1996
*
1997*
1998*
REGIONAL TOTAL 5.69 5.13 4.51 4.16 3.84 3.38 3.09 3.71
LATIN AMERICA 4.63 4.08 3.87 3.67 3.41 3.01 2.67 3.71
ANDEAN AREA 11.41 8.38 7.05 7.07 6.11 5.13 5.13 3.00 Bolivia ---- 5.67 0.91 3.50 11.00 0.33 1.33 3.50 Colombia 11.69 11.31 11.03 10.56 8.22 6.69 6.85 ----Ecuador 8.17 10.00 4.67 4.32 11.00 5.09 14.00 ----Peru 10.57 6.00 5.49 4.27 4.08 3.51 4.59 2.88 Venezuela 11.40 8.96 6.00 7.08 9.23 7.43 1.33
----SOUTHERN CONE 8.14 4.66 4.19 4.08 4.11 3.73 3.47 2.65 Argentina 7.16 4.25 3.87 3.74 3.84 3.39 3.22 2.23 Chile 15.00 8.48 17.31 10.23 8.28 7.34 8.56 4.78 Paraguay 17.00 28.00 2.44 5.80 6.14 4.69 2.69 1.83 Uruguay 8.56 6.50 4.58 3.41 3.10 4.03 2.33 3.15
BRAZIL 4.98 4.20 3.63 3.38 3.00 2.57 2.40 2.32
CENTRAL AMERICA 3.02 3.14 2.88 2.63 2.77 3.18 2.42 2.65 Belize ---- ---- ---- 1.00 2.71 2.80 ---- ----Costa Rica 20.25 13.63 26.67 6.85 7.46 13.83 5.25 ----El Salvador 2.85 3.82 3.97 2.87 3.09 2.79 3.06 1.32 Guatemala 4.65 6.83 4.56 2.11 1.91 4.06 3.00 4.29 Honduras 2.31 2.32 1.88 2.07 1.92 1.85 1.54 ----Nicaragua 12.00 9.00 3.80 11.67 6.00 5.67 3.50 4.00 Panama 3.30 4.75 6.16 3.45 3.32 3.37 3.04
----MEXICO 5.45 5.60 5.76 6.44 7.07 6.79 6.75 6.01
LATIN CARIBBEAN 1.29 1.66 2.00 2.37 1.88 1.77 2.11 2.04 Cuba 3.29 2.53 2.45 2.88 3.46 2.54 3.65 4.25 Dominican Republic 1.99 2.96 1.93 2.26 1.66 1.63 1.77 0.87 Haiti 0.95 1.27 ---- ---- ---- ---- ---- ----Puerto Rico 3.50 3.48 3.37 3.48 3.26 2.60 2.88
----CARIBBEAN 1.99 2.12 2.07 1.76 1.86 1.71 1.55 2.40 Anguilla 0.00 ---- ---- ---- ---- ---- ---- ----Antigua and Barbuda 1.00 13.00 16.00 7.00 2.50 0.63 2.50 ----Aruba ---- ---- ---- ---- 3.40 ---- ---- ----Bahamas 1.74 1.65 1.45 1.82 1.67 1.40 1.42 ----Barbados 4.57 2.90 2.00 3.41 4.00 2.82 2.53 ----Cayman Islands 1.99 2.12 2.07 1.76 1.86 1.71 1.55 2.40 Dominica ---- ---- ---- 5.00 ---- 2.50 2.17 1.00 French Guiana 1.76 1.84 1.60 2.64 0.00 ---- ---- ----Grenada 0.75 ---- 5.67 0.75 3.50 1.57 3.00 ----Guadeloupe 2.53 2.43 ---- ---- ---- ---- ---- ----Guyana 2.27 2.02 2.34 1.14 1.74 1.48 1.56 4.40 Jamaica 1.22 2.06 1.95 1.26 1.56 1.56 1.39 ----Martinique 2.86 2.67 2.67 5.13 1.93 5.00 ---- ----Montserrat ---- ---- 0.00 ---- ---- ---- ---- ----Netherlands Antilles ---- ---- ---- ---- ---- ---- ---- ----Saint Kitts and Nevis ---- 3.00 0.50 1.50 1.50 0.50 3.00 ----Saint Lucia 5.00 1.00 1.00 1.60 2.33 0.75 1.50 0.33 St. Vincent and the Grenadines 1.33 4.00 1.67 2.25 5.00 5.00 1.00 ----Suriname 3.00 2.11 2.50 1.22 2.33 ---- ---- ----Trinidad and Tobago 2.18 2.42 3.42 1.96 2.00 2.03 1.74 ----Turks and Caicos Islands ---- ---- 1.00 ---- ---- ---- ---- ----Virgin Islands (UK) ---- 1.00 0.00 ---- 2.00 ---- ----
----NORTH AMERICA 6.12 5.53 4.77 4.39 4.04 3.60 3.32 ----Bermuda 4.75 2.40 4.00 4.50 1.82 3.25 5.50 ----Canada 14.33 14.14 12.99 11.34 10.52 7.84 6.08 ----United States of America 6.03 5.46 4.70 4.32 3.98 3.57 3.31 ----Virgin Islands (USA) 3.00 1.65 4.78 3.10 1.93 1.80 2.17
----*Data are incomplete due to delayed reporting.
"---" Data not available by sex there are not cases reported in females.
Table 5. Total cases, pediatric cases, percent of pediatric cases from total; perinatal cases, and percent of perinatal cases from total pediatric, by subregion
and country, cumulative to 31 August 1998.
SUBREGION Country or Territory
TOTAL CASES
PEDIATRIC CASES
PERCENT PEDIATRIC
PERINATAL CASES
PERCENT PERINATAL
REGIONAL TOTAL 915,858 16,820 1.83 13,930 82.82
LATIN AMERICA 243,834 8,583 3.49 6,323 73.67
ANDEAN AREA 23,846 343 1.21 285 83.09
Bolivia 179 6 3.35 6 100.00
Colombia 8,433 150 1.13 150 100.00
Ecuador 625 8 1.28 6 75.00
Peru 7,331 117 1.60 91 77.78
Venezuela 7,278 62 0.85 32 51.61
SOUTHERN CONE 17,087 1,156 6.77 1,019 88.15
Argentina 13,113 1,022 7.79 916 89.63
Chile 2,431 48 1.97 41 85.42
Paraguay 424 18 4.25 15 83.33
Uruguay 1,119 68 6.08 47 69.12
BRAZIL 128,821 4,691 3.64 3,492 74.44
CENTRAL AMERICA 16,337 470 2.88 392 83.40
Belize 198 5 2.53 5 100.00
Costa Rica 1,383 26 1.88 15 57.69
El Salvador 2,344 78 3.33 60 76.92
Guatemala 2,395 62 2.59 36 58.06
Honduras 8,217 222 2.70 209 94.14
Nicaragua 180 2 1.11 2 100.00
Panama 1,620 75 4.63 65 86.67
MEXICO 35,069 852 2.43 381 44.72
LATIN CARIBBEAN (a) 9,940 363 3.65 108 29.75
Cuba 743 4 0.54 4 100.00
Dominican Republic 4,230 146 3.45 88 60.27
Haiti 4,967 213 4.29 16 7.51
Puerto Rico 21,266 373 1.75 354 94.91
CARIBBEAN 12,734 708 5.47 646 91.24
Anguilla 5 0 0.00 0
----Antigua and Barbuda 91 6 4.40 6 100.00
Aruba 24 0 0.00 0
----Bahamas 2,864 214 7.44 214 100.47
Barbados 875 43 4.91 38 88.37
Cayman Islands 22 1 4.55 0 0.00
Dominica 72 5 4.17 5 100.00
French Guiana 641 0 0.00 40
----Grenada 103 7 6.80 6 85.71
Guadeloupe 790 0 0.00 0
----Guyana 984 29 2.95 23 79.31
Jamaica 2,430 178 7.33 146 82.02
Martinique 436 12 1.15 12 100.00
Montserrat 7 0 0.00 0
----Netherlands Antilles 233 1 0.43 1 100.00 Saint Kitts and Nevis 58 1 1.72 1 100.00
Saint Lucia 109 10 9.17 10 100.00
St. Vincent and the Grenadines 111 6 5.41 6 100.00
Suriname 211 7 3.32 7 100.00
Trinidad and Tobago 2,613 186 7.12 130 69.89 Turks and Caicos Islands 39 0 0.00 0 ----Virgin Islands (UK) 16 2 12.50 1 50.00
NORTH AMERICA 672,024 8,237 1.23 7,607 92.35
Bermuda 335 2 0.60 2 100.00
Canada 15,528 0 0.00 133
----United States of America 656,161 8,235 1.26 7,472 90.73 Virgin Islands (USA) 385 14 3.64 12 85.71
AIDS Surveillance in the Americas
September, 1998
g
g
Total cumulative AIDS cases in the Andean Area: 23,846
g
g
Percent distribution of total cumulative AIDS cases by exposure category, Andean Area,
August 31, 1998
.7%
31.9%
1.1%
.4%
.4%
24.7%
40.8%
Other risk factor
Unknown
Blood transfusion
Hemophilia/coagulat.
Injecting drug use
Heterosexual
Homo-bisexual
g
g
Number of AIDS cases diagnosed in the Andean Area, 1983-1998, by year
Year
1998 1997 1996 1995 1994 1993 1992 1991 1990 1989 1988 1987 1986 1985 1984 1983
Cases
1400 1200 1000 800 600 400 200 0
AIDS Surveillance in the Americas
September, 1998
g
g
Total cumulative AIDS cases in Brazil: 128,821
g
g
Percent distribution of total cumulative AIDS cases by exposure category, Brazil, August 31,
1998
2.7%
19.3%
2.9%
.8%
21.0%
21.2%
32.1%
Perinatal
Unknown
Blood transfusion
Hemophilia/coagulat.
Injecting drug use
Heterosexual
Homo-bisexual
g
g
Number of AIDS cases diagnosed in Brazil, 1980-1997, by year
Year
1997
1996
1995
1994
1993
1992
1991
1990
1989
1988
1987
1986
1985
1984
1983
1982
1981
1980
Cases
6000
5000
4000
3000
2000
1000
0
Homo-bisexual
Heterosexual
Injecting drug use
AIDS Surveillance in the Americas
September, 1998
g
g
Total cumulative AIDS cases in the Caribbean: 12,734
g
g
Percent distribution of total cumulative AIDS cases by exposure category, Caribbean,
August 31, 1998
5.2%
25.4%
.4%
.1%
.5%
58.9%
9.6%
Perinatal
Unknown
Blood transfusion
Hemophilia/coag.
Injecting drug use
Heterosexual
Homo-bisexual
g
g
Number of AIDS cases diagnosed in the Caribbean, 1981-1997, by year
Year
1997 1996 1995 1994 1993 1992 1991 1990 1989 1988 1987 1986 1985 1984 1983 1982 1981
Cases
1400 1200 1000 800 600 400 200 0
AIDS Surveillance in the Americas
September, 1998
g
g
Total cumulative AIDS cases in Central America: 16,337
g
g
Percent distribution of total cumulative AIDS cases by exposure category, Central America,
August 31, 1998
3.3%
18.7%
1.0%
.5%
.9%
56.0%
19.7%
Perinatal
Unknown
Blood transfusion
Hemophilia/coagulat.
Injecting drug use
Heterosexual
Homo-bisexual
g
g
Number of AIDS cases diagnosed in Central America, 1983-1998, by year
Year
1998 1997 1996 1995 1994 1993 1992 1991 1990 1989 1988 1987 1986 1985 1984 1983
Cases
1400 1200 1000 800 600 400 200 0
AIDS Surveillance in the Americas
September, 1998
g
g
Total cumulative AIDS cases in the Latin Caribbean: 9,940
g
g
Percent distribution of total cumulative AIDS cases by exposure category, Latin Caribbean,
August 31, 1998
1.6%
15.3%
1.8%
.3%
37.4%
29.3%
14.2%
Perinatal
Unknown
Blood transfusion
Hemophilia/coagulat.
Injecting drug use
Heterosexual
Homo-bisexual
g
g
Number of AIDS cases diagnosed in the Latin Caribbean, 1981-1998, by year
Year
1998
1997
1996
1995
1994
1993
1992
1991
1990
1989
1988
1987
1986
1985
1984
1983
1982
1981
Cases
1600
1400
1200
1000
800
600
400
200
0
Homo-bisexual
Heterosexual
Injecting drug use
AIDS Surveillance in the Americas
September, 1998
g
g
Total cumulative AIDS cases in Mexico: 35,069
g
g
Percent distribution of total cumulative AIDS cases by exposure category, Mexico, August
31, 1998
1.2% 29.5% 7.5% .8% .7%
20.4%
40.0%
Perinatal Unknown Blood transfusion Hemophilia/coagulat.
Injecting drug use
Heterosexual
Homo-bisexual
g
g
Number of AIDS cases diagnosed in Mexico, 1982-1998, by year
Year
1998 1997 1996 1995 1994 1993 1992 1991 1990 1989 1988 1987 1986 1985 1984 1983
Cases
3000
2500
2000
1500
1000
500
0
AIDS Surveillance in the Americas
September, 1998
g
g
Total cumulative AIDS cases in North America: 672,024
g
g
Percent distribution of total cumulative AIDS cases by exposure category, North America,
August 31, 1998
1.2% 8.2% 1.4% .8% 26.6%
10.0%
51.8%
Perinatal Unknown Blood transfusion Hemophilia/coagulat. Injecting drug use
Heterosexual
Homo-bisexual
g
g
Number of AIDS cases diagnosed in North America, 1980-1998, by year
Year
1997
1996
1995
1994
1993
1992
1991
1990
1989
1988
1987
1986
1985
1984
1983
1982
1981
1980
Cases
50000
45000
40000
35000
30000
25000
20000
15000
10000
5000
0
Homo-bisexual
Heterosexual
Injecting drug use
Unknown
AIDS Surveillance in the Americas
September, 1998
g
g
Total cumulative AIDS cases in the Southern Cone: 17,087
g
g
Percent distribution of total cumulative AIDS cases by exposure category, Southern Cone,
August 31, 1998
5.9%
3.9%
1.4%
1.1%
34.6%
20.0%
33.1%
Perinatal
Unknown
Blood transfusion
Hemophilia/coagulat.
Injecting drug use
Heterosexual
Homo-bisexual
g
g
Number of AIDS cases diagnosed in the Southern Cone, 1983-1998, by year
Year
1998 1997 1996 1995 1994 1993 1992 1991 1990 1989 1988 1987 1986 1985 1984 1983 1982
Cases
1200
1000
800
600
400
200 0
AIDS Surveillance in the Americas
September, 1998
g
g
Annual incidence of AIDS cases by Subregion
Americas
Year 1998 1997 1996 1995 1994 1993 1992 1991 1990 1989 1988 1987 1986 1985 1984 1983 1982 1981 1980 1979 Cases 120000 100000 80000 60000 40000 20000 0Latin America and the Caribbean
Year 1998 1997 1996 1995 1994 1993 1992 1991 1990 1989 1988 1987 1986 1985 1984 1983 1982 1981 1980 Cases 40000 35000 30000 25000 20000 15000 10000 5000 0