Treball de Final de Grau/Màster / Trabajo de Final de Grado/Màster
TÍTOL /
TÍTULO/ TITLE
WebGIS applied to improve spatial Knowledge of High School
Students
Autor/a
/ Autor/a/ Author: María del Pilar Reyes Careaga
Director/a
/ Director/a/ Supervisor:
Óscar Belmonte Fernández
Tutor/a o supervisor/a /
Tutor/a o supervisor/a/ Co-supervisors:
Thomas Bartoschek, Marco Painho
Data de lectura
/ Fecha de lectura/ Date of Thesis Defense:
Resum
/ Resumen/ Abstract:
This research seeks to design and implement a WebGIS application allowing high school students to work with information related to the disciplinary competencies of the competency-teaching model, in Mexico. This paradigm assumes knowledge to be acquired through the application of new technologies and to link it with everyday life situations of students. The WebGIS provides access to maps regarding natural risks in Mexico, e.g. volcanism, seismic activities, or hurricanes; the prototype's user interface was designed with special emphasis on scholar needs for high school students.
Paraules clau
/ Palabras clave/ Key words:
WebGIS applied to improve spatial Knowledge of
High School Students
WebGIS applied to improve spatial
Knowledge of High School Students
Dissertation supervised by
PhD Óscar Belmonte Fernández
PhD Thomas Bartoschek
PhD Marco Painho
Acknowledgments
I would like to thank the Erasmus Mundus Program for the valuable opportunity
to let me study the Masters Program in Geospatial Technologies.
I want to thank the three professors, Óscar Belmonte Fernández,
Thomas Bartoschek and Marco Painho
who have guided me in this work
with their punctual suggestions to improve this thesis.
I feel grateful with all the professors of the Master. I have learned a lot from you
in these three semesters, as well as from the directors that make the program
possible. Thank you to all of you.
I appreciate my family’s
support
WebGIS applied to improve spatial Knowledge of High
School Students
ABSTRACT
KEYWORDS
ArcGIS API for JavaScript
Mexican competencies in high school
Natural risks
Usability for teenagers
ACRONYMS
AJAX Asynchronous JavaScript And XML
ANUIES Asociación Nacional de Universidades e Instituciones de Educación Superior (National Association of Universities and Institutions of Higher Education) API Application Programming Interface
CCA Centro de Ciencias de la Atmosfera (Atmosphere Sciences Centre)
CENAPRED Centro Nacional de Prevención de Desastres (National Prevention of Disasters Centre) CFE Comisión Federal de Electricidad (Federal Electricity Commission)
CONAPO Consejo Nacional de Población (National Population Council) CSS Cascading Style Sheets
DOM Document Object Model
EDUSAT Educación Satelital (Satellite Education) ESRI Enviromental Systems Research Institute GIS Geographic Information System
GUI Graphical User Interface
HCI Human Computer Interface
HMTL HyperText Markup Language HTTP Hypertext Transfer Protocol IIS Internet Information Services
ILCE Instituto Latinoamericano de la Comunicación Educativa (Latin-American of Educative Education Institute)
INEGI Instituto Nacional de Estadística y Geografía (National Geographic and Statistical Institute)
IRIS Información Referenciada geoespacialmente Integrada en un Sistema (Referenced geospatially Integrated Information System) ISO Internacional Organization for Standardization
JSAPI JavaScript-Application Programming Interface JSON JavaScript Object Notation
MODUTIH Módulo sobre Disponibilidad y Uso de las Tecnologías de la Información en los Hogares (Houses information of Use technology Available Module) OGC Open Geospatial Consortium
INDEX
Acknowledgements
Abstract
Keywords
Acronyms
1.
Introduction ... 5
Organization of the thesis ... 6
1.1.
2.
Methodology ... 8
3.
Background ... 11
The paradigm of competencies ... 11
3.1. Gis for education ... 14
3.2. Usability of WebGIS for teenagers ... 15
3.3.
4.
WebGIS ... 18
General concept and usage ... 18
4.1. Architecture ... 19
4.2. Webgis client technologies ... 20
4.3. WebGIS frameworks: ArcGIS ... 21
4.4. 4.4.1. Components ... 22
4.4.1.1. Transparency ... 22
4.4.1.2. Storytelling swipe ... 22
4.4.1.3. Storytelling compare ... 23
4.4.1.4. Search by name ... 23
5.
WebGIS for education ... 24
Infrastructure for using WebGIS at Mexican schools ... 25
5.1.
6.
Natural Risks in Mexico ... 30
Metadata of the risk maps ... 31
6.1. Gaia WMS ... 33
6.2.
7.
Design of the prototype ... 35
Requirements ... 35
7.1. 7.1.1. Teaching involvement with WebGIS ... 35
7.1.2. Spatial analysis in high schools using WebGIS ... 35
Use Cases ... 37
7.2. User interface and functionalities ... 39
7.3.
8.
Implementation ... 42
Map service ... 42
8.1. Implementation of the WebGIS ... 44
8.2. 8.2.1. HTML ... 44
8.2.2. Java script ... 44
8.2.2.1. Map ... 45
8.2.2.2. Transparency ... 45
8.2.2.3. Dialog ... 46
8.2.2.4. About (Acerca de) ... 47
8.2.2.5. Search ... 48
8.2.2.6. Radio buttons ... 48
INDEX OF FIGURES
Fig. 1.- The Mexican paradigm of Competencies in high school ... 13
Fig. 2.- Usability guidelines for teens ... 16
Fig. 3.- Architecture od WebGIS, the server and the client communicate via HTTP ... 19
Fig. 4.- German WerbGIS. Landschaftsverband Westfalen-Lippe ... 24
Fig. 5.- Education System in Mexico ... 26
Fig. 6.- Atmosphere Sciences Centre WebGIS , UNAM ... 29
Fig. 7.- Natural risk in Mexico 1970-2009 ... 30
Fig. 8.- Metadata CENAPRED, INEGI, CONAPO ... 31
Fig. 9.- Metadata CENAPRED, INEGI ... 32
Fig. 10.- Work flow diagram of creating the maps. ArcMap Project ... 32
Fig. 11.- GAIA, INEGI Web Map Service... 34
Fig. 12.- Design of Prototype for education ... 40
Fig. 13.- Process in ArcGIS desktop, for the .mxd project ... 42
Fig. 14.- Process in Molder builder ... 42
Fig. 15.- Process in Molder builder ... 43
Fig. 16.- Process in Molder builder for the buffer ... 44
Fig. 17.- Map or canvas ... 45
Fig. 18.- Transparency... 46
Fig. 19.- Dialog ... 47
Fig. 20.- About (Acerca de) ... 48
Fig. 21.- Radio Button ... 49
Fig. 22.- Storytelling Swipe ... 50
INDEX OF GRAPHICS
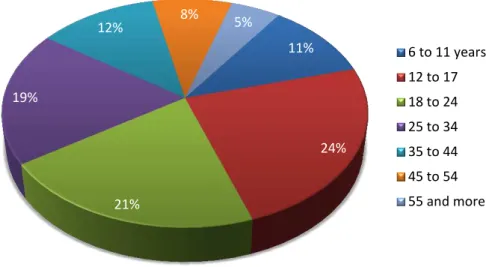
Graphic 1 Internet users by age groups in Mexico ... 27
Graphic 2 Internet users by studies level ... 27
Graphic 3 Increase of internet users in the last decade in Mexico ... 28
1. INTRODUCTION
The Secretary of Public Education (SEP) and the Sub-secretary of High School Education (SEMS) have adopted the competencies paradigm in the design and content of the syllabus at high school level. The new paradigm of education in the high school system was introduced in Mexico in 2009. The model of competencies has six basic objectives, and one of them includes using new technologies by linking them with everyday life situations [31]. WebGIS applications constitute a good example for such new technologies. Several authors, e.g. [7], [5] and [20], write about using GIS at school. [20] presents studies on using GIS at school. The results show that GIS is an effective tool for learning.
However, until now a WebGIS providing information, which is incorporating the requirements of the Mexican academic system, is missing. Especially, there is no application about natural risks and their prevention.
The aim of this work is to investigate the feasibility of implementing a WebGIS to be used in Mexican high schools, to improve spatial education focused on Mexican natural risks by providing a simple user interface using free accessible web technologies.
In order to achieve the aim of this research, first it is identified how a WebGIS can fit to the competencies paradigm in Mexico, of special importance is the question of how it can be used in a way that makes students familiar with relevant scientific as well as technical knowledge.
In the next step existing GIS technologies are investigated to get a better understanding of the technical background, with special emphasis to WebGIS.
It is Important for this work to know if students can improve their spatial knowledge when GIS tools are used for learning and how it is possible to link spatial information
with the student’s daily life.
The most relevant natural risks present in Mexico have to be identified. Natural phenomena that occur frequently and may provoke economic and human losses need to be selected as content for the WebGIS to be developed.
The typical necessities of high school students need to be identified. Focusing on the objective to develop an application that can be understood by the students without further help, but at the same time forces both, teachers and students to interchange feedback, knowledge and opinions about how they can avoid to be exposed to natural risks along Mexico.
The application’s user interface should be designed in a way that considers the
necessities of teenagers and enforces them to discover the application’s functions
and new knowledge on their own by surfing through the graphical interface.
Based on the academic requirements as well as taking into account the needs of high school students in terms of usability, a WebGIS is designed and prototypically implemented to provide its users with information on the most relevant natural risks present in Mexico as identified before.
O
RGANIZATION OF THE THESIS
1.1.
The research has 10 chapters: Introduction, Methodology, Background, WebGIS, WebGIS for Education, Natural Risk in Mexico, Design of the prototype, Implementation, Conclusion and further work and References.
WebGIS describes the uses and ordinary contents of a WebGIS, the architecture, WebGIS client technologies, WebGIS frameworks: ArcGIS.
WebGIS for Education: Describes examples of WebGIS uses in some countries, infrastructures for using WebGIS at Mexican schools.
Natural Risks in Mexico: Describes the metadata of natural risks that affect Mexico from the National Disasters Centre, explains the Work flow process of creating the maps and describes the GAIA WMS.
Design of the prototype explains the teaching involvement with WebGIS spatial analysis in high schools using WebGIS, describes the use cases and also the user interface and functionalities.
Implementation explains all the components that make the WebGIS application using some technologies just to conform the application using the risk maps in Mexico such as map service and the implementation of the WebGIS.
Conclusion and further work explains the goals of this thesis, the summary about the process, final results and the further work using these technologies in Mexico.
2. METHODOLOGY
The first step of this research is to identify how a WebGIS can fit to the competencies paradigm in Mexico. The content of the Mexican competencies paradigm is reviewed. The requirements for this new education paradigm are investigated to find out which parts are relevant for the usage of new technologies. Of special relevance for this work is the paragraph stating that students should be able to identify factors and elements of physical risks that take place in nature and which alter life quality, so that they can suggest preventive tasks [31]. Moreover, it is necessary to find out how new technologies should be included in lessons according the paradigm, and how to help students to improve their technological, but also generic competencies [31].
To gain a fundamental understanding of existing GIS technologies, existing technologies are reviewed. One goal in this part of the work is to find potentially suitable technical means to realize the desired WebGIS application. To do so, first typical usages and functions as well as contents of GIS and WebGIS are searched for. This is followed by studying the general architecture and the most important components of such systems and an introduction to ArcGIS server and the ArcGIS JavaScript API, since they constitute the most popular and wide-spread platform for the development of GIS systems.
The generic competency for high school education requires to “select, analyze,
evaluate and share information from different sources and to use technological
But for Mexico this is still a new topic. However, teachers believe that GIS are a great way to implement education reforms [21]. Since Mexico just recently introduced a new education paradigm, there is an interest in developing a prototype for Mexico. To find out if using WebGIS in classes in Mexican schools is a feasible option, the local technical infrastructure has to be considered. Based on this, it can be decided if it is possible to develop an application that can be used in a majority of schools.
Similarly to the United States, Australia and South and Southeast Asia, Mexico is a country particularly prone to disasters [15]. It is exposed to a comparably large number of natural risks. To identify the most relevant types of risks, statistics are analyzed. Risks occurring with a high frequency and constituting a source of economic and human damages and loses are chosen to be desirable content for the application. Often a lag of knowledge on how to behave in a certain situation of exposition to dangerous natural phenomena is a reason for escalation. It is assumed that with growing knowledge and distribution of information on these topics, the potential harm will decrease.
Since the application to be developed in this work aims to address teenage-users, their characteristic abilities and requirements need to be considered for the design. It is desirable that the application can be understood in an intuitive way by the targeted group of users. Moreover, students, but also teachers should be encouraged to exchange feedback, share knowledge or start discussions. Using the application may serve as starting point for topics such as historical natural catastrophes, e.g. hurricanes or earthquakes. Also, related geological or meteorological subjects may be explained with the help of a WebGIS application.
The graphical user interface needs to address the specific needs of teenagers. Studies about usability requirements of the target group need to be reviewed and their results applied to the considerations of this work. It is intended to provide a work flow that can be learned by teenagers without additional instructions. Shape, colors, distribution, size and general appearance need to be attractive for the students.
3. BACKGROUND
The use of maps, atlases, globes and more recently remote sensing has always been an important part of high school curricula, particularly in the subjects of geography, history and science. Maps not only help students to learn about their world, they also help students to develop spatial and problem solving skills [2].
The Geography for Life: National Geography Standard, a well-used document for geography curricula, stresses the use of these resource in the classroom because
“knowing how to identify, access, evaluate and use all these resources will ensure students a rich experience, and the prospect of having an effective array of problem-solving and decision-making skills for use both their educational pursuits and their adult years” [1].
Geographical education is the key to geographic competency. To achieve geographic understanding on a national scale requires a concerted effort by the educational system to ensure that all students receive a basic education in geography [13].
In America there are two national geography standards. First, geographic understanding must be set into a process of lifelong learning. There is an inseparable and seamless connection between formal educational contexts preschool, K-12, college and adult life. Second, geographic understanding must be set into life contexts: school, family, society, and occupation [44].
T
HE PARADIGM OF COMPETENCIES
3.1.
The General Direction of High Schools has a syllabus in the context of an integral reform of the high school education in Mexico. It is a collaborative work oriented to the permanent research of learning, considering psychological and pedagogical features. The main philosophy to be followed is based on the scientific, technological, and humanistic disciplines [31].
Among the skills to be developed you can find the learning and development of skills in the use of information technologies. Currently there is a big quantity of available information, in which the interest does not only point in storing and communicating data, but also in using the information and turning it into knowledge. It is then mandatory to choose strategies for the cognitive development of the teenagers that can represent a support in their daily learning.
From the school cycle 2009-2010, the Integral Reform of the High school introduces the teaching system based on the development of competencies, which serves as a support to the constructivist paradigm. Some adjustments were done, in the teachers profile to focus on some education quality standards.
The structure of the syllabus, as noted in [31], has different links with different learning paradigms of learning; one is the meaningful learning, which is a proposal in real school contexts, where learning does not incorporate to the cognitive structure of the students arbitrarily, but linking previous knowledge.
In the integral evaluation process there is the authentic evaluation that considers
some features of the students’ performance, such as: daily procedures of learning in the classroom, the compilation of evidences, diverse activities, and the feedback among students.
The Mexican paradigm of Competencies in high school
Fig.
1.-The basic competencies refer to the knowledge, skills and attitudes needed in each discipline like mathematics, experimental sciences, social sciences and humanities, and communication. The extended competencies are more specific inside the field of the knowledge, since each area develops its own knowledge, skills and attitudes that the students will develop in each field of knowledge, (Figure 1).
Inside the main aims of the competencies paradigm, the knowledge acquired by students are linked with their daily life, which clarifies the route, through the link with other signatures, so that they develop the capacity to articulate learning of diverse sources, and know how to integrate them.
The link with different areas is needed because knowledge should not be isolated but integrated to disciplines. It also must be vertical when adding previous knowledge. This paradigm is found from the basic level until high school [28].
About the generic competencies, students will be able to:
Start identifying risks in their daily life, since it is a reality that people live with throughout the year Mexico.
Transversality
Identify the distribution and temporality of some natural phenomena that are cyclic and predictable like the frosts, hurricanes, electrical storms, hailstorms and droughts.
Identify the distribution of the phenomena that are not cyclic but that can be predictable through a constant monitoring, like volcanism.
Identify the distribution of the phenomena that can be cyclic but unpredictable, like earthquakes.
Develop their own plan of prevention: they will be able to extend it and to raise collective awareness in their communities.
Keep all the learning evidences in a portfolio, highlighting the most important events, as well as the plans of civil defense for each case.
G
IS FOR EDUCATION
3.2.
A study about the usability of WebGIS can be found in [8]. It shows a comparison of different users of a WebGIS designed for education in Germany. The participating students were observed while using a WebGIS application. Based on the results a new WebGIS was developed.
Some teachers consider GIS as one of the most promising ways to implement education reforms. For example [18] thinks that interdisciplinary education might be more useful in order to help students solve problems, instead of teaching each signature isolated.
Taking into account the interviewed teachers in [20], in high school of USA, 88% (n=342) believed that the use of GIS makes a meaningful contribution to learning.
The teachers (n=376) that mostly use GIS in classes are the ones of sciences (36%) and geography (17%), according to data in [21]. The author has been noted some disadvantages such as slow way to implement the GIS, the extension of curricula and the effectiveness to teach the software was not clear.
In Mexico, GIS applications in schools might be useful if they offer information about ordinary topics like natural risks, which is one of the most typical topics in the country. The effects of certain natural risks can be observed cyclically in different parts of Mexico. They include human and material losses. However, there is a lack of knowledge about natural risks, e.g. about distribution or affectation level.
The WebGIS is not a support system as i.e. the calculator is for mathematics. GIS has big difficulties to be accepted by the majority of teachers as part of their toolkit for good and efficient teaching [7]. We might need to wait more time to see this technology becoming more widespread. GIS technologies have been adopted by less than 1% of American high schools. The reasons are the slow implementation, the coverage in the curriculum, and the lack of teaching effectiveness [20].
With a WebGIS, students could use and learn through the use of new technologies, since it is one of the goals of the generic competencies in Mexico. It will allow students to know risks maps, and they will make association and comparison easier when using the interface. Students will be able to fulfill their analysis by having access to GAIA1 maps from the WMS (Web Map Service) of INEGI (National
Geographic and Statistical Institute).
U
SABILITY OF
W
EB
GIS
FOR TEENAGERS
3.3.
User needs to use Web-based interfaces to complete daily tasks, thus accessibility, a universal design, and security matters are part of HCI implementations [16].
It is remarkable to think about the components of the usability in the interface and to think about the utility of the application. Teenagers as users are prey of stereotypes that do not correspond with reality.
Some observations that [23] recommends to be taken into account, in the construction of the interface for 13-to-17-yearl-old users are:
Like adults, teens are goal-oriented and do not surf the Web aimlessly.
Teens find the greatest challenges on large sites, with dense content and poor navigation schemes.
Teenagers do not like to read a lot on the Web.
Teenagers dislike tiny font sizes as much as adults do.
Teenagers have a strong appreciation for aesthetics.
Teenagers hate sites that appear cluttered and contain pointless multimedia.
It is a difficult sector because sometimes it is difficult to keep their attention. In Figure 2, it can be seen the level of satisfaction of the users it can be seen, when they use the web. The author [23] shows that in terms of usability, (Figure 1) Usability guidelines for teen’s happy face that means “enjoyable, interesting, and appealing, or users can easily adjust to it” is absent, as the expectation of the
having levels of difficulty in the creation of the interface, which in terms of usability, the success or failure is known until tested. A subject that Nielsen also tackles in one of his articles of usability is about how people learn, without considering the ranks of ages or the gender, but by only considering the geographic regions, which is a topic that should be explorer in depth.
The prototype ‘WebGIS Educational” of [8], in the study of usability, considers the number of clicks to complete each task. The design of the application focuses on adapting the appearances of engineering of usability, as suggests [23]. The map is shown taking advantage of all the space of the interface. The testing of the system was carried out by 10 students, and the tasks were performed out loud. The WebGIS was programmed to be intuitive, interactive and explored by the students.
Some users that tested the WebGIS suggested no to have folding menus that are initially closed, since some of them got lost in the elements of the interface. The mouse-over help icons were a success, as well as the split mode to compare maps. Most of them liked the size of the buttons. Regarding the symbols, some students found them confusion while others liked them [8].
4.
W
EB
GIS
G
ENERAL CONCEPT AND USAGE
4.1.
A WebGIS is a special form of GIS. As such it can provide means to visualize, analyze, edit, collect or process spatial data. However opposing to desktop GIS applications, WebGIS work with geodata accessed through the internet. WebGIS clients are web applications that are executed on web browsers. Typically they visualize geospatial data on a map. Additionally, they can offer access to relevant spatial information by means of charts or dynamic diagrams and other graphic representation forms.
The range of possible functionalities provided by WebGIS is wide. Prominent examples of WebGIS functionalities are panning, zooming or searching. Nevertheless, more complex and more specialized operations, such as geoprocessing are possible too. With such technical capabilities WebGIS can serve as a guide to find places of interest, provide multipoint driving directions. The user can have the choice between image and vector-based maps and has the ability to create mash ups by overlaying other datasets [22].
One of the biggest advantages of WebGIS is accessibility. Since WebGIS clients can run on web browsers, they do not require a local installation. Moreover, theoretically, they can run on almost any device with internet connection. This includes desktop computers, notebooks, tablets and smartphones.
A
RCHITECTURE
4.2.
A WebGIS is a distributed information system, as shown in Figure 3. A simple form of a WebGIS consists of a server and at least one client. The server is responsible for storing the data and to publish it in form of geoinformation services, such as web map services (WMS). The client provides the interface between the WebGIS and the user. Clients can be web browser clients, desktop clients, but also mobile clients (Figure 3).
Architecture od WebGIS, the server and the client communicate via HTTP
Fig.
The use of a client-server architecture has several advantages. One of them is that the access control can be centralized. If the server detects any irregularity in the request, it does not authorize it. This way the system is more secure. Another advantage is that both, client and server can be scalable. Their capacity can be increased in any time by adding additional nodes. Furthermore, the maintenance of the system is facilitated. A disadvantage comes from the characteristic of being a distributed system. The potentially high traffic caused by simultaneous requests of clients may result in a slower execution of certain tasks, in comparison to desktop GIS.
W
EBGIS CLIENT TECHNOLOGIES
4.3.
The most important technologies for WebGIS client development are basically the same as for regular web applications. In the following part of this work HTML, JavaScript and CSS are introduced to the reader, since, combined, they allow for
JavaScript is a programming language that can be directly interpreted in web browsers. For this reason it does not need to be compiled and no additional software needs to be installed.
JavaScript consists of objects encapsulating sets of properties and functions. Properties can either contain values consisting of primitives such as integer or boolean, or they can contain references to other objects. However, in JavaScript all data types are handled in the same way and opposing to other programming languages the type does not need to be set explicitly. Object classes can be declared to describe the properties and functions of certain objects. They have a Constructor, a function with the special purpose to create a new instance of a class. Constructors can be used to pass parameters to a new object.
CSS is a language of waterfall style. It is used to refine the appearance of HTML documents. Style classes can be defined inside a CSS file, and assigned to HTML elements. The rules defined inside of one CSS class control properties such as font type or size, color, padding or other visual characteristics.
W
EB
GIS
FRAMEWORKS
:
A
RC
GIS
4.4.
To ease the development of WebGIS, but also to provide users with well-known user interface components [32] a large number of frameworks providing predefined components and sets of utilities necessary for WebGIS development has evolved [2]. One example constitutes ArcGIS server and the ArcGIS JavaScript API (ArcGIS JSAPI) from ESRI.
ArcGIS server is a server GIS software. It allows to prepare and publish geospatial data as map services and to create geoprocessing services. The services can be accessed through a REST API by WebGIS clients.
performing queries to web services, finding tasks or requests to geoprocessing services are provided.
It is built on top of the Dojo2 framework and there is a tight integration between the
two of them. The core of Dojo is the basis of all ArcGIS JSAPI projects. It is capable of performing various tasks such as fixing browser incompatibilities, DOM manipulation, drag and drop, data storing or cookie management. It takes care of various relevant low level functions.
Dijit is the part of Dojo providing graphical user interface components (widgets), e.g. Buttons, text boxes, color pickers or sliders. Dijits can be created in two ways, declaratively using HTML tags, or programmatically through JavaScript.
4.4.1.
C
OMPONENTSIn the ESRI website we can find some of the WebGIS components, which are useful to design a WebGIS to scholar interest.
4.4.1.1.
Transparency
The transparency is an interactive application that comprises a percentage that goes from 0 to 100%, which allows, depending on the need of the user, to visualize the layer that is below. It is a merely visual question that allows the observation of two simultaneous overlapped layers, without losing information one of the other.
4.4.1.3.
Storytelling compare
This is an application that allows dividing the screen in two, so that two maps of different topics can be seen, at the same time. This means that the requests of visualization requested in the first map will be simultaneously applied to the second map, so that this link allows the almost immediate comparison of the two maps.
4.4.1.4.
Search by name
It is the application to do the research of the places through the name, which allows the user deploy the names and the location in the thematic map in question, in order to improve the research of the places of interest, for a better location.
4.4.1.5.
Geoprocess
It is the most complex application of interactivity of the WebGIS services GIS. The Geo-processing can range from a simple analysis up to several complex analyses. The availability of this tool is one of the strengths of the WebGIS application.
4.4.1.6.
Statistic
5. WEBGIS FOR EDUCATION
While in Mexico this is a new topic, WebGIS for educational purposes is already well investigated for other countries, e.g. Germany and USA.
In Germany the term WebGIS used in an educational context describes web applications providing features like map navigation, map design and simple SQL queries in thematic maps based on curricular content [7], (Figure 4).
German WerbGIS. Landschaftsverband Westfalen-Lippe3 Fig.
resources. Through the WebGIS the students were encouraged to support their position with maps, charts, images and tables [2].
WebGIS and other cloud-based tools can improve a students’ basic geographical
knowledge. The infusion of WebGIS can supply meaningful contexts for expanding
students’ spatial thinking, decision-making, problem-solving, and critical thinking abilities [2].
WebGIS offers different services through internet. Thus an increasing number of users can access this type of technologies. There is an interest for carrying them to distinct areas of knowledge, especially in education. The interest lies in the case of Mexico, in face to the new educational changes in which technologies for teaching support are to be included.
In the area of education with WebGIS in Mexico, until now no prototype is available in the web. Only schools with a high economic support use GIS. Usually they use ArcGIS desktop or download a GIS developed by the National Geographic and Statistical Institute (INEGI) from the scholar network IRIS [14].
On the other hand, there are sectors that promote the development of technologies at an early age, like the services offered by Casa Telmex. It has 17 national centers
and three “digital classrooms". Through these centers, children and young people of low economic level have access to a space where the use of technologies is free. They are created to promote the digital inclusion to support the education in the science, through innovative technologies for learning [26].
In Casa Telmex, children and teenagers learn programming, create robots and use different software. Potentially this is a proper place to promote the use and implementation of a new educational WebGIS addressing Mexico.
I
NFRASTRUCTURE
FOR
USING
W
EB
GIS
AT
5.1.
M
EXICAN SCHOOLS
institutions that provide the infrastructure and pedagogical services that students will use. They design and develop the educational models, to incorporate on the schools and some of that schools have been integrated in their educational devices some resources such as computers, internet, educative software, electronic whiteboard etcetera [33].
The WebGIS has the opportunity to be incorporated as another educational device online in any of the official levels that have the new paradigm incorporated. This levels start from kindergarden to high school (Figure 5).
Education System in Mexico Fig.
The WebGIS application is created to particularly be used at school (Graphic 2). Since this is the place where suitable infrastructure can be found, considering personal computers and the connection to internet. Classmates and the teachers can give feedback to each other.
Graphic 2 Internet users by studies level
In the year 2010, there were ten students per computer in high schools with internet access in Mexico. In the year 2010, there were 10 students per computer in high
20%
25%
28%
24%
2%
1%
Elementary School High School Baccalaureate College After college unspecifiedGraphic 1 Internet users by age groups in Mexico
11%
24%
21% 19%
12% 8% 5%
6 to 11 years
12 to 17
18 to 24
25 to 34
35 to 44
45 to 54
[6] and although the infrastructure in the country has increased, it is still limited in poor areas, while in other cases the technology is outdated. A WebGIS application that works with minimal requirements, like a computer connected to the internet can be the option to develop other tools for educational support.
In 2012, 41 million families in Mexico had computers, as shown in Graphic 3, and INEGI reported that 26% had connection to Internet in a country with 112.3 million inhabitants, according to the 2010 census of INEGI. The report points out that 59% of the families with computers did not have Internet, because they could not afford it, thus the application in advised to be used inside the school facilities [11].
In Mexico different kinds of sources for teaching materials are available, such as web sites addressing students, teachers, administrators and parents in order to provide information related to the academic performance. A number of web sites supports the teaching process, learning and the acquisition of new knowledge, such as: Red Escolar4, SEPiensa5, ENLACE6 and Enciclomedia7 [17].
A WebGIS application is offered through the Atmosphere Sciences Centre at UNAM8
and it provides specialized information, but they do not follow pursuit an educational objective (Figure 6).
Atmosphere Sciences Centre WebGIS , UNAM
6.-6.
N
ATURAL
R
ISKS IN
M
EXICO
It is necessary to know the main natural risks that affect Mexico and to review the CENAPRED data to identify all the natural disasters that happened in the last 30 years. Mexico is exposed to many different kinds of geologic and hydro-metrological risks (Figure 7). Between 1970 and 2009, 60 million people were affected. Mexico is classified as one of the 30 countries around the world exposed to more than three natural risks [10].
Natural risk in Mexico 1970-2009 Fig.
7.-600,000 800,000 1,000,000 1,200,000 1,400,000
The most common natural risks in Mexico are related with the hydro-meteorological risks such as electric storms, hurricanes, frost, hail, drought and other risks with geologic origin, e.g. seismic. The hydro-meteorology affects a third of the population and 40% of the national territory. Seismic risk affects one third of the population and one third of the national territory. Droughts are present in the north of Mexico and affect one third of the national territory and one fifth of the total population.
The costs for all economical loses are high and continue increasing each year (Graphic 4). That is the reason we need to improve the risk culture and to divulge all around that, to make more people know about it and to be familiar with preventive actions [9].
M
ETADATA OF THE RISK MAPS
6.1.
The data of the WebGIS will have national maps of Mexico related to natural risks, which were designed by National Prevention of Disasters Centre (CENAPRED) [29], where specialists monitor and publish notable information for each one of the risks (Figure 8).
Metadata CENAPRED, INEGI, CONAPO Fig.
Low, Intermediate, High, Very high and they are shown in a color code similar to the traffic light that intuitively indicates the different degrees of risks (Figure 9).
The topics of physical risk maps are:
volcanic seismic
hurricane electrical storms
frosts hail
droughts
Basic concepts of risk, exposure and vulnerability
Risk is the probability of occurrence of a potentially damaging phenomenon, in a given period. The danger is measured by its intensity and return period. Exposure is the amount of people, goods, values, infrastructure and systems that are susceptible of being lost or damaged. Vulnerability is the susceptibility of systems exposed to be affected.
9.-The previous data shows the way in which each map was obtained to include it in the WebGIS. As they were shown in Figure 15, the risks maps were taken from CENAPRED. The maps have five classes and are comparable to each other.
In the case of the population maps from 2010, the information was taken from INEGI, according to the 2010 census. Population density was obtained in ArcMap by dividing population area by state areas. Later, a classification was made to get five classes through the natural method called breaks having as result the population density map of 2010.
For the 2030 population, data was obtained from CONAPO, which is an institution in charge of designing population projections in Mexico. The year 2030 was chosen as a year of growth, in the short term. The procedure for calculating population, in the year 2030, was done with ArcMap. Estimation for population density for the year 2030 was obtained by dividing it with the state area. Then, it was classified using the natural method called breaks, having as a result five classes that derived on the classification of risks maps, highlighting population density.
This classification method was created by Jenks’ goal in developing this method was
to create a map that was absolutely accurate, in terms of the representation of data’s spatial attributes. By following this process, Jenks claims, the “blanket of error” can
be uniformly distributed across the mapped surface. He developed this with the intention of using relatively few data classes, less than seven, because that was the limit when using monochromatic shading on a choroplethic map [19].
G
AIA
WMS
6.2.
There are other services such as Web Map Services (WMS) that allow accessing and displaying some of their cartography available. In the official site of INEGI, the GAIA (Figure 11) site offers many products showing maps and offering Geoprocessing functions. The services offer several thematic maps that the students could use to make a spatial analysis with more elements, and to get more information.
11.-7.
D
ESIGN OF THE PROTOTYPE
R
EQUIREMENTS
7.1.
This WebGIS prototype needs to be a tool for applying the geographic concepts through the requirements of the competencies system, that is, this tool is aimed for students.
7.1.1. T
EACHING INVOLVEMENT WITHW
EBGIS
With a WebGIS people can access to geographic information to use different tools of space analysis that allow the study of geographic data, in order to get answers to different approaches. For the high school teachers it is important to know the questions about the data and spatial processes to get the right answers. For the professors of geography, biology, economy and history it is vital that the students develop suitable space reasoning. In terms of [25], some geographic questions can be categorized with regard to:
Position and extension
Form and distribution
Spatial association
Spatial interaction
Spatial variation
The tool of the WebGIS can help to answer them through the representation of the geographic data. The problems can be identified and some tasks can be defined due to the fact that the visual exploration of data is a key element for the approach of questions and answers, as it will be seen in the Chapter 6.
7.1.2.
S
PATIAL ANALYSIS IN HIGH SCHOOLS USINGW
EBGIS
Some questions that [30] mentions about spatial analysis are:
So that the query of the WebGIS is not isolated, the extended disciplinary competencies, in their theoretical framework, are considered in geography or biology, with topics of natural risks to which Mexico is exposed. To explain the risks properly, professors have to assist students to understand the topics about each natural risk:
4) To overlap the risks with the population density and to identify the zones of high, intermediate and low risk.
5) To observe changes or similarities of natural risk in the future. .
Both, professors and students can see the relationship between the geographic situation of the country and the geographic characteristics to identify the origin of
risks, like:
• Latitude
• Continentality
• Orography
• Volcanism
• Tectonic movements
• Dynamics of winds
• Temporality
The geographical principles could be applied to the WebGIS. The students could be able to understand some of these basic geographical principles, in order to reach the expected results.
They will have a meaningful support in classes, enriched by feedback; they will have extra information by clicking on the about bottom (Acerca de) and a tool that will give them a link to the Gaia9 WMS from Mexico, in order to check other thematic maps
such as temperature or geological risks and have the possibility to complete their analysis.
U
SE
C
ASES
7.2.
Location
It was provided by Federico Ratzel. It is about providing an exact location of a fact or a geographical phenomenon, taking into account spatial features like: elevation, borders, and surfaces.
Description
These principles such as location and description are relevant in geography. This WebGIS needs to have the possibility of displaying each natural risk map (seismic, electric storm, drought, etc.). Transparency is another element needed to observe the orographic chains, infrastructure, roads, towns, bodies of water, rivers, etc., and it needs to offer the possibility of changing the basic maps (satellite, roads etc.). With all of these options, the students could give a wide description and locate the risk levels along the country, in a national and regional scale.
Comparison or analogy
It was developed by Karl Von Ritter and Vidal de la Blanche. It is about setting up similarities and differences between a fact and a geographical phenomenon that is studied together with another one located somewhere else in the world.
The comparison principle is basic in geography and this WebGIS needs to have the possibility to compare maps, i.e. to display two maps of the same extent on a split screen. Another useful function is comparing two maps with a swipe function, where students can see the changes between two overlays.
Causality
It was coined by Alexander von Humboldt. It allows the identification of the reasons for a fact or a geographical phenomenon taking place. It also provides a scientific value to Geography.
Another related function constitutes displaying two maps of the same extent on a split screen.
Evolution
Geographical features that change as time goes by.
The WebGIS application needs to have the possibility to offer comparisons along time, and to offer the possibility to make overlays and to see the changes through time, offering the possibility to compare the past or future with map layers, especially if there is the chance to see density population (2010 or 2030) maps using the swipe option.
The use of this WebGIS application in schools will be as a tool in geography and a support mechanism in biology when observing the main ecosystems affected by each type of risk, for example the mangrove after hurricanes; in physics, in the topic of measurement of the distinct natural phenomena; in economy students could see the losses after a natural phenomenon; in history they could talk about relevant events etc.
U
SER INTERFACE AND FUNCTIONALITIES
7.3.
Design of Prototype for education Fig.
12.-The risk maps button (Mapas de Riesgo) opens a window where the user can switch between the available layers. For each risk topic a radio button is shown. By clicking a radio button the user can select the layer he wants to display on the map. Only one layer at a time can be active.
A slider widget allows controlling the transparency of the currently visible layer. A layer can be made invisible by moving the slider all the way to the left or opaque by moving it all the way to the right. The latter case is the default setting.
A legend (Leyenda) can be shown by clicking the legend button. The symbology of the currently of the currently visible risk layer can be seen.
Through the information button (Acerca de) a window providing information about the currently visible risk layer can be opened. Relevant and basic information about each risk topic is displayed, especially for brief consultation. Additionally, in the end of the dialog, there are links to actual and official information on the topic.
Swipe functionality (Barrido de mapa) can be used to part-wise overlay two layers for comparison purposes after clicking the swipe button. The user can overlay the map from the left to the right with a second layer referring to a second risk topic or a population density layer by moving a vertical bar. The additional layer to show can be selected inside of a window shown after clicking the swipe layers button (Compáralos).
The search button (Encuentralo) allows for searching for a place name (i.e. state) the user can enter to an input field. If the query succeeds, the map pans to the referring map extent and highlights the area.
8.
I
MPLEMENTATION
This section shows the implementation prototypical WebGIS.
M
AP SERVICE
8.1.
To implement the WebGIS, it was necessary to incorporate the risk data into an ArcMap project. In ArcCatalog the project was created; using a geo-database. ITRF_1992 was the coordinate system of the spatial work (Figure 13).
Process in ArcGIS desktop, for the .mxd project Fig.
In the Molder Builder, a tool box for the volcano buffer process map was created. A distance of 20 and 30 km from the volcano was applied, because those are the borders of a possible zone of affectation [29].
Process in Molder builder Fig.
15.-In the case of the population of 2010 and 2013, a reclassification was needed to divide and to group the classes in 5 new classes using the natural breaks method (Figure 15).
Process to connect to the UJI’s server (Figure 16)
Connect to VPN
Connect to the UJI server
The URL for connecting to the UJI server is: http://myserver:6080/arcgis
Login using the UJI’s username and a password.
Process in Molder builder for the buffer Fig.
16.-The map service providing the risk maps used for the WebGIS application can be accessed by the following URL:
http://mastergeotech.dlsi.uji.es:6080/
arcgis/rest/services/Webmap_mx/proyectomexico/MapServer/
I
MPLEMENTATION OF THE
W
EB
GIS
8.2.
8.2.1. HTML
8.2.2.1. Map
The principle component of the application is the map widget (Figure 17). It uses the Map class provided by the ArcGIS JSAPI. As observable in the table below, it is created programmatically using JavaScript. As first parameter an id pointing to a <div> inside the HTML is given to the constructor. Additionally an object
encapsulating properties such as “basemap”, “style” or “autoResize” is passed. The
map widget provides the typical functionalities of Web maps. For example it allows for panning and zooming.
Map or canvas
Fig.
17.-8.2.2.2. Transparency
Transparency
Fig.
18.-8.2.2.3. Dialog
The application uses the Dialog class of Dijit for all windows. This includes the measuring tool, all layer switching components, the legend, the base map gallery and the information window. The Dialog widget overlay the window and includes a title bar and a button for closing it. Additionally it can be moved over the screen, these way students have the possible to arrange the windows in a suitable way, in case that multiple windows are shown at the same time.
Another way of realizing components inside of dialogs used in the application is to place one <div> element that can be identified by its id inside the dialog. In this way the measurement tool (Figure 19), the legend and the basemap gallery are realized (Listing 4).
Dialog Fig.
19.-8.2.2.4. About (Acerca de)
The information window was implemented using a dialog as well. Each time when the visibility of the risk layers changes, the function updateInfortion is called. This function changes the value of the innerHTML property of a <Div> element placed inside of a dialog, (Figure 20).
About (Acerca de)
Fig.
20.-8.2.2.5. Search
The search component is implemented by declarating a text field as input for the search inside of the HTML file and executing the findTask which is provided by the ArcGIS JavaScript API. As parameters this class requires the URL to a map service, the ids of the layers to query, the names of the fields to query, the spatial reference of the output geometries and a function that should be called after successfully executing the task. Inside of the of the success function mentioned at last the resulting geometries of the response are drawn on the map (Listing 6).
Inside of the JavaScript code all radio buttons are accessed by their name property and an onChange function is assigned to them. If the onChange function of one of the buttons is called the checked radio button is identified by checking their state using a for loop. The loop stops after an activated radio button was found and its value is used to change the visible layer of the layers (riskLayers in the example) object, (Listing 7).
Radio Button
Fig.
21.-8.2.2.7. Storytelling swipe
8.2.2.8. Storytelling compare
Storytelling Compare is the button that allows choosing two different topics of risk maps, because the screen is divided in two parts. The students can see two maps at the same time, they can move and zooming one map and the other map will be in the same position because the movements apply in both maps. This button allows to identify regions with same grade of natural risk and to see where are locate the similarities and differences between two maps simultaneously, (Figure 23).
The feature of showing two maps at a time is implemented by changing the width of Storytelling Swipe
23.-9.
C
ONCLUSION AND FURTHER WORK
The aim of this work was to investigate the feasibility of implementing a WebGIS to be used in Mexican high schools to improve spatial education focused on Mexican natural risks by providing a simple user interface using free accessible web technologies.
The result of this work is a prototypical WebGIS application allowing to visualize risk maps about volcanism, seismic activity, electrical storms, hail, frost, droughts and hurricanes in Mexico. Additionally, data about the population density of 2010 and 2030 as well as geological faults is provided.
The application allows switching between the available layers. Using a slider the transparency of the layers can be adjusted. A tool for measuring distances and areas is provided. The base map can be changed. A legend can be shown. A window providing information about the currently visible risk layer can be opened. Swipe functionality can be used to part-wise overlay two layers for comparison purposes. A search form allows to enter place names and to identify them on the map. A second map showing always the same extent as the first map can be activated to compare two distinct layers or topics.
This application can help students to design plans for risk prevention and actions to minimize the risks, which are frequent in Mexico. It is conceivable to utilize it at school in different ways. First of all, provided by its comprehensible and intuitive user interface, it can be used by the students in an unsupervised way. However, the interactiveness of WebGIS in general, and thus also of the prototype presented in this work, suggest for a usage that enforces the interchange of feedback between groups of students among themselves, as well as between students and teachers. Furthermore, the application can be used to illustrate important points of certain topics or as opener for lessons.
WebGIS allow maps and other applications to be available for a large population share. The web facilitates the accessibility of spatial information. With open geo-spatial web services and the new generation of SDI in some countries, a further increase of the distribution of WebGIS and especially free accessible WebGIS is to be expected.
The development of WebGIS for educational purposes and thus also applications addressing the paradigm of competences in Mexico is a sample of mutual benefit. It is necessary to continue implementing this kind of tools as an educational support mechanism for scientific topics as well as technological skills to complement education and to navigate it to a more sustainable direction.
In this work a first prototype of a WebGIS addressing the special requirements demanded by the paradigm of competencies and geographical as well as infrastructural characteristics of Mexico was developed. Based on the requirements identified in this work, the prototype was implemented to firstly prove the feasibility of such an application and to suggest the development of further applications for education in Mexico. Establishing on this prototypical application in future further WebGIS involving a deeper and more complex range of functions should be developed.
10.
R
EFERENCES
[1] American Geographical Society 1994. Geography for Life: National Geography Standards. National, Geographic Research and Exploration, National Council for Geography Society Washington, DC.
[2] Andrew J Milson, 2011. GIS in the cloud: using WebGIS for teaching secondary geography. Didáctica Geográfica No. 12, pp. 151 – 153 http://www.didacticageografica.es/index.php/didacticageografica/article/view/66
[3] ArcGIS Resource Center. ArcGIS API for JavaScript 1.6 Accessed December 27http://resources.esri.com/help/9.3/arcgisserver/apis/javascript/arcgis/help/jshelp_start.ht2013 m#jshelp/overview_api.htm
[4] ArcGIS Resources. ArcGIS Online Help. Make your first map. Accessed November 27 2013 http://resources.arcgis.com/en/help/arcgisonline/index.html#/na/010q0000009p000000/
[5] Baker,T., 2005. Internet-Based GIS Mapping in Support of K-12 Education. Volume 57, Issue 1 Taylor & Francis
[6]
Base de Datos de Tablas Estadísticas. Sistema de Administración del Conocimiento del INEE. AR02d Alumnos por computadora con acceso a Internet para uso educativo en educación media superior (2009/2010). Accessed November 23 2013. 2013http://www.inee.edu.mx/bie/mapa_indica/2010/PanoramaEducativoDeMexico/AR/ AR02/2010_AR02__d-vinculo.pdf )
[7] Düren, M., Bartoschek, T., 2013. Toward a usable WebGIS for schools.Geoinformatik.
[8] Düren, M., Bartoschek, T., 2013. Usability Engineering for Educational WebGIS. AGILE.
[9] Estadísticas a propósito del dia internacional para la reducción de los desastres. 2013 Instituto Nacional de Estadística y Geografía. Aguascalientes, México. Accessed January 72014.
[10]
Estadísticas a propósito del día internacional para la reducción de los desastres. 2013. Instituto Nacional de Estadística y Geografía. Aguasacalientes, Mexico. Accessed on
February 10 2014.
http://www.inegi.org.mx/inegi/contenidos/espanol/prensa/contenidos/estadisticas/2013/ desastres0.pdf
[11]
Estadísticas a propósito del día mundial del internet. 2013 Instituto Nacional de Estadística y Geografía. Aguascalientes, México, Accessed November 3 2013. http://www.inegi.org.mx/inegi/contenidos/espanol/prensa/Contenidos/estadisticas/2013/i nternet0.pdf
[12] Fu, P., Sun, J., 2011.WebGIS principles and applications. ESRI Press.
[14] Gonzalez, F., 2011. Alumnos y maestros de alta tecnología. InformationWeek Mexico. Accessed October 17 2013. http://www.informationweek.com.mx/analysis/alumnos-y-maestros de-alta-tecnologia/
[15] Guha-Sapir D. et al., 2004. Thirty years of natural disasters 1974-2003. The numbers. Universitaires de Louvain, UCL. Centre for Research on the Epidemiology of Disasters. Belgium.
[16] Hacklay M., 2010. Interacting with Geospatial Technologies.Environmental & Geomatic Engineering, University College London, UK Department of Civil,
[17]
Instituto Latinoamericano de la Comunidad Educativa. Organismo Internacional. Desarrollo de Portales y sitios Web. Portales Educativos. Accessed November 62013 http://www.ilce.edu.mx/plataformas-tecnologicas/capacidades-institucionales/desarrollo-de-portales-y-sitios-Web
[18] Jacobs, H., 1989. Interdisciplinary curriculum: Design and Implementation. Alexandria, Virginia: Association for Supervision and Curriculum Development.
[19] Jenks, G. F., 1967. "The Data Model Concept in Statistical Mapping", International Yearbook of Cartography 7: 186–190
[20] Kerski, J. J., 2001. A National Assessment of GIS in American High Schools, International Research in Geographical and Environmental Education, 10:1, 72-84.
[21] Kerski, J. J., 2003. The Implementation and Effectiveness of Geographic Information Systems Technology and Methods in Secondary Education. Journal of Geography. Volume 102, Issue 3. Taylor Francis Online.
[22] Longley, P. A. et al., 2011. Geographic Information System. Willey, USA.
[23]
Loranger, H., Nielsen, J., 2013. Teenage Usability: Designing Teen-Targeted Websites. NN/g Nielsen Norman Group. Evidence-Based User Experience Research, Training, and Consulting. Accessed October 202013). http://www.nngroup.com/articles/usability-of-Websites-for-teenagers/
[24]
Nielsen, J., 2012. Usability 101: Introduction to Usability. NN/g Nielsen Norman Group. Evidence-Based User Experience Research, Training, and Consulting. Usability 101: Introduction to Usability. Accessed October 152013.
http://www.nngroup.com/articles/usability-101-introduction-to-usability/
[28] educación del tipo medio superior. Diario Oficial, México.
[29] Secretaría de Gobernación. Atlas Nacional de Riegos, CENAPRED. Descarga de capas Accessed October 4 2013. http://www.atlasnacionalderiesgos.gob.mx/index.php?option=com_content&view=article
[30] Slater, F., 1982. Learning through Geography. Heineman Educational Books, Ltd.
[31] Subsecretaría de Educación Media Superior, 2013. Documento Base del Bachillerato General. Dirección General del Bachillerato. Secretaría de Educación Pública. México DF.
[32]
TeachTerms.com. API http://www.techterms.com/definition/api Accessed December 26 2013.
APPENDIX OF LISTING
This appendix displays some parts of the code that was used into the WebGIS application in the programming process.
<!DOCTYPE html> <html>
<head>
[...]
Reference to ArcGIS style sheet:
<link rel="stylesheet" href="http://js.arcgis.com/3.7/js/esri/css/esri.css">
Reference to Dojo style sheet: <link rel="style sheet"
href="http://serverapi.arcgisonline.com/jsapi/arcgis/3.4/js/dojo/dijit/themes/claro /claro.css">
Reference to ArcGIS JSAPI:
<script src="http://js.arcgis.com/3.7/"></script> Reference to application's JavaScript file: <script src="app.js"></script>
Reference to application's CSS file <link rel="stylesheet" href="style.css"> </head>
Use the claro class defined in the Dojo CSS for the body: theme: <body class="claro">
[...] </body> </html>
Listing 1.- HTML file
HTML: