ISSN 0001-3765 www.scielo.br/aabc
Slope variation and population structure of tree species
from different ecological groups in South Brazil
EDMILSON BIANCHINI, CRISTINA C. GARCIA, JOSÉ A. PIMENTA and JOSÉ M.D. TOREZAN
Departamento de Biologia Animal e Vegetal, Centro de Ciências Biológicas, Universidade Estadual de Londrina Caixa Postal 6001, 86051-970 Londrina, PR, Brasil
Manuscript received on December 17, 2008; accepted for publication on May 5, 2010
ABSTRACT
Size structure and spatial arrangement of 13 abundant tree species were determined in a riparian forest fragment in Paraná State, South Brazil (23◦16′S and 51◦01′W). The studied species wereAspidosperma polyneuronMüll. Arg., Astronium graveolensJacq. andGallesia integrifolia(Spreng) Harms (emergent species); Alseis floribundaSchott, Ruprechtia laxiflora Meisn. and Bougainvillea spectabilis Willd. (shade-intolerant canopy species); Machaerium paraguariense Hassl, Myroxylum peruiferum L. and Chrysophyllum gonocarpum (Mart. & Eichler ex Miq.) Engl. (shade-tolerant canopy species); Sorocea bonplandii(Baill.) Bürger,Trichilia casarettiC. Dc, Trichilia ca-tiguaA. Juss. andActinostemon concolor(Spreng.) Müll. Arg. (understory small trees species). Height and diameter structures and basal area of species were analyzed. Spatial patterns and slope correlation were analyzed by Moran’s I spatial autocorrelation coefficient and partial Mantel test, respectively. The emergent and small understory species showed the highest and the lowest variations in height, diameter and basal area. Size distribution differed among emergent species and also among canopy shade-intolerant species. The spatial pattern ranged among species in all groups, except in understory small tree species. The slope was correlated with spatial pattern forA. polyneuron,A. graveolens,A. floribunda,R. laxiflora,M. peruiferumandT. casaretti. The results indicated that most species occurred in specific places, suggesting that niche differentiation can be an important factor in structuring the tree community.
Key words:diameter structure, ecological groups, forest fragment, seasonal semideciduous forest, spatial pattern.
INTRODUCTION
Plants had different requirements related to seed ger-mination, seedling emergence and survival and recruit-ment to higher size classes (Messaoud and Houle 2006, Tsujino and Yumoto 2007). Soil water availability, soil fertility and light are among these requirements (Mes-saoud and Houle 2006). Because the resources related to these requirements are heterogeneously distributed in the environment (Bianchini et al. 2001, Messaoud and Houle 2006), there is often a high spatial heterogene-ity in microsites suitable for tree seedling establishment (Houle 1992).
Microsites heterogeneity often correlates with
spa-Correspondence to: Edmilson Bianchini E-mail: [email protected]
tial distributions of tropical trees, suggesting that eco-logical sorting caused by niche differentiation may be important in structuring tropical forest tree communities (Svenning 1999, Harms et al. 2001, Russo et al. 2005). In environmentally biased spatial distributions, tree spe-cies should show performance (mortality and growth rates) differences when growing in different habitats. Russo et al. (2005) observed species performance vari-ation among soil types in a Bornean rain forest and con-cluded that performance-based ecological sorting among soils was evident.
vital rates (Kelly et al. 2001), it should range among species in a site. Wright et al. (2003) presented the size distribution for the 73 tree species from Barro Colorado, Panama. The authors found several kinds of size dis-tributions, such as the one with many large individuals and a long tail of relatively rare, small individuals (nega-tive skeweness) characterizing light-demanding species, and the one with many small individuals and a long tail of relatively rare, large individuals (positive skeweness) characterizing shade-tolerant species. The authors con-cluded that most species has intermediate light require-ments and lifestyles.
It has been demonstrated that topography and re-lated edaphic characteristics affect the tree species dis-tribution (Botrel et al. 2002, Rodrigues et al. 2007, Tsujino and Yumoto 2007). Pioneer species may be more abundant in steeper than lower slope sites, because sloppy terrains have more frequent and larger gaps re-sulting from landslips (Russo et al. 2005). We studied a sloppy terrain and we therefore expected to find dif-ferences in spatial pattern distribution of abundant spe-cies from different ecological groups.
Wishing to contribute to the knowledge of tree species ecology in Atlantic Forest fragments, the aim of this work was to determine the size and spatial struc-tures of some of the abundant species from different ecological groups of a riparian forest fragment. The main asked questions were: 1) Do size and spatial struc-tures differ among species groups? 2) Is the slope re-lated to species spatial distribution? As this area shows well-lit conditions (J.A. Costa, unpublished data), we expected that emergent and shade-intolerant canopy species showed predominance of large individuals (neg-ative skeweness), random spatial pattern and their dis-tribution not associated with the slope. Contrastingly, the shade-tolerant canopy and understory small species showed predominance of small individuals (positive skeweness), clumped spatial pattern in shady places and their distribution associated with the slope.
METHODS
STUDYAREA ANDSAMPLING
The 100 ha of seasonal semideciduous forest fragment are situated on a private property called “Fazenda Do-ralice” (hereafter FD), which lies on the left margin of
the Tibagi River (23◦16′S and 51◦01′W). The climate is Köppen’s Cfa, with a mean annual temperature of 21.8◦C and mean annual rainfall of 1570 mm. The soil is fertile and has a clayish texture (Soares-Silva et al. 1992).
A phytosociological (tree community structure) study was conducted using a 1 ha (100 m ×100 m) plot, subdivided into hundred 10 m ×10 m subplots, and included all trees with at least 5 cm of stem diameter at 1.30 m height (Soares-Silva et al. 1992).
One side of the plot was aligned with the riverbank. The site has no flood-prone terrain, and subplots near the riverbank (up to the 4th subplot row) have a strong slope (mean 45%) with shallow soil and frequent rock outcrops, litter removal by surface rainwater and hillside illumination (steep slope area). The rest of the subplots lies on a gradually higher and deeper soil terrain (inter-mediate and gentle slope areas). The canopy seemed to be heterogeneous, ranging from 8 m to 12 m height, with few clearings but an increased winter illumination due to leaf fall (which occurs for 20–50% of the trees).
COMMUNITYSTRUCTURE ANDSELECTION OFSPECIES
In the phytosociological inventory, the species were ar-ranged on the basis of importance value (IV) (Brower and Zar 1984), and we selected 13 of the 15 species with the highest IV. These species are common in sea-sonal semideciduous forest fragments in southern and southeastern Brazil. Using field observations and lit-erature data (Silva and Soares-Silva 2000, Cavalheiro et al. 2002, Bianchini et al. 2003), the selected species were divided into four groups: emergent species –
Aspi-dosperma polyneuronMüll. Arg.,Astronium graveolens
Jacq. andGallesia integrifolia(Spreng) Harms; shade-intolerant canopy species – Alseis floribunda Schott,
Ruprechtia laxifloraMeisn. andBougainvillea
specta-bilisWilld.; shade-tolerant canopy species –
Machae-rium paraguariense Hassl, Myroxylum peruiferum L.
and Chrysophyllum gonocarpum (Mart. & Eichler ex
Miq.) Engl.; small understory trees species –Sorocea
bonplandii (Baill.) Bürger, Trichilia casaretti C. Dc,
Trichilia catigua A. Juss. and Actinostemon concolor
(Spreng.) Müll. Arg.
were used to compare the vertical structure and the basal area (BA = perimeter2/4π) of species and species groups. The individuals of each sampled population were distributed in nine diameter classes with 5 cm in-terval, except for the last two classes, to determine the diameter structure of each species. These criteria were considered the best to represent the sampling popula-tions, as it did not produce empty classes and allowed to species structure comparison. We used Kolmogorov-Smirnov test (α ≤ 0,05)to evaluate the differences among diameter structure of species (Siegel 1975). Al-though the inclusion of individuals of DBH<5 cm is desirable, these data are not available due to constraints in field logistics. While this feature of the sample may limit our conclusions, several other studies have been discussing tree size structure using just higher size classes (e.g. Manabe et al. 2000, Bianchini et al. 2003,
Tsujino and Yumoto 2007).
We used the number of individuals for each 10 × 10 m subplot and subplot center coordinates to deter-mine the spatial pattern of each species. The spatial pat-tern was analyzed using Moran’s I spatial autocorrela-tion coefficient (Legendre and Fortin 1989) calculated for 12 distance classes, testing the null hypothesis that the I coefficient, at each distance class, is not
signifi-cantly different from zero, indicating randomness (Le-gendre and Fortin 1989). A spatial correlogram was build based on I values as a function of the distance
classes, and its significance was tested using Bonferroni criterion (Oden 1984).
To correlate the spatial pattern to slope, we deter-mined the subplot slope from a 1:100 topographic map. The relationship between the spatial patterns of individ-uals of each species and slope was estimated with partial Mantel tests (Legendre and Fortin 1989). P-levels for these tests were determined by a permutation procedure (from 1000 permutations). The autocorrelation analyses and partial Mantel tests were performed with Passage Software (Rosenberg 2001).
RESULTS
SIZESTRUCTURE
ForA. polyneuronandA. graveolenspopulations, only
2% and 8% of the individuals reached a height over
20 m, respectively, in which the mean height ofA.
gra-veolenswas greater thanA. polyneuron(Table I). These
species showed a positive skeweness diameter distribu-tion (negative exponential curve) with nearly 70% of their individuals in the 1stdiameter class (Fig. 1A), but with no individuals in the>25–50 cm range forA.
poly-neuronand>35–50 cm range forA. graveolens. Three
individuals ofA. polyneuronwith more than 74 cm dia-meter led to a higher mean and standard deviation val-ues thanA. graveolens, although this species showed a
higher median (Table I).
The G. integrifolia population was composed of
large individuals (Table I), with 24% of them being over 20 m height. This species showed lower height varia-tion than other two emergent species (Table I).G.
inte-grifoliashowed individuals in all diameter classes, with
no prevalence in any of them (Fig. 1A). As for height, this species showed greater diameter mean and median values and lower diameter variation than other emergent species (Table I).
The height data of shade-intolerant canopy species were very similar, whereas these data for shade-tolerant canopy species were discrepant (Table I). In this group,
M. paraguariense showed greater variation than other
species did.
Diameter distribution patterns differed among shade-intolerant canopy species (Fig. 1B). R. laxiflora
showed a negative exponential distribution shape, with most of its individuals (57.5%) in the first diameter class. This species showed higher diameter variation than other species of this group. A. floribundashowed
an almost bimodal pattern, with an increased number of individuals in the first (32%) and 5th(19%) diameter class (Fig. 1B). B. spectabilis differed from the latter species, having most of its individuals in the first two classes (Fig. 1B), while mean and median diameters sug-gest thatA. floribundapopulation included larger
indi-viduals thanR. laxifloraandB. spectabilisdid (Table I).
The diameter distribution of shade-tolerant canopy species was similar to a negative exponential pattern (Fig. 1C). For M. paraguarienseand C. gonocarpum,
most individuals (nearly 55%) belonged to the first dia-meter class, whileM. peruiferumshowed a similar
num-ber of individuals in the first two classes. M. peruiferum
TABLE I
Height, diameter and basal area data for a sample of tree species in a riparian forest fragment in Fazenda Doralice, Ibiporã, Paraná State, Brazil. H – height (m); D – diameter (cm);
BA – basal area (m2ha−1); X – mean; S – standard deviation; Md – median; CV – coefficient of variation (%). Number of individuals are in parentheses in front of the species name.
H D
BA
X S Md CV X S Md CV
Emergent trees 10.5 6.7 7.3 64.4 17.7 19.4 9.6 110 6.41
Aspidosperma polyneuron(34) 8.1 5.5 6.5 67.8 14.2 20.7 6.4 146 1.64 Astronium graveolens(52) 9.3 5.8 7.0 62.3 11.5 11.1 7.6 96.4 1.03 Gallesia integrifolia(33) 14.7 7.5 14.0 50.8 31.0 22.2 25.1 71.8 3.73 Shade-intolerant canopy trees 8.4 3.3 7.5 39 16.2 12.5 11.5 77.2 3.39
Alseis floribunda(37) 8.2 3.3 7.5 40 20.6 14.2 16.7 69 1.81
Ruprechtia laxiflora(40) 8.2 3.2 7.5 39 13.1 11.6 9.0 88 0.95
Bouganvillea spectabilis(26) 8.8 3.5 8.0 40 14.8 9.72 12.1 65.9 0.63 Shade-tolerant canopy trees 9.8 5.4 8.5 55.3 14.9 13.4 10.5 90 2.60 Machaerium paraguariense(29) 9.4 5.6 7.3 59.8 15.6 17.5 8.6 112 1.22 Myroxylum peruiferum(26) 12.8 6.2 11.5 48.2 16.7 12.5 12.4 75.3 0.88 Chrysophyllum gonocarpum(29) 7.4 2.6 7.0 35.3 12.3 8.5 8.6 69.2 0.50
Small understory trees 5.9 1.7 5.9 29.4 8.1 3.9 7.0 48.2 2.41
Sorocea bonplandii(134) 5.8 1.9 5.5 32.9 7.4 2.4 6.8 33.1 0.63
Trichilia casaretti(117) 6.3 1.7 6.0 27.2 10.0 5.2 9.2 51.6 1.17
Thichilia catigua(43) 5.9 1.6 5.5 26.8 6.8 1.8 6.1 26.3 0.17
Actinostemon concolor(82) 5.5 1.4 5.2 25.9 7.4 3.7 6.4 50.4 0.44
species in this group did (Table I). However, M.
para-guariensepresented higher diameter variation than other
species (Table I).
Height data were quite similar among the four un-derstory small tree species (Table I). T. casaretti and
S. bonplandiihad individuals reaching 13 m height, in
spite of their classification as understory trees. Species of this group had a diameter distribution with a negative exponential shape, with most individuals (60%) in the first diameter class, followed by a strong reduction in the second one (Fig. 1D). Mean and median diameter data suggest thatT. casarettireached greater sizes and higher diameter variation than other species of this group did (Table I).
The emergent species group showed the higher variation in height and diameter, especiallyA. polyneu-ron, and higher basal area, mainly G. integrifolia,
whereas the small understory trees group showed the lower variation (Table I). It should be mentioned thatA.
floribundashowed the second higher basal area among
species (Table I).
Gallesia integrifolia,Alseis floribundaandTrichilia casarettidiameter structures differed (KS test, p<0,05)
from other species of their groups. No difference among shade-tolerance canopy species was observed. The re-sult was complex when we considered the species all together. In general, the diameter structure ofG. integri-foliadiffered from all species, except forC. gonocarpum,
whereasM. paraguariensejust differed fromG. integri-foliaandS. bonplandii.
SPATIALDISTRIBUTION
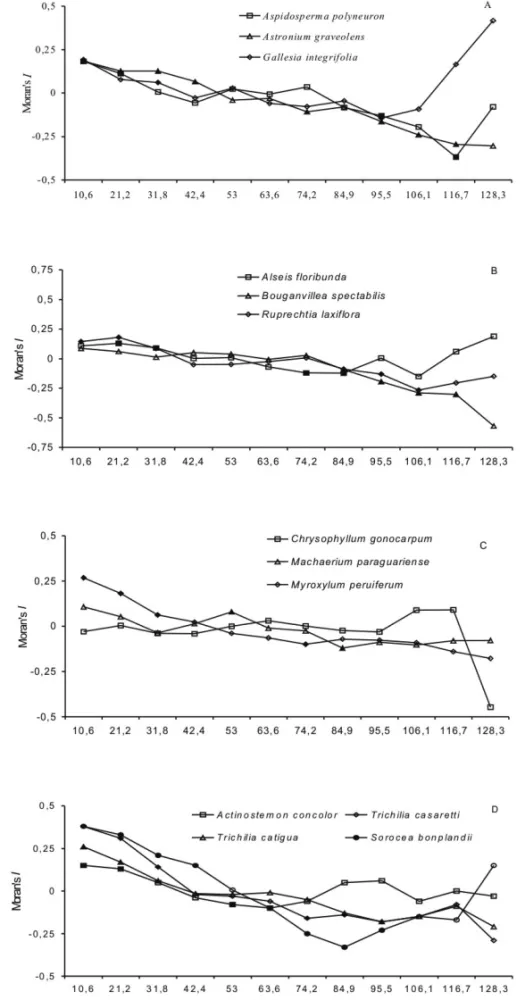
The spatial pattern ofC. gonocarpum(correlogram glob-ally not significant) andB. spectabiliswas random in the study site (Fig. 2B, C). All other species showed spa-tial gradient with significant positive autocorrelation at short distances, and significant negative autocorrelation at large distances (Fig. 2). The correlogram of these species can be divided into four kinds: a)A. polyneuron
andA. concolorpresented clumps of ca. 10–20 m (Fig.
Fig. 1 – Diameter class distribution of individuals of tree species in a riparian forest fragment in Fazenda Doralice, Ibiporã, Paraná State, Brazil. A – emergent trees; B – shade-intolerant canopy trees; C – shade-tolerant canopy trees; D – small understory trees.
clumps of ca. 10–40 m (Fig. 2A, D); d)M.
paragua-riensepresented clumps of ca. 50 m (Fig. 2C).
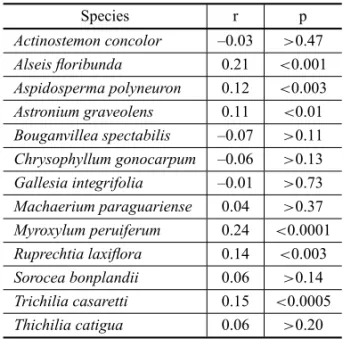
The spatial distribution pattern ofA. floribunda,A.
polyneuron,A. graveolens,M. peruiferum,R. laxiflora
andT. casaretti was associated with slope (Table II).
These species showed clumps at steep slope area, and
A. graveolensandA. polyneuronhad higher and lower
size clumps, respectively.
Although the spatial pattern of other seven species was not associated with slope (Table II), G.
integrifo-liaandS. bonplandiiwere more abundant at the gentle
slope (ca. 53%) than intermediate (ca. 24% and 37%) and steep slope areas (ca. 24% and 10%), whereas A.
concolorandC. gonocarpumwere abundant at the
in-termediate slope (57% and 56%). M. paraguarienseand
Fig. 2 – Spatial correlogram of 13 tree species density in a riparian forest fragment in Fazenda Doralice, Ibiporã, Paraná State, Brazil. A – emergent trees; B – shade-intolerant canopy trees; C – shade-tolerant canopy trees; D – small understory trees. The abscissa corresponds to the upper limit (m) of each distance class. Black points indicate significant Moran’s I values at theα= 5% level (for globally significant
TABLE II
Partial Mantel test for tree species density and slope in a riparian forest fragment in Fazenda Doralice,
Ibiporã, Paraná State, Brazil.
Species r p
Actinostemon concolor –0.03 >0.47 Alseis floribunda 0.21 <0.001 Aspidosperma polyneuron 0.12 <0.003 Astronium graveolens 0.11 <0.01 Bouganvillea spectabilis –0.07 >0.11 Chrysophyllum gonocarpum –0.06 >0.13 Gallesia integrifolia –0.01 >0.73 Machaerium paraguariense 0.04 >0.37 Myroxylum peruiferum 0.24 <0.0001 Ruprechtia laxiflora 0.14 <0.003 Sorocea bonplandii 0.06 >0.14 Trichilia casaretti 0.15 <0.0005 Thichilia catigua 0.06 >0.20
slope, while B. spectabilis was more abundant in
intermediate and gentle slope.
DISCUSSION
Contrary to our expectations, the size distributions were not typical for emergent species and for shade-intolerant canopy species. All sampled populations, except G.
integrifolia, showed a prevalence of small individuals,
suggesting that they had potential to regeneration (Kell-man et al. 1998, McLaren et al. 2005) and partially supporting the idea of Kellman et al. (1998) regarding the bias toward rare species when extinction occurs in fragmented habitats.
The lack ofG. integrifoliain small diameter classes
did not necessarily suggest a population decline. This kind of size distribution could be related to its shade-intolerance. Authors have often observed a mass seed-ling emergence on the forest floor near adult individu-als, followed by their disappearance months later, and the presence of saplings of this species only in gaps and at the forest edge. Light-demanding species usually show high growth rates, which reduce the number of small individuals and increase the number of large indi-viduals (Condit et al. 1998). Besides, saplings of these species die quickly when overtopped and shaded by an-other tree (Wright et al. 2003).
The current paradigm posits a dominant axis of life history variation among tree species in closed canopy forests, ranging from light-demanding pioneer species to shade-tolerant climax species (Denslow 1987). Some studies that compared size distribution of co-occurring species revealed the existence of functional groups of species with similar life histories (Poorter et al. 1996, Wright et al. 2003), confirming such paradigm. This seems to be the case of the studied seasonal semidecid-uous forest. The species ranged from shade-intolerant species, likeG. integrifolia, to very shade-tolerant
spe-cies, likeT. catiguaandS. bonplandii.
Also for spatial pattern, our expectations could not be confirmed for emergent species and for shade-intolerant canopy species. Most of the studied species showed clumped spatial pattern. This pattern is reported to be common to tropical trees (Condit et al. 2000). The clumping of individuals may be a consequence of lim-ited dispersion, vegetative reproduction or environmen-tal heterogeneity (Hutchings 1997). Dispersal limita-tion is negligible in the studied spatial scale (one ha) and the species did not show vegetative reproduction in the area. These results suggested the existence of microsites with particular light environment, soil chemical compo-sition, and moisture that are favorable to the regeneration of these species. Niche differentiation has been reported to be important in structuring tropical forest tree com-munities (Svenning 1999, Harms et al. 2001).
The classification of species into groups or guilds imposes a degree of simplification that reduces informa-tion content, but reveals general patterns and facilitates predictions about forest processes (Swaine and Whit-more 1988). In each group, members share important characteristics for determining the forest structure and composition (Swaine and Whitmore 1988). However, size distribution and spatial pattern were not common between emergent species and canopy shade-intolerant ones. Species differ in their life history in different ways. The shade-tolerance degree in different life stages need to be investigated, especially in seasonal forests.
Diameter structure and spatial distribution ranged among canopy emergent species. WhereasA. polyneuron
andA. graveolensshowed several seedling and saplings
in the forest, this is not observed for G. integrifolia
den-sity, with a denser wood for the first two species (Car-valho 1994). Species with denser woods have slower growth rates (Wright et al. 2003), resulting in size dis-tribution with many small individuals. A. polyneuron
andA. graveolens spatial distribution showed an
asso-ciation with slope and had a higher density in subplots near the riverbank, a sunny and shallow soil environment. The first species is a sciophyte and a deep-soil special-ist, while the second species is a heliophyte, preferring dry and rocky soils (Lorenzi 2000). In a slope terrain, canopy gaps and lateral illumination provide a sunny en-vironment to the regeneration of A. graveolens, while
soil accumulation that occurs in some microsites should be related to the small clumpings ofA. polyneuron.
During the development of the North Paraná State region in the last century,G. integrifoliawas empirically
associated with (and used by people as an indicator of) deep and fertile soils (Lorenzi 2000), that is concordant with the results of this study, in which the species was more abundant on the gentle slope area.
The lack of individuals of A. polyneuron and A.
graveolens, which are two high-valued commercial
tim-ber species (Carvalho 1994), in the diameter ranges of 25-50 cm and 35-50 cm, respectively, suggests that se-lective logging could have taken place at the studied site in the past. Another source of evidence of human impact and selective harvesting was the low density of
Euterpe edulis Mart. (Arecaceae; heart of palm), less
than 2 trees.ha−1(Soares-Silva et al. 1992),versusover 100 trees.ha−1in another mature forest fragment in the 50-km range of the study site (Soares-Silva and Bar-roso 1992).
Among canopy shade-intolerant species, R.
laxi-flora and A. floribundaoccurred in clumps preferably
in the subplots near riverbanks. The slope and canopy heterogeneity, which provides a sunny environment, can be related to the species spatial distribution. However,
R. laxiflorashowed high abundance in alluvial areas in
other well-conserved forest fragment of the region (Bi-anchini et al. 2003). Further studies need to be done with this species. A. floribunda showed bimodal size
distribution suggesting alteration in resource allocation pattern when the individual reach the canopy. Ontoge-netic shifts would cause multimodal size distributions, with few individuals in size classes with rapid growth
and high mortality, and many individuals in size clas-ses with slow growth and low mortality (Condit et al. 1998). Alseis blackianaprovides an example to
onto-genetic shifts in Barro Colorado (Dalling et al. 2001). AlthoughB. spectabilisoccurred randomly in the area, it was more common in gentle slope areas. This spe-cies was not dependent of gap because small individu-als have a behavior that is similar to the one of lianas.
The spatial distribution ofC. gonocarpumwas
con-sistent with the one observed in a floodplain site in an-other forest fragment of the same region (Bianchini et al. 2003). The slope-independent spatial distribution of this species suggests that it could be a microsite gen-eralist. On the other hand, bothM. peruiferumandM.
paraguariense showed an aggregated spatial pattern,
with the first species occurring preferentially in the steep slope and shallow-soil subplots near the riverbank. M.
paraguariensedid not show a relationship with slope.
While M. peruiferum have been considered a typical canopy species of semideciduous Atlantic Forest else-where, in this study nearly one-third (27%) of its indi-viduals showed a height superior to the mean height of canopy species (i.e.,>12 m height), which is a greater
proportion of the population than the one ofA. polyneu-ron(nearly 9% of individuals over 12 m height).
All small understory species showed negative ex-ponential curve and clumped spatial pattern. Bianchini et al. (2003) found the same results for understory spe-cies, includingA. concolorandT. catigua, in other forest
fragment of the region. The high abundance of under-story species in tree communities of semideciduous At-lantic Forest in northern Paraná State (Soares-Silva and Barroso 1992, Soares-Silva et al. 1992, 1998, Bianchini et al. 2003) can contribute to the decrease of microsite heterogeneity in forests by increasing plant cover and reducing light, compensating for the canopy gaps and favoring shade-tolerant species regeneration.
Although only T. casaretti was associated with
slope,A. concolorandS. bonplandiishowed discordant
spatial distribution, with the first species occurring near the riverbank (rocky and shallow soil, more gaps, sunny environment), S. bonplandii in the gentle slope area
(with deep soil, less gaps), andA. concolor in an
mini-mized by small differences in shade tolerance, which is an important factor in the species coexistence (Manabe et al. 2000). The factors affectingT. catigua
distribu-tion are not clear, although it showed no reladistribu-tionship with slope.
Height data indicate a strong overlap among spe-cies, making the identification of strata in the forest dif-ficult, as reported by many authors for tropical forests. Among small understory trees, onlyT. catiguashowed
strictly small sizes, while some individuals ofT.
casa-rettiandS. bonplandiireached the canopy layer. Canopy
species, such asC. gonocarpum, may limit its
distribu-tion to the lower boundary of the stratum, while others, such asM. peruiferum, can have emergent trees among
their individuals.
Our predictions were partially met, especially to shade tolerant species. Shade tolerance variation can explain the results for otherwise light-demanding spe-cies. Evidences of niche differentiation were found, but a study associating microhabitat to regeneration permance is need to confirm such hypothesis. In FD for-est fragment, the slope explained the distribution of six of the 13 studied species, while “slope” itself can be viewed as a broad factor that encompasses many vari-ables, such as soil depth, drainage, water retention, fre-quency of gaps and so on.
RESUMO
Visando contribuir para o conhecimento das estratégias de vida de espécies em fragmentos florestais, foram determinadas as estruturas de tamanho e espacial de 13 espécies arbóreas do remanescente de floresta ciliar no Estado do Paraná, no Sul do Brasil (23◦16′S e 51◦01′W). Foram analisadas as es-pécies:Aspidosperma polyneuronMüll. Arg.,Astronium gra-veolensJacq. eGallesia integrifolia(Spreng) Harms, (emer-gentes);Alseis floribundaSchott,Ruprechtia laxifloraMeisn. eBougainvillea spectabilisWilld. (dossel, intolerantes à som-bra); Machaerium paraguarienseHassl,Myroxylum peruife-rumL. e Chrysophyllum gonocarpum (Mart. & Eichler ex Miq.) Engl. (dossel, tolerantes à sombra);Sorocea bonplandii (Baill.) Bürger, Trichilia casaretti C. Dc,Trichilia catigua A. Juss. eActinostemon concolor(Spreng.) Müll. Arg. (su-bosque). Analisou-se a estrutura de diâmetro de cada espé-cie. Para a análise do padrão espacial e correlação com a declividade foram utilizados o Índice de Autocorrelação
es-pacial de Moran e o Teste Parcial de Mantel, respectivamente. Os grupos das árvores emergentes e das espécies de subosque apresentaram as maiores e as menores variações na altura e no diâmetro e maior e menor área basal, respectivamente. Dife-renças nas estruturas de diâmetro foram observadas entre as espécies emergentes e entre as espécies de dossel intolerantes à sombra. O padrão espacial variou entre as espécies de todos os grupos, exceto as espécies de subosque tolerantes à sombra. A topografia estava relacionada com a distribuição espacial de A. polyneuron,A. graveolens, A. floribunda,R. laxiflora,M. peruiferumeT. casaretti. A análise dos resultados indicou que para cada espécie a maioria dos indivíduos ocorriam em locais específicos, sugerindo que a diferenciação de nicho pode estar relacionada à estruturação desta comunidade arbórea.
Palavras-chave: estrutura de diâmetro, grupos ecológicos, fragmento florestal, floresta estacional semidecidual, padrão espacial.
REFERENCES
BIANCHINIE, PIMENTAJAANDSANTOSFAM. 2001.
Spa-tial and temporal variation in the canopy cover in a tropical semi-deciduous forest. Braz Arch Biol and Technol 44: 269–276.
BIANCHINIE, POPOLORS, DIASMCANDPIMENTA JA.
2003. Diversidade e estrutura de espécies arbóreas em área alagável do município de Londrina, Sul do Brasil. Acta Bot Bras 17: 405–419.
BOTRELRT, OLIVEIRAFILHOAT, RODRIGUESLAAND
CURIN. 2002. Influência do solo e topografia sobre as variações da composição florística e estrutura da comu-nidade arbórea-arbustiva de uma floresta estacional semi-decidual em Ingaí, MG. Rev Brasil Bot 25: 195–213.
BROWER JE AND ZAR JH. 1984. Field and laboratory
methods for general ecology, 2nd ed., Dubuque: Brown Publishers.
CARVALHO PER. 1994. Espécies florestais brasileiras:
re-comendações silviculturais, potencialidades e uso da ma-deira, Brasília: EMBRAPA/CNPF/SPI.
CAVALHEIROAL, TOREZANJMD ANDFADELI L. 2002.
Recuperação de áreas degradadas: procurando por diver-sidade e funcionamento dos ecossistemas. In: MEDRI ME, BIANCHINIE, SHIBATTAAO AND PIMENTA JA (Eds), A bacia do rio Tibagi, Londrina, p. 213–224.
CONDIT R, SUKUMARR, HUBBELSPANDFOSTERRB.
CONDITRET AL. 2000. Spatial pattern in the distribution of tropical tree species. Science 288: 1414–1418.
DALLINGJW, WINTERK, NASONJD, HUBBELLSP, MU
-RAWSKI DANDHAMRICK J. 2001. The unusual
life-history of Alseis blackiana: a shade-persistent pioneer tree: Ecology 82: 933–945.
DENSLOWJS. 1987. Tropical rainforest gaps and tree species
diversity. An R Ecol Syst 18: 431–451.
HARMSKE, CONDITR, HUBBELL SPANDFOSTERRB. 2001. Habitat associations of tree and shrubs in a 50-ha neotropical forest plot. J Ecol 89: 947–959.
HOULE G. 1992. The reproductive ecology ofAbies bal-samea,Acer saccharumandBetula alleghaniensisin the Tantaré Ecological Reserve, Québec. J Ecol 80: 611–623.
HUTCHINGSMJ. 1997. The structure of plant population. In:
CRAWLEYJM (Ed), Plant Ecology, Oxford: Blackwell
Scientific Publ, p. 97–136.
KELLMANM, TACKABERRYRANDRIGGL. 1998.
Struc-ture and function in two tropical gallery forest commu-nities: implications for forest connection in fragmented systems. J Appl Ecol 35: 195–206.
KELLYCKET AL. 2001. Investigations in commonness and
rarity: a comparative analysis of co-occurring, congeneric Mexican trees. Ecol Lett 4: 618–627.
LEGENDREPANDFORTINM-J. 1989. Spatial pattern and
ecological analysis. Vegetatio 80: 107–138.
LORENZIH. 2000. Árvores brasileiras, Nova Odessa:
Plan-tarum.
MANABE T, NISHIMURAN, MIURA MANDYAMAMOTO
S. 2000. Population structure and spatial patterns for tree in a temperate old-growth evergreen broad-leaved forest in Japan. Plant Ecol 151: 181–197.
MCLARENKP, MCDONALDMA, HALLJBANDHEALEY JR. 2005. Predicting species response to disturbance from size class distributions of adults and saplings in a Jamaican tropical dry forest. Plant Ecol 181: 69–84.
MESSAOUD YAND HOULE G. 2006. Spatial patterns of
tree seedling establishment and their relationship to envi-ronmental variables in a cold-temperate forest of eastern North America. Plant Ecol 185: 319–331.
ODENNL. 1984. Assessing the significance of a spatial cor-relogram. Geogr Anal 16: 1–16.
POORTER L, BONGERS F, VAN ROMPAEY SARR AND
KLERKM. 1996. Regeneration of canopy tree species at five sites in West African moist forest. For Ecol Manage 84: 61–69.
RODRIGUES LA, CARVALHO DA, OLIVEIRA FILHO AT
AND CURIN. 2007. Efeitos de solos e topografia so-bre a distribuição de espécies arbóreas em um fragmento de floresta estacional semidecidual, em Luminárias, MG. R Árvore 31: 25–35.
ROSENBERGMS. 2001. PASSAGE – Pattern Analysis,
Spa-tial Statistics, and Geographic Exegesis. Department of Biology, Arizona State University, Tempe, AZ.
RUSSOSE, DAVIESSJ, KINGDAANDTANS. 2005. Soil-related performance variation and distributions of tree species in a Bornean rain forest. J Ecol 93: 879–889.
SIEGELS. 1975. Estatística não paramétrica para ciência do
comportamento, Rio de Janeiro: McGraw-Hill.
SILVAFCANDSOARES-SILVALH. 2000. Arboreal flora of
the Godoy Forest State Park, Londrina, PR, Brazil. Edinb J Bot 57: 107–120.
SOARES-SILVALHANDBARROSOGM. 1992.
Fitossocio-logia do estrato arbóreo da floresta na porção norte do Parque Estadual Mata dos Godoy, Londrina, PR, Brasil. In: CONGRESSO DA SOCIEDADE BOTÂNICA DE SÃO PAULO, 8, Campinas. Anais do VIII Congresso da So-ciedade Botânica de São Paulo, Campinas, p. 101–112.
SOARES-SILVA LH, BIANCHINI E, FONSECA EP, DIAS
MC, MEDRI ME AND ZANGARO-FILHO W. 1992. Composição florística e fitossociologia do componente arbóreo das florestas ciliares da bacia do rio Tibagi. 1. Fazenda Doralice – Ibiporã, PR. Rev Inst Flor 4: 199– 206.
SOARES-SILVALH, KITAKKANDSILVAFC. 1998.
Fitos-sociologia de um trecho de floresta de galeria no Parque Estadual Mata dos Godoy, Londrina, PR, Brasil. Bol Herb Ezechias Paulo Heringer 3: 46–62.
SVENNINGJC. 1999. Microhabitat specialization in a
spe-cies-rich palm community in Amazonian Ecuador. J Ecol 87: 55–65.
SWAINEMDANDWHITMORETC. 1988. On the definition
of ecological species groups in tropical rain forests. Veg-etatio 75: 81–86.
TSUJINORANDYUMOTOT. 2007. Spatial distribution
pat-terns of trees at different life stages in a warm temperate forest. J Plant Res 120: 687–695.
WRIGHTSJ, MULLER-LANDAUHC, CONDITRANDHUB