online | memorias.ioc.fiocruz.br
Evaluation of crystal violet decolorization assay for minimal
inhibitory concentration detection of primary antituberculosis
drugs against Mycobacterium tuberculosis isolates*
Ahmet Yilmaz Coban1/+, Ahmet Ugur Akbal1, Meltem Uzun2,
Yeliz Tanriverdi Cayci1, Asuman Birinci1, Belma Durupinar1
1Ondokuz Mayis University Medical School, Department of Medical Microbiology, Samsun, Turkey 2Istanbul University Istanbul Medical School, Department of Medical Microbiology, Istanbul, Turkey
In this study we evaluated the crystal violet decolorization assay (CVDA) for detection of minimum inhibitory con-centration (MIC) of antituberculosis drugs. 53 isolates were tested in this study and 13 of them were multidrug resistant (MDR) isolates. The antibiotics concentrations were 2-0.06 mg/L for isoniazid (INH) and rifampicin (RIF) and were 16-0.25 mg/L for streptomycin (STM) and ethambutol (EMB). Crystal violet (CV-25 mg/L) was added into the microwells on the seventh day of incubation and incubation was continued until decolorization. Decolorization of CV was the predictor of bacterial growth. Overall agreements for four drugs were detected as 98.1%, and the average time was detected as 9.5 ± 0.89 day after inoculation. One isolate for INH and two isolates for STM were determined resistant in the reference method, but susceptible by the CVDA. One isolate was susceptible to EMB by the reference method, but resistant by the CVDA. All results were concordant for RIF. This study shows that CVDA is a rapid, reliable andsuitable for determina-tion of MIC values of Mycobacterium tuberculosis. And it can be used easily especially in countries with limited-sources.
Key words: Mycobacterium tuberculosis - antituberculosis drugs - susceptibility testing - multi drug resistance - crystal violet decolorization assay
doi: 10.1590/0074-02760160082
+ Corresponding author: [email protected]
*A part of this study was presented as a poster presentation at 7th National Mycobacteria Symposium, Mersin, Turkey, 8-10 May 2015. Received 3 March 2016
Accepted 18 May 2016
Tuberculosis (TB) remains one of the world’s dead-liest communicable diseases. In 2013, an estimated 9.0 million people developed TB and 1.5 million died from the disease. The proportion of new cases with multi-drug-resistant TB (MDR-TB) was 3.5% in 2013 and has not changed compared with recent years, in the world-wide (WHO 2014). Early and accurate detection of drug resistance in TB, especially MDR and extensively drug-resistance (XDR) is the most important step for the use of appropriate treatment regimens for the patient, which has an important impact for the better control of the dis-ease (Martin et al. 2008, Coban et al. 2014a). The de-velopment of rapid methods for drug susceptibility test-ing (DST) is very important due to the increastest-ing rates of MDR-TB and the recently described XDR-TB in the worldwide (Aziz et al. 2006, Shah et al. 2007).
It is well known that proportion method is gold standard for detection of drug resistance in TB. However, obtain-ing results require three-six weeks. This problem can be dissolved by the use of automated systems such as Bactec MGIT 960 (Becton Dickinson Diagnostic Systems, Sparks, MD, USA), but it has high cost and need for equipment (CLSI 2011). For these reasons, their use of developing
coun-tries is limited. In addition, molecular methods of suscep-tibility testing are available, including the expensive com-mercial Xpert MTB/RIF and Genotype MTBDRplusassays (Bwanga et al. 2009, Friedrich et al. 2011, Chang et al. 2012).
Recently, new rapid, inexpensive, reliable and reproduc-ible colorimetric methods including nitrate reductase assay (NRA), resazurin microtiter assay (REMA), malachite green decolorization assay and crystal violet decolorization assay (CVDA) have been developed (Farnia et al. 2008, Co-ban & Uzun 2013, CoCo-ban 2014, CoCo-ban et al. 2014a, b).
In this study, CVDA was evaluated to detect mini-mum inhibitory concentration (MIC) for primary anti-tuberculosis drugs against Mycobacterium tuberculosis.
MATERIALS AND METHODS
Bacterial isolates - In this study, 53 isolates obtained from pulmonary tuberculosis patients were used. The iso-lates that tested in this study were different from other studies. 13 isolates were MDR, 14 isolates were only resistant to isoniazid (INH) and one isolate was only re-sistant to rifampicin (RIF). Remaining 25 isolates were susceptible to both of INH and RIF. 22 isolates were resis-tant to streptomycin (STM) and 12 isolates were resisresis-tant to ethambutol (EMB). In addition, H37Rv (susceptible to all drugs), ATCC 35822 (resistant to INH), ATCC 35838 (resistant to RIF), ATCC 35837 (resistant to EMB) and ATCC 35820 (resistant to STM) were used as control iso-lates. All isolates were sub-cultured on LJ medium.
Preparation of antibiotics and crystal violet (CV) - Stock solution of CV was prepared at 25 mg/L with ster-ile distilled water. This suspension of CV was sterilised by filtration and stored at 4ºC until use. Stock solutions were prepared at 1000 mg/L for STM, INH, RIF and EMB. Methanol was used as solvent for RIF, and sterile distilled water was used for others. The stock solutions of antibiotics were stored at -40ºC until use.
Preparation of test microplates - All tests were per-formed in 96-well microtitre plates. All wells were filled with 0.1 mL of Middlebrook 7H9S broth. Antibiotic test concentrations were prepared by the serial two-fold di-lution. Seven dilutions of each antibiotics and a growth control well prepared for each isolates. The antibiotics concentrations were 2-0.06 mg/L for INH and RIF and were 16-0.25 mg/L for STM and EMB. All prepared mi-crotitre plates were stored at -40ºC until use.
Preparation of bacterial inoculum - Freshly sub-cul-tured bacterial isolates were used for preparation of in-oculum. All colonies of each isolates from LJ media were transferred into tubes containing 5 mL Middlebrook 7H9 broth without casiton and OADC and 15-20 glass beads and were vortexed for 1-2 min. The tubes were kept in vertical position for 30 min at room temperature to allow to precipitation of aerosol and other particles. The turbid-ity of the supernatant was adjusted to a McFarland stan-dard number 1. The prepared bacterial suspension was then diluted at an 1:10 ratio in Middlebrook 7H9S broth.
Application of the test - 100 microlitres of bacterial suspension was inoculated into each well of the plates. Af-ter bacAf-terial inoculation, all plates were incubated at 37ºC under normal atmospheric conditions. On the seventh day
of incubation, 25 μL of CV (25 mg/L) were added into the growth control and drug containing wells simultane-ously. After that incubation was continued until decolor-ized of CV in the growth control well. MIC was defined as the lowest drug concentration without decolorization (Figure). If the MIC value was over the breakpoints value, isolate was considered to be resistant to that tested antibi-otics. Breakpoints values were 0.125, 0.5, 2 and 4 mg/L for INH, RIF, STM and EMB, respectively.
RESULTS
In this study, resistance patterns and MIC values of standard strains were summarised in Table I. MIC val-ues of H37Rv were 0.06, 0.06, 0.5 and 1 mg/L for INH, RIF, STM and EMB, respectively. MIC values of ATCC 35822 (INH resistant) were > 2, 0.06, 1 and 2 mg/L for INH, RIF, STM and EMB, respectively. MIC values of ATCC 35838 (RIF resistant) were 0.06, > 2, 0.5 and 2 mg/L for INH, RIF, STM and EMB, respectively. MIC values of ATCC 35820 (STM resistant) were < 0.03, 0.03, > 16 and < 0.25 mg/L for INH, RIF, STM and EMB, re-spectively. MIC values of ATCC 35837 (EMB resistant) were 0.125, 0.06, 1 and 16 mg/L for INH, RIF, STM and EMB, respectively. All results for standard strains were obtained between 9-14 days (Table I).
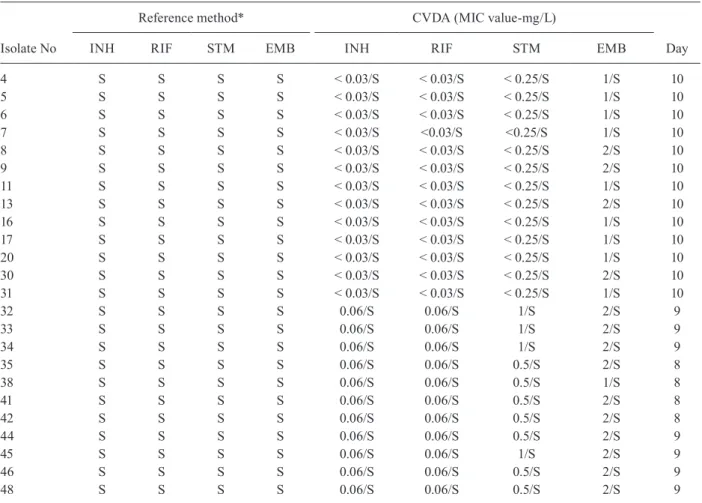
In the study, 24 isolates were susceptible all primary antituberculous agents. MIC values of INH and RIF were < 0.03 mg/L for 13 isolates and were 0.06 mg/L for 11 isolates. For STM, MIC values were < 0.03 mg/L for 13 isolates, 0.5 mg/L for seven isolates and 1 mg/L for four isolates. For EMB, MIC values were 1 mg/L for 10 isolates and 2 mg/L for 14 isolates. All results were obtained between eight-10 days (Table II).
Evaluation of minimal inhibitory concentration plate.
streptomycin (STM) 1, isoniazid (INH) 1, rifampicin (RIF) 1, ethambutol (EMB) 1: Growth control (without antibiotic) STM 2, EMB 2: 16 mg/L INH 2, RIF 2: 2 mg/L STM 3, EMB 3: 8 mg/L INH 3, RIF 3: 1 mg/L STM 4, EMB 4: 4 mg/L INH 4, RIF 4: 0.5 mg/L STM 5, EMB 5: 2 mg/L INH 5, RIF 5: 0.25 mg/L STM 6, EMB 6: 1 mg/L INH 6, RIF 6: 0.125 mg/L STM 7, EMB 7: 0.5 mg/L INH 7, RIF 7: 0.06 mg/L STM 8, EMB 8: 0.25 mg/L INH 8, RIF 8: 0.03 mg/L
*
: Minimal inhibitory concentration (MIC) values MIC values for isolate 1; STM: 0.5 mg/L, INH: 0.06 mg/L, RIF: 0.06 mg/L, EMB: 2 mg/L (susceptible to all tested antibiotics)MIC values for isolate 2; STM: > 16 mg/L, INH: > 2 mg/L,
RIF: > 2 mg/L, EMB: 16 mg/L (resistant to all tested antibiotics-multidrug resistant isolate)
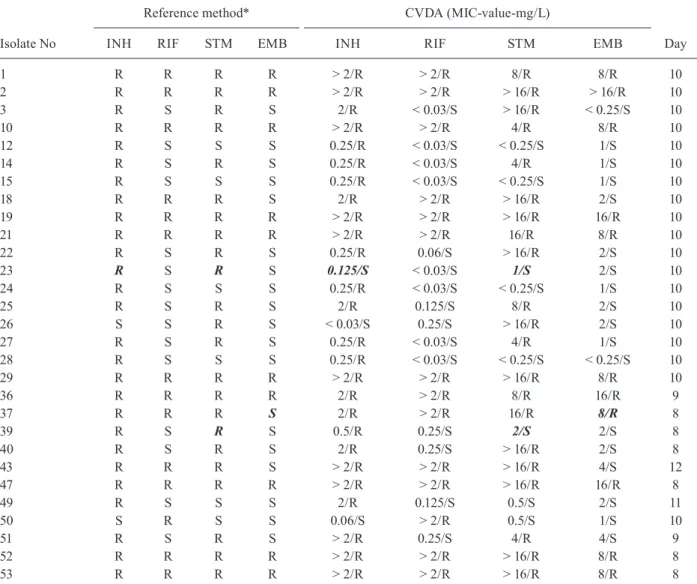
29 isolates, which have various resistant patterns, were tested in the study. 10 MDR isolates were resistant to INH, RIF, STM and EMB, and three MDR isolates were resistant to INH, RIF and STM. Nine isolates were
resistant to INH and STM, five isolates were only re-sistant to INH, one isolate was rere-sistant to RIF and one isolate was resistant to STM. All results were obtained between eight-12 days (Table III).
TABLE I
Minimal inhibitory concentration values of control strains
Isolates
Reference method* CVDA (MIC value-mg/L)
Day
INH RIF STM EMB INH RIF STM EMB
H37Rv S S S S 0.06 (S) 0.06 (S) 0.5 (S) 1 (S) 14
ATCC35822 R S S S > 2 (R) 0.06 (S) 1 (S) 2 (S) 10
ATCC35838 S R S S 0.06 (S) > 2 (R) 0.5 (S) 2 (S) 9
ATCC35820 S S R S < 0.03 (S) 0.03 (S) > 16 (R) < 0.25 (S) 13
ATCC35837 S S S R 0.125 (S) 0.06 (S) 1 (S) 16 (R) 11
*Reference method: Bactec MGIT 960; CVDA: crystal violet decolorization assay; EMB: ethambutol; INH: isoniazid; R: resist-ant; RIF: rifampicin; S: susceptible; STM: streptomycin.
TABLE II
Minimal inhibitory concentration values of drug susceptible isolates
Isolate No
Reference method* CVDA (MIC value-mg/L)
Day
INH RIF STM EMB INH RIF STM EMB
4 S S S S < 0.03/S < 0.03/S < 0.25/S 1/S 10
5 S S S S < 0.03/S < 0.03/S < 0.25/S 1/S 10
6 S S S S < 0.03/S < 0.03/S < 0.25/S 1/S 10
7 S S S S < 0.03/S <0.03/S <0.25/S 1/S 10
8 S S S S < 0.03/S < 0.03/S < 0.25/S 2/S 10
9 S S S S < 0.03/S < 0.03/S < 0.25/S 2/S 10
11 S S S S < 0.03/S < 0.03/S < 0.25/S 1/S 10
13 S S S S < 0.03/S < 0.03/S < 0.25/S 2/S 10
16 S S S S < 0.03/S < 0.03/S < 0.25/S 1/S 10
17 S S S S < 0.03/S < 0.03/S < 0.25/S 1/S 10
20 S S S S < 0.03/S < 0.03/S < 0.25/S 1/S 10
30 S S S S < 0.03/S < 0.03/S < 0.25/S 2/S 10
31 S S S S < 0.03/S < 0.03/S < 0.25/S 1/S 10
32 S S S S 0.06/S 0.06/S 1/S 2/S 9
33 S S S S 0.06/S 0.06/S 1/S 2/S 9
34 S S S S 0.06/S 0.06/S 1/S 2/S 9
35 S S S S 0.06/S 0.06/S 0.5/S 2/S 8
38 S S S S 0.06/S 0.06/S 0.5/S 1/S 8
41 S S S S 0.06/S 0.06/S 0.5/S 2/S 8
42 S S S S 0.06/S 0.06/S 0.5/S 2/S 8
44 S S S S 0.06/S 0.06/S 0.5/S 2/S 9
45 S S S S 0.06/S 0.06/S 1/S 2/S 9
46 S S S S 0.06/S 0.06/S 0.5/S 2/S 9
48 S S S S 0.06/S 0.06/S 0.5/S 2/S 9
TABLE III
Minimal inhibitory concentration values of drug resistant isolates
Isolate No
Reference method* CVDA (MIC-value-mg/L)
Day
INH RIF STM EMB INH RIF STM EMB
1 R R R R > 2/R > 2/R 8/R 8/R 10
2 R R R R > 2/R > 2/R > 16/R > 16/R 10
3 R S R S 2/R < 0.03/S > 16/R < 0.25/S 10
10 R R R R > 2/R > 2/R 4/R 8/R 10
12 R S S S 0.25/R < 0.03/S < 0.25/S 1/S 10
14 R S R S 0.25/R < 0.03/S 4/R 1/S 10
15 R S S S 0.25/R < 0.03/S < 0.25/S 1/S 10
18 R R R S 2/R > 2/R > 16/R 2/S 10
19 R R R R > 2/R > 2/R > 16/R 16/R 10
21 R R R R > 2/R > 2/R 16/R 8/R 10
22 R S R S 0.25/R 0.06/S > 16/R 2/S 10
23 R S R S 0.125/S < 0.03/S 1/S 2/S 10
24 R S S S 0.25/R < 0.03/S < 0.25/S 1/S 10
25 R S R S 2/R 0.125/S 8/R 2/S 10
26 S S R S < 0.03/S 0.25/S > 16/R 2/S 10
27 R S R S 0.25/R < 0.03/S 4/R 1/S 10
28 R S S S 0.25/R < 0.03/S < 0.25/S < 0.25/S 10
29 R R R R > 2/R > 2/R > 16/R 8/R 10
36 R R R R 2/R > 2/R 8/R 16/R 9
37 R R R S 2/R > 2/R 16/R 8/R 8
39 R S R S 0.5/R 0.25/S 2/S 2/S 8
40 R S R S 2/R 0.25/S > 16/R 2/S 8
43 R R R S > 2/R > 2/R > 16/R 4/S 12
47 R R R R > 2/R > 2/R > 16/R 16/R 8
49 R S S S 2/R 0.125/S 0.5/S 2/S 11
50 S R S S 0.06/S > 2/R 0.5/S 1/S 10
51 R S R S > 2/R 0.25/S 4/R 4/S 9
52 R R R R > 2/R > 2/R > 16/R 8/R 8
53 R R R R > 2/R > 2/R > 16/R 8/R 8
*Reference method: Bactec MGIT 960; CVDA: crystal violet decolorization assay; EMB: ethambutol; INH: isoniazid; R: resist-ant; RIF: rifampicin; S: susceptible; STM: streptomycin.
The sensitivity, specificity, positive predictive value (PPV), negative predictive value (NPV) and agreement for INH were 96.3%, 100%, 100%, 96.3% and 98.1%, re-spectively. One isolate was resistant to INH by the refer-ence method, but susceptible by the CVDA. All results were concordant for RIF and all values were 100%. The sensitivity, specificity, PPV, NPV and agreement for STM were 91.3%, 100%, 100%, 93.7% and 96.2%, respectively. Two isolates were resistant to STM by the reference meth-od, but susceptible by the CVDA. The sensitivity, speci-ficity, PPV, NPV and agreement for EMB were 100%, 97.6%, 90.9%, 100% and 98.1%, respectively. One isolate was susceptible to EMB by the reference method, but re-sistant by the CVDA (Table IV). Overall agreement for four drugs was detected as 98.1%, and the average time was detected as 9.5 ± 0.89 day after inoculation.
DISCUSSION
Early detection of tuberculosis, especially MDR-TB, allows the effective treatment of TB patients and contrib-utes the TB control. Therefore rapid detection methods for susceptibility testing of M. tuberculosis are crucial. Sev-eral rapid, inexpensive, reliable and accurate colorimetric and phenotypic methods have been developing (WHO 2011). Colorimetric methods have some advantages such as they are rapid, accurate, reliable, easy perform, inex-pensive and evaluate by the naked eye. The NRA and REMA are well known but malachite green decoloriza-tion assay and CVDA have been newly developed.
TABLE IV
Comparison of the result of crystal violet decolorization assay (CVDA) with those obtained with reference method
Drugs CVDA
Reference method*
Sensitivity (%)
Specificity (%)
PPV (%)
NPV (%)
Agreement (%)
R S
INH R 26 0 96.3 100 100 96.3 98.1
S 1 26
RIF R 14 0 100 100 100 100 100
S 0 39
STM R 21 0 91.3 100 100 93.7 96.2
S 2 30
EMB R 10 1 100 97.6 90.9 100 98.1
S 0 42
*Reference method: Bactec MGIT 960; EMB: ethambutol; INH: isoniazid; NPV: negative predictive value; PPV: positive predic-tive value; R: resistant; RIF: rifampicin; S: susceptible; STM: streptomycin.
in eight-nine days (Coban et al. 2014a). Nour et al. (2013) determined the sensitivities, specificities, PPVs, NPVs and agreements of INH and RIF were 100% by REMA.
In the NRA, the pooled sensitivities-specificities were 96-99% for INH, 97-100% for RIF, 90-98% for EMB, and 82-96% for STM. The results had been ob-tained between five and 28 days by the direct test and between five and 14 days by the indirect test (Coban et al. 2014b). Montoro et al. (2005) reported that the sensi-tivity and specificity of the NRA for INH and RIF were 95.6% and 100%, respectively.
It was reported that water-born pathogenic mycobac-teria were resistant to CV and they decolorized CV. This feature is membrane associated and resistance could be due to the reduction of CV and the sequestering in the lipid fraction (Jones & Falkinham 2003). After this knowledge, CVDA for early detection of MDR-TB was developed by Coban in 2014. It was reported that agree-ments for INH and RIF were 94.5-98% and 96.3-98%, respectively (Coban 2014, Coban et al. 2015).
In this study, we determined the MIC values of four drugs by CVDA and agreements were 98.1%, 100%, 96.2% and 98.1% for INH, RIF, STM and EMB, respectively. Overall agreement for four drugs was detected as 98.1%, and the average time was detected as 9.5 ± 0.89 day after in-oculation. Similar results as other colorimetric assay includ-ing the REMA and the NRA were also obtained by CVDA. The issue for managers of TB laboratories, particu-larly in resource-limited settings, has been to interpret the biosafety levels into specific precautions relevant to a country’s activities. The probability of aerosols being generated is important for determining the level of risk. Using liquid medium has an increased risk of generating aerosols; thus, it is recommended to perform these proce-dures should be in a biosafety cabin (BSC) (WHO 2012). Also, BSC is important for the prevention of contamina-tions in TB testing. However, BSC and using of personal protective equipments for biosafety sometimes may not be cost effective in countries with limited resources.
In conclusion, CVDA is a rapid, cheap, reliable and suitable for determination of MIC values of M. tuberculo-sis. In addition, it can be used for screening of new antitu-bercular chemicals. Even if further multicenter studies are needed prior to use in routine laboratory, it is promised for used in developed and developing countries.
REFERENCES
Aziz MA, Wright A, Laszlo A, de Muynck A, Portaels F, Van Deun A, et al. Epidemiology of antituberculosis drug resistance (the Glob-al Project on Anti-tuberculosis Drug Resistance Surveillance): an updated analysis. Lancet. 2006; 368(9553): 2142-54.
Bwanga F, Hoffner S, Haile M, Joloba ML. Direct susceptibility test-ing for multidrug resistant tuberculosis: a meta-analysis. BMC Infect Dis. 2009; 9: 67.
Chang K, Lu W, Wang J, Zhang K, Jia S, Li F, et al. Rapid and effec-tive diagnosis of tuberculosis and rifampicin resistance with Xpert MTB/RIF assay: a meta-analysis. J Infect. 2012; 64(6): 580-8.
CLSI - Clinical and Laboratory Standards Institute. Susceptibility testing of Mycobacteria, Nocardia, and other aerobic actinomy-cetes. CLSI document M24-A2. 2nd ed. Wayne: CLSI; 2011.
Coban AY, Akbal AU, Uzun M, Durupinar B. Evaluation of four col-ourimetric susceptibility tests for the rapid detection of multi-drug-resistant Mycobacterium tuberculosis isolates. Mem Inst Oswaldo Cruz. 2015; 110(5): 649-54.
Coban AY, Deveci A, Sunter AT, Martin A. Nitrate reductase assay for rapid detection of isoniazid, rifampin, ethambutol, and strep-tomycin resistance in Mycobacterium tuberculosis: a systematic review and meta-analysis. J Clin Microbiol. 2014a; 52(1): 15-9.
Coban AY, Deveci A, Sunter AT, Palomino JC, Martin A. Resazurin microtiter assay for isoniazid, rifampicin, ethambutol and strep-tomycin resistance detection in Mycobacterium tuberculosis: updated meta-analysis. Int J Mycobacteriol. 2014b; 3(4): 230-41.
Coban AY, Uzun M. Rapid detection of multidrug-resistant Mycobac-terium tuberculosis using the malachite green decolourisation assay. Mem Inst Oswaldo Cruz. 2013; 108(8): 1021-3.
Farnia P, Masjedi MR, Mohammedi F, Tabarseyi P, Farnia P, Moham-madzadeh AR, et al. Colorimetric detection of multidrug-resis-tant or extensively drug-resismultidrug-resis-tant Tuberculosis by use of mala-chite green indicator dye. J Clin Microbiol. 2008; 46(2): 796-9.
Friedrich SO, Venter A, Kayigire XA, Dawson R, Donald PR, Diacon AH. Suitability of Xpert MTB/RIF and genotype MTBDRplus
for patient selection for a tuberculosis clinical trial. J Clin Micro-biol. 2011; 49(8): 2827-31.
Jones JJ, Falkinham JO 3rd. Decolorization of malachite green and crystal violet by waterborne pathogenic mycobacteria. Antimi-crob Agents Chemother. 2003; 47(7): 2323-6.
Martin A, Panaiotov S, Portaels F, Hoffner S, Palomino JC, Angeby K. The nitrate reductase assay for the rapid detection of isonia-zid and rifampicin resistance in Mycobacterium tuberculosis: a systematic review and meta-analysis. J Antimicrob Chemother. 2008; 62(1): 56-64.
Montoro E, Lemus D, Echemendia M, Martin A, Portaels F, Palo-mino JC. Comparative evaluation of the nitrate reductase assay, the MTT test and the resazurin microtiter assay for drug
suscep-tibility testing of clinical isolates of Mycobacterium tuberculosis. J Antimicrob Chemother. 2005; 55(4): 500-5.
Nour MS, El-Shokry MH, Shehata IH, Aziz AMA-E. Evaluation of re-zasurin microtiter assay and high resolution melting curve analysis for detection of rifampicin and isoniazid resistance of Mycobacte-rium tuberculosis clinical isolates. Clin Lab. 2013; 59(7): 763-71.
Shah NS, Wright A, Bai GH, Barrera L, Boulahbal F, Martín-Casabona N, et al. Worldwide emergence of extensively drug-resistant tuber-culosis. Emerg Infect Dis. 2007; 13(3): 380-7.
WHO - World Health Organization. Global tuberculosis report 2014. Geneva: WHO. 2014.
WHO - World Health Organization. Noncommercial culture and drug-susceptibility testing methods for screening patients at risk for multi drug resistant tuberculosis: policy statement. Ge-neva: WHO. 2011. Available from: http://apps.who.int/iris/bitstre am/10665/44601/1/9789241501620_eng.pdf.