Adjustment Methods and Without Replacement Bootstrap:
Applications to a Business Survey
ANA CRISTINA M. COSTA
Instituto Superior de Estatística e Gestão de Informação
Universidade Nova de Lisboa
Campus de Campolide, 1070-312 Lisboa
PORTUGAL
[email protected]
Abstract: - Applications of several adjustment methods and the Without Replacement Bootstrap (BWO) are presented, using data from the 1997 Annual Business Survey, conducted by Portugal’s National Statistics Institute. The application of these methods is motivated by issues related with frame problems and total nonresponse. The BWO algorithm is used for variance estimation of the considered estimators: the adjustment cell estimator, the post-stratified estimator and the post-stratified estimator with adjustment cells. The results agree with the theoretical evidences referred in the literature.
Key-Words: Adjustment methods, bootstrap, reweighting, post-stratification, frame problems, nonresponse.
1 Introduction
The target population definition is particularly important during the design stage of a survey. The target population is the set of elements to which statistical data should refer according to the objectives of the survey. A perfect sampling frame is an up-to-date list of all elements in the target population. Such complete, perfect and up-to-date information is in general difficult to obtain, especially when applying for business surveys.
The Annual Business Survey (ABS) is a major survey conducted by Portugal’s National Statistics Institute. Like most business surveys the ABS suffers from more than one category of frame imperfections. Moreover, it also faces the problem of unit nonresponse. These nonsampling errors affect the accuracy of the estimates whereas the estimators become biased and less precise.
We analyse some estimation methods that deal with those problems, in the design-based perspective, and give a special focus to post-stratification procedures. Although these methods are often used in practice, for complex sampling designs the theoretical properties of post-stratification estimators need further research and it’s especially relevant the conditional inference made by [1]. To deal with this difficulty we then address the Without Replacement Bootstrap (BWO) algorithm, proposed by [2] for variance estimation. Applications of three adjustment methods and the BWO algorithm are presented, using data from 1997 Annual Business Survey. The precision of the analysed estimators is discussed and some
recommendations are made regarding their applications under this survey.
2 Methodological issues
To deal with the problem of missing data two strategies are common in survey practice, namely reweighting and imputation. In the former approach missing or incomplete units in the sample are ignored and the inclusion weights (or design weights) for responding units are adjusted by dividing them by estimates of the probability of response.
Estimation in the presence of frame errors is complex. Four relevant types of frame errors can be distinguished during the estimation stage [3]: undercoverage (missing units), overcoverage (inclusion of nonpopulation units), duplicate or multiple listings and incorrect auxiliary information (size, activity, location, etc.).
Adjustment methods that perform the reweighting of the design weights are usually used when unit nonresponse occurs. Among them, post-stratification estimation is often pointed out as an adequate method to handle frame problems as well [4], [3], [5].
domain estimation resulting in a less efficient sample.
The population was divided in two non-overlapping sub-populations. All statistical units with 100 or more workers (major businesses) were included in the sample. Statistical units with less than 100 workers (medium and small businesses) were selected through the sample selection scheme. The performance of several adjustment schemes was investigated using 1997 ABS data concerning the sub-population of medium and small businesses classified in Portugal’s continental territory. The variables used in the study were: mean number of workers (V1), total sales (V2) and total services rendered (V3). Item nonresponse doesn’t occur for these variables.
The analysed estimators were the adjustment cell estimator, the stratified estimator and the post-stratified estimator with adjustment cells. Point estimates for the population total and the population mean were also computed through the Horvitz-Thompson (HT) estimator, although known biased. The next sections discuss those estimators.
2.1 Adjustment cell estimator
In the adjustment cell procedure the obtained sample (including respondents and nonrespondents) is divided in H exhaustive non-overlapping sub-populations called nonresponse adjustment cells, and the response rates are estimated within each cell. For the 1997 ABS data the nonresponse adjustment cells are defined by initial strata. We assume that all units within the same stratum have similar values for the considered variables and equal response probabilities.
Let sh = s1h∪s0h denote the set of sample units
belonging to the hth (h = 1,…, H) nonresponse adjustment cell (with sample size nh); where s1h is the subset of sh composed by respondent units (with n1h elements) and s0h is the subset composed by nonrespondent units (with n0h elements). The subscript 1 (one) refers to respondents and subscript 0 (zero) refers to nonrespondents. Let whk denote the
kth element design weight of the hth adjustment cell. The symbols τ and µ denote the population total and the population mean, respectively.
For an arbitrary sampling design, the adjustment cell estimator (AC) of the population total is
τˆAC =
∑∑
= = H
1 h
n
1 k
hk hk h 1
h
h 1
y w Nˆ
Nˆ
(1)
with yhk the value of the study variable y for the kth
element of the hth adjustment cell and
Nˆh =
∑
=
h
n
1 k
hk
w (2)
Nˆ1h =
∑
=
h 1
n
1 k
hk
w (3)
2.2 Post-stratified
estimator
Post-stratification consists in stratifying the sample data set after the sample has been selected using auxiliary information, namely the population post-strata sizes, which can be derived from administrative registers or can be present in the frame at the moment that estimation takes place. This technique is often used to increase the precision of estimates, in particular when the sample is selected by simple random sampling without replacement.
The 1997 ABS sample was stratified according to three schemes of post-stratification. On the first one, strata were formed by a number of workers classification (variable ENPS with 5 post-strata); on the second one, by a total sales classification (variable EVVN with 2 post-strata) and on the last one by a workers/sales classification (variable ENPS/EVVN with 10 post-strata).
In this case, the nonresponse adjustment cells are defined by pos-strata and therefore we assume that all units within the same post-stratum have equal response probabilities. The population post-strata sizes were provided by Portugal’s National Statistics Institute [6].
Let Ni denote the known population size for
post-stratum i (i = 1,... , L); n1i denote the number of
respondent units within post-stratum i and wik
denote the kth element design weight of the ith stratum. For an arbitrary sampling design, the post-stratified estimator (PS) of the population total is
τˆPS =
∑ ∑
= = L
1 i
n
1 k
ik ik i 1 i
i 1
y w Nˆ
N
(4)
with yik the value of the study variable y for the kth
element of the ith post-stratum (nonresponse adjustment cell) and
Nˆ1i =
∑
=
i 1
n
1 k
ik
w (5)
The post-stratified estimator is denoted by
2.3 Post-stratified estimator with
adjustment cells
A widely used method to deal with unit nonresponse consists in reweighting the design weights by the adjustment cell procedure and adjusting them afterwards by post-stratification. This technique will be named post-stratification with adjustment cells procedure.
For the 1997 ABS data the nonresponse adjustment cells are again defined by initial strata and therefore we assume that all units within the same stratum have similar values for the considered variables and equal response probabilities.
In this case, the sample was stratified according to two schemes of post-stratification. On the first one, strata were formed by a number of workers classification (variable ENPS with 5 post-strata) and on the second one, by a workers/sales classification (variable ENPS/EVVN with 10 post-strata).
To calculate the final weights, the design weights must be first adjusted within every nonresponse adjustment cell h (h = 1,…, H) by the adjustment cell procedure:
w(hkAC) =
h 1
h Nˆ
Nˆ
whk , k∈sh, h = 1, …, H (6)
with Nˆh and Nˆ1h given by (2) and (3), respectively; and whk denotes the kth element design weight of the
hth initial stratum (nonresponse adjustment cell). On the next step these weights are adjusted by post-stratification (L post-strata cut across nonresponse adjustment cells):
w(ikACPS) = (ikAC)
* i 1
i w
Nˆ N
, k∈si, i = 1, …, L (7)
with w(ikAC) the adjusted weight (6) of the kth
element within the ith post-stratum; si the set of
sample units of the ith post-stratum and Nˆ1*i is now defined by
Nˆ*1i =
∑
=
i 1
n
1 k
) AC ( ik
w (8)
For an arbitrary sampling design, the post-stratified estimator with adjustment cells (ACPS) of the population total is
τˆACPS =
∑∑
= =
L
1 i
n
1 k
ik ) ACPS ( ik
i 1
y
w (9)
with w(ikACPS) the final weight (7) and yik the value
of the study variable y for the kth element of the ith post-stratum.
The post-stratified estimator with adjustment cells is denoted by ACPS_ENPS and
ACPS_ENPS/EVVN when refers to one of the two post-stratification schemes mentioned above, respectively.
2.4 Variance
estimation
For complex sampling designs it seems difficult to investigate the properties of estimators (1), (4) and (9). For simple random sampling without replacement, the post-stratified estimator has smaller mean squared error than the adjustment cell estimator [3], [4]. It is to be expected that this would also happen for other survey designs.
The estimator proposed by [1] for an arbitrary sampling design was used for variance estimation of the post-stratified estimator, as it agrees with known, conditionally correct results, without the presence of nonresponses, in the special case of simple random sampling without replacement.
When nonresponse occurs it seems even more difficult to investigate the properties of the post-stratified estimator. However, that variance estimator may have good properties as well, in a conditional approach, if units have similar values for the considered variables and equal response probabilities within every post-stratum.
It wasn’t possible for us to locate in literature variance estimators of (1) and (9) that apply to the ABS sampling design (stratified simple random sampling without replacement). To overcome this difficulty we then address the Without Replacement Bootstrap (BWO) algorithm, proposed by [2], for variance estimation.
Variance estimates were determined with the Monte Carlo approximation and 1000 bootstrap samples were drawn from the pseudopopulation created by means of the BWO algorithm.
3 Discussion
The performance of several adjustment schemes was investigated using 1997 ABS data and summary results are presented on Tables 1, 2 and 3. Detailed results and a similar study for 1996 ABS data can be found in [6].
Table 1 - Estimates for the population mean for variable V1
Estimator Mean Std. deviation
HT 2.03 0.0173
AC 2.71 -
PS_ENPS 2.88 0.0173*
ACPS_ENPS 2.85 -
PS_EVVN 8.94 0.0872*
PS_ENPS/EVVN 4.50 0.0346*
ACPS_ENPS/EVVN 4.46 -
Bootstrap estimates
Estimator
Std. deviation
Coeff. of variation
(%)
HT - -
AC 0.0173 1.09
PS_ENPS 0.0200 0.67
ACPS_ENPS 0.0224 0.74
PS_EVVN - -
PS_ENPS/EVVN 0.0400 0.84
ACPS_ENPS/EVVN 0.0436 0.91
* Estimates computed using the estimator proposed by [1]
As discussed above, one would expect that post-stratification estimators would perform better than the adjustment cell estimator (AC) but that hasn’t occurred with the PS_EVVN estimator since population mean estimates seem to be highly biased. However, this is a natural conclusion as for this post-stratification scheme only two post-strata were defined. Therefore the assumption of post-strata homogeneity is false. For that reason bootstrap estimates for the PS_EVVN estimator weren’t computed. As expected, bootstrap estimates for the
AC estimator also seem biased.
Both post-stratification estimators (PS and
ACPS) reveal a similar performance when using the same post-stratification scheme (ENPS or ENPS/EVVN). Recall from sections 2.2 and 2.3 that the PS estimator assumes post-strata as the nonresponse adjustment cells and that the ACPS
estimator assumes initial strata as those cells. The pointed similarity derives from the fact that the variable ENPS (number of workers classification) was used for initial stratification and for post-stratification.
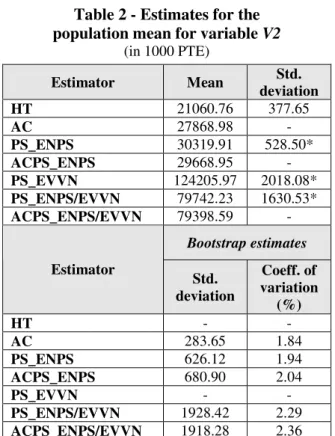
Table 2 - Estimates for the population mean for variable V2
(in 1000 PTE)
Estimator Mean Std. deviation
HT 21060.76 377.65
AC 27868.98 -
PS_ENPS 30319.91 528.50*
ACPS_ENPS 29668.95 -
PS_EVVN 124205.97 2018.08*
PS_ENPS/EVVN 79742.23 1630.53*
ACPS_ENPS/EVVN 79398.59 -
Bootstrap estimates
Estimator
Std. deviation
Coeff. of variation
(%)
HT - -
AC 283.65 1.84
PS_ENPS 626.12 1.94
ACPS_ENPS 680.90 2.04
PS_EVVN - -
PS_ENPS/EVVN 1928.42 2.29
ACPS_ENPS/EVVN 1918.28 2.36
* Estimates computed using the estimator proposed by [1]
Table 3 - Estimates for the population mean for variable V3
(in 1000 PTE)
Estimator Mean Std. deviation
HT 5735.40 165.17
AC 8007.16 -
PS_ENPS 8043.40 238.51*
ACPS_ENPS 8336.61 -
PS_EVVN 30209.56 906.20*
PS_ENPS/EVVN 16772.26 828.23*
ACPS_ENPS/EVVN 17668.88 -
Bootstrap estimates
Estimator
Std. deviation
Coeff. of variation
(%)
HT - -
AC 104.10 2.56
PS_ENPS 243.30 2.87
ACPS_ENPS 221.17 2.59
PS_EVVN - -
PS_ENPS/EVVN 850.26 4.88
ACPS_ENPS/EVVN 661.02 4.09
* Estimates computed using the estimator proposed by [1]
post-stratification scheme performed better than the ENPS/EVVN scheme.
When one must choose between post-stratification schemes, the option should take into consideration post-strata homogeneity. Auxiliary variables should be related to the study variable for a reduction of the design variance.
If other proper post-stratification schemes were available (assuming that population post-strata sizes were known) it would also be interesting to investigate the performance of both post- stratification estimators.
The bootstrap estimates for the coefficients of variation indicate that the PS_ENPS estimator performs a little better than the ACPS_ENPS
estimator, except for variable total sales (V2). These results suggest that the PS_ENPS
estimator holds better results than the other adjustment methods.
Observed similarities between bootstrap variance estimates and those ones computed using the estimator proposed by [1] are due to the fact that the number of units within the intersection of initial strata and post-strata is very large. However, if this doesn’t happen or if other variables were used (other study or post-stratification variables) this estimator could perform worse.
The above discussion implies that the post-stratified estimator using the ENPS post-stratification scheme (PS_ENPS) and the variance estimator proposed by [1] are appropriate techniques under this survey. Note that in this case the computational effort for computing bootstrap estimates can be avoided.
4 Conclusion
The application of adjustment methods to the 1997 ABS data was motivated by issues related with frame problems and unit nonresponse. As expected from theoretical evidences and according to the above discussion we conclude that post-stratification methods perform better over the situations considered here. Moreover, the post-stratified estimator using the ENPS post-stratification scheme (PS_ENPS) turn out to be the most appropriate under this survey.
For the considered variables, the bootstrap variance estimates of the post-stratified estimator and those ones computed using the variance estimator proposed by [1] are similar. However, we must call attention to the fact that this estimator underestimates the true variance of the post-stratified estimator.
The main purpose of post-stratification estimators is to deal with frame imperfections. Since the nonresponse rate is high under this survey we would like to suggest for future investigations the application of these adjustment methods simultaneously with other procedures that handle missing values, such as multiple imputation methods.
References:
[1] J. N. K. Rao, Conditional inference in survey sampling, Survey Methodology, Vol.11, No.1, 1985, pp. 15-31.
[2] R. R. Sitter, Comparing three Bootstrap methods for survey data, The Canadian Journal of Statistics, Vol.20, No.2, 1992, pp. 135-154. [3] J. T. Lessler and W. D. Kalsbeek, Nonsampling
Error in Surveys, Wiley Series in Probability and Mathematical Statistics, John Wiley & Sons, New York, 1992.
[4] R. J. A. Little, Survey nonresponse adjustments for estimates of means, International Statistical Review, Vol.54, No.2, 1986, pp. 139-157.
[5] L. C. Lazzeroni and R. J. A. Little, Random-effects models for smoothing poststratification weights, Journal of Official Statistics, Vol.14, No.1, 1998, pp. 61-78.