1Universidade Federal de Alagoas, Faculdade de Nutrição, Programa de Pós-Graduação em Nutrição. Campus AC Simões, Av. Lourival Melo Mota, s/n., Cidade Universitária, 57072-900, Maceió, AL, Brasil. Correspondência para/Correspondence to: G LONGO-SILVA. E-mail: <[email protected]>.
2Universidade Federal de Lavras, Departamento de Nutrição, Setor Saúde Pública. Lavras, MG, Brasil.
Factors associated with regular
consumption of obesogenic foods:
National School-Based Student
Health Hurvey, 2012
Fatores associados ao consumo regular de alimentos
obesogênicos
:
Pesquisa Nacional
de Saúde do Escolar, 2012
Giovana LONGO-SILVA1
Risia Cristina Egito de MENEZES1
Camila Alves Nogueira de SOUZA1
Patrícia de Menezes MARINHO1
Maysa Helena de Aguiar TOLONI2
Maria Alice Araújo de OLIVEIRA1
A B S T R A C T
Objective
To investigate the frequency of consumption of obesogenic foods among adolescents and its association with sociodemographic, family, behavioral, and environmental variables.
Methods
Secondary data from the National School-Based Student Health Hurvey were analyzed from a representative sample of 9th grade Brazilian students (high school). A self-administered questionnaire, organized into thematic
Results
Regular food consumption ranged from 27.17% to 65.96%. The variables female gender, mobile phone ownership, Internet access at home, tobacco use, alcohol consumption, regular physical activity, eating while watching television or studying, watching television for at least 2 hours a day, and not willing to lose weight were associated in the final logistic models of all foods analyzed.
Conclusion
It was concluded that fried snacks, packaged snacks, sugar candies, and soft drinks are regularly consumed by adolescents and that such consumption was associated with the sociodemographic, family, behavioral, and school structural variables.
Keywords: Adolescent. Food consumption. Food habits. Industrialized foods.
R E S U M O
Objetivo
Analisar a frequência de consumo de alimentos obesogênicos entre adolescentes e sua associação com variáveis sociodemográficas, familiares, comportamentais e ambientais.
Métodos
Estudou-se dados secundários da Pesquisa Nacional de Saúde do Escolar, sendo a amostra representativa de alunos do 9º ano do ensino fundamental de escolas brasileiras. Utilizou-se questionário autoaplicável organizado em blocos temáticos. Foram consideradas variáveis dependentes o consumo de salgados fritos, salgadinhos de pacote, guloseimas e refrigerantes, cuja frequência se referiu aos sete dias anteriores à pesquisa. Para associação do consumo regular dos alimentos (≥3 dias/semana) às variáveis sociodemográficas, familiares, comportamentais e estruturais da escola, foi utilizada análise bivariada, adotando-se o critério de valor de p<0,20 para inclusão inicial na análise de regressão logística multivariada, a qual foi realizada pelo método “enter”. Os resultados foram expressos por Odds Ratio ajustados com respectivos intervalos de confiança de 95%, considerando associação estatisticamente significativa o valor de p<0,05.
Resultados
O consumo regular dos alimentos variou de 27,17% a 65,96%. Sexo feminino, posse de telefone celular, acesso à Internet no domicílio, tabagismo, consumo de álcool, prática regular de atividade física, hábito de comer assistindo televisão ou estudando, assistir televisão no mínimo duas horas/dia e ausência de atitude visando perda de peso foram as variáveis que se associaram nos modelos logísticos finais de todos os alimentos.
Conclusão
Conclui-se que o consumo de salgados fritos, salgadinhos de pacote, guloseimas e refrigerantes é regular na dieta dos adolescentes, estando seu consumo associado a variáveis sociodemográficas, familiares, com-portamentais e de estrutura escolar.
Palavras-chave: Adolescente. Consumo de alimentos. Hábitos alimentares. Alimentos industrializados.
I N T R O D U C T I O N
The term obesogenic refers to foods that promote gaining weight and that are not conducive to weight loss thus contributing to the
obesity1. These foods include fast foods,
mass-produced foods that are prepared and served very quickly, usually in quick-service or self-service restaurants using pre-prepared ingredients. Some
examples are hamburgers, French fries, pizza2,
and ultra-processed foods, which refer to those
that are ready for consumption or heating with little or no preparation, such as a packaged snacks, cookies and crackers, sweet hard candies
(including lollipop sticks), and soft drinks3.
The prevalence of obesity has increased dramatically in recent decades, affecting one in
five adolescents in western countries4. Obesity in
increased prevalence of cardiovascular risk factors, insulin resistance, type 2 diabetes, some types of cancers, low self-esteem, and reduced quality of life5.
Adolescent obesity can be attributed to endogenous causes related to specific behavioral characteristics defined by social bonding, social status, independence, and peer influence leading to sedentary behaviors, such as extensive television viewing and use of other electronic media, physical inactivity, eating away from home,
and increased consumption of obesogenic foods6.
These foods are high in calories, total fat (saturated and trans fat), sugars, sodium, chemical
food additives, and preservatives3, and are low in
fiber, calcium, and iron. Their consumption is inversely associated with the consumption of
fruits, vegetables, and milk7.
Despite their harmful effects, convenience, affordability, palatability, and aggressive marketing are factors that contribute to keeping these food sin the daily diet. In Brazil, an analysis
of the Pesquisas de Orçamentos Familiares
(Household Budget Surveys) (1987-1988, 1995-1996, 2002-2003, and 2008-2009), showed that the caloric contribution of ultra-processed foods (soft drinks, sugary drinks, encased meats, cookies and crackers, chocolates, sweets, and packaged snacks) to the total caloric value of the diet in the households increased
linearly and significantly from 18.7% to 29.6%8.
Thus, the analysis of the consumption frequency of these foods has been included into the adolescent health risk factor surveillance systems, which has been implemented following a recommendation by the World Health Organization (WHO). Therefore, inspired by systems of other countries, such as the Health
Behavior in School-Aged Children9, Brazil
conducted two national surveys in 2009 and
2012, which consisted of the Pesquisa Nacional
de Saúde do Escolar (PeNSE, National School-Based Student Health Survey).
The present study aims, therefore, to investigate the frequency of consumption of
obesogenic foods among adolescents and the sociodemographic, family, behavioral, and environmental factors associated with their
regular consumption based on data from PeNSE
--2012.
M E T H O D S
Study population
This study analyzed data from the second
edition of the PeNSE, conducted by the Instituto
Brasileiro de Geografia e Estatística (IBGE, Brazilian Institute of Geography and Statistics) in partnership with the Ministry of Health. That survey was conducted from April to September 2012, and the study population was composed
of 9th grade students (high school) attending public
and private schools during the day.
This isa representative sample of the country, including the 5 macro-regions, the 26 state capitals, and the Federal District. Sample size was calculated considering 50% exposure prevalence, maximum error of 3%, and 95% Confidence Interval (95%CI).
The sample of each geographic stratum was allocated in proportion to the number of schools, according to their administrative dependency (private or public schools). For each of these strata, a two-stage cluster sampling was used; in the first stage, the schools were selected, and in the second stage, the eligible classes in
these schools were selected (high school 9th
graders). Thus, 132,123 students were invited to answer the questionnaire. However, at the time of data collection, only 110,873 were present, of which 1,651 declined to participate and 118 did not inform gender or age, and were thus excluded from the data base. The final sample was then composed of 109,104 students, representing a sample loss of 17.4%.
mentioned above. Therefore, it should represent
the target population, formed by high school 9th
graders who were regularly attending private and public schools during the day in the state capitals and the Federal District.
Data collection
Data were collected using mobile phones (smartphones); a self-report structured questionnaire was uploaded on the mobile devices. The questionnaire was organized into thematic blocks that included: sociodemographic characteristics, diet, body image, physical activity, tobacco use, alcohol and drug consumption, social protection network, oral health, sexual behavior, violence, and accidents. In addition to the information listed above, data related to work, hygiene, mental health, use of healthcare services, and prevalence of asthma were also collected.
Dependent variables
The dependent variables were the consumption of four foods, food groups, or prepared foods: deep fried snacks - such as French
fries or coxinha de galinha (popular food in Brazil
consisting of chopped or shredded chicken meat, covered in dough, molded into a shape resembling a chicken leg, battered and fried), deep fried
kebab, pastel (a traditional deep fried Brazilian
pastry filled with various sweet or savory
ingredients), acarajé (a dish made from peeled
beans formed into a ball and then deep-fried in palm oil), etc., - packaged snacks (including potato chips), sugar candies (sweets, hard candies, chocolates, chewing gum, and lollipop sticks), and soft drinks. Their consumption frequency for seven days preceding the study was analyzed.
Food consumption was expressed as absolute and relative frequencies, according to gender. For purposes of analysis, the variables were categorized as follows: consumption 3 or more days and 2 or fewer days in the seven days
preceding the study10,11.
Independent variables
The independent variables were divided into sociodemographic: gender (male or female),
age (≤14 years or >14 years), currently employed
(yes or no), household composition (≤4 persons
or >4 persons); home computer ownership (yes or no), Internet access at home (yes or no), mobile phone ownership (yes or no); family characteristics: maternal level of education (<9
years or ≥9 years), living with the mother (yes or
no), living with the father (yes or no); Behavioral: current use of tobacco (yes or no), current consumption of alcohol (yes or no), physical
activity (≥3 days or <3 days in the last 7 days),
eating family meals (parents or guardians) (≥3 days
a week or <3 days a week), eating while watching
television or studying (≥3 days a week or <3 days
a week), breakfast habits (≥3 days a week or <3
days a week), time spent watching television (≥2
hours, <2 hours), willingness to lose weight (yes or no); school structural: cafeteria (yes or no) and sports facilities (yes or no).
With regard to the variables current use of tobacco and current consumption of alcohol, use and consumption frequency for thirty days preceding the administration of the questionnaire was analyzed.
Data analysis
For the descriptive analysis, the independent variables were categorized estimating the total population proportion, according to the gender.
According to sociodemographic, family, behavioral, and school structural characteristics,
regular food consumption (≥3 days a week) was
determined by simple frequency and confidence intervals. Bivariate analysis was used to investigate the factors associated with this eating habit. The chi-square test with Yates correction for dichotomous variables was used to compare the categorical variables of the groups, considering
To analyze the factors associated with regular food consumption, four multiple logistic regression models were used with the following outcomes: fried snacks, packaged snacks, sugar candies, and soft drinks. The variables with
p<0.20 in the bivariate analysis were selected
for initial inclusion in the multivariate logistic
regression analysis. Odds ratios of regular
food consumption (crude and adjusted for confounders) were calculated for each exposure variable.
Multiple logistic regression analysis was carried out using the “Enter” method. The results
were expressed as adjusted ratios with 95%CI,
and variables with p<0.05 indicated a statistically
significance.
Statistical analyses were performed using
the Stata® software version 13.0 (Stata Corp,
College Station, TX, USA) with the svy commands (survey commands), which are used for complex survey data analysis and include the required sampling weights, strata, and Primary Sampling Unit. The variables that were not answered (missing values) were excluded from the analysis.
Ethical aspects
Pesquisa Nacional de Saúde do Escolar was
approved by the Comissão Nacional de Ética em
Pesquisa (CONEP), appointed by the Ministry of Health (Protocol nº16.805), and authorized by the State and Municipal Departments of Education and the school board of the selected schools in each municipality.
R E S U L T S
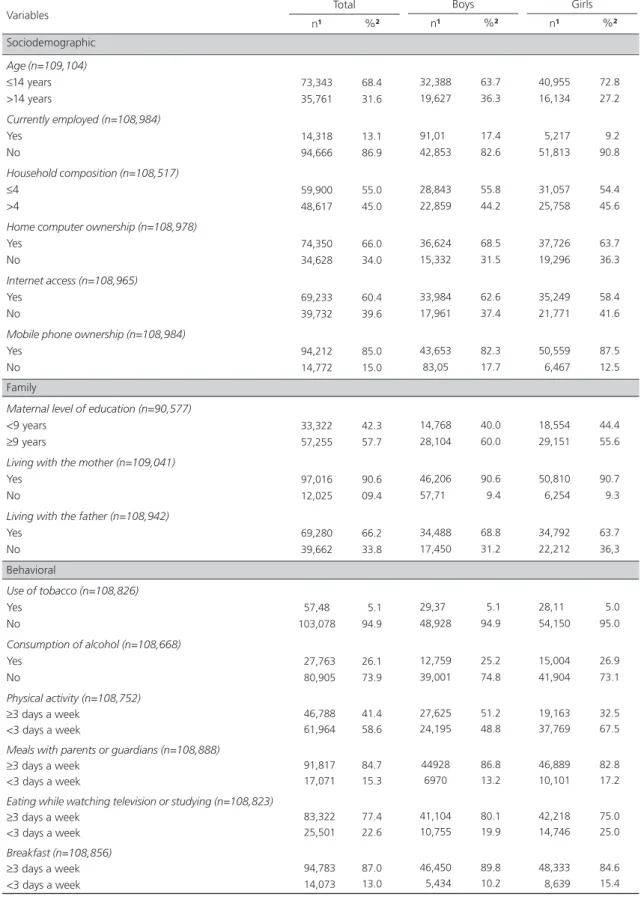
The sociodemographic characterization of the 109,104 adolescents studied showed a predominance of females (57.1%) and age range of 11-19 years or more; the highest number of adolescents were aged below 14 years (68.4%). Most students did not have a job and did not have a computer, mobile phone, and Internet access at home. With regard to the family aspects,
about 10% and 30% of the students did not live with their mother and father, respectively (Table 1). As for the behavioral characteristics, less than half reported doing physical activities 3 or more days a week, with the higher percentage among the boys. It was also found that more than 75% of the students frequently (3 or more days a week) at eat least one of the meals with their parents or guardians, ate while watching television or studying, and did not eat the food offered at school.
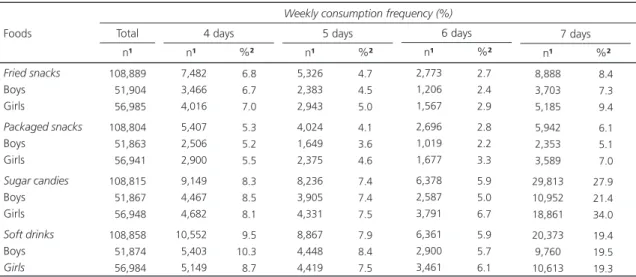
In terms of the consumption of the food groups investigated in the present study (fried snacks, packaged snacks, sugar candies, and soft drinks), it was found that the proportion of students who regularly (three or more days a week) consumed these foods ranged between 27.17% and 65.96%. The proportion of students who regularly consumed sugar candies (60.9%) and soft drinks (56.2%) was higher than that of those who regularly consumed packaged snacks (27.1%) and fried snacks (35.6%) (Table 2).
Analyzing these indicators of obesogenic food consumption, according to the sociodemographic variables for the students evaluated (Table 3), it was observed that the percentage of regular consumption of all foods
analyzed was higher (p<0.05) among those that
had Internet access and owned a home computer and a mobile phone.
The analysis of the association between the variables related to behavioral characteristics, the consumption of obesogenic foods was higher among those who smoked, consumed alcohol, did physical activities three days or more days a week, watched television for more than two hours, and usually ate while watching TV or studying (Table 3). The same results were found in all final explanatory models after adjusting the variables (Table 4).
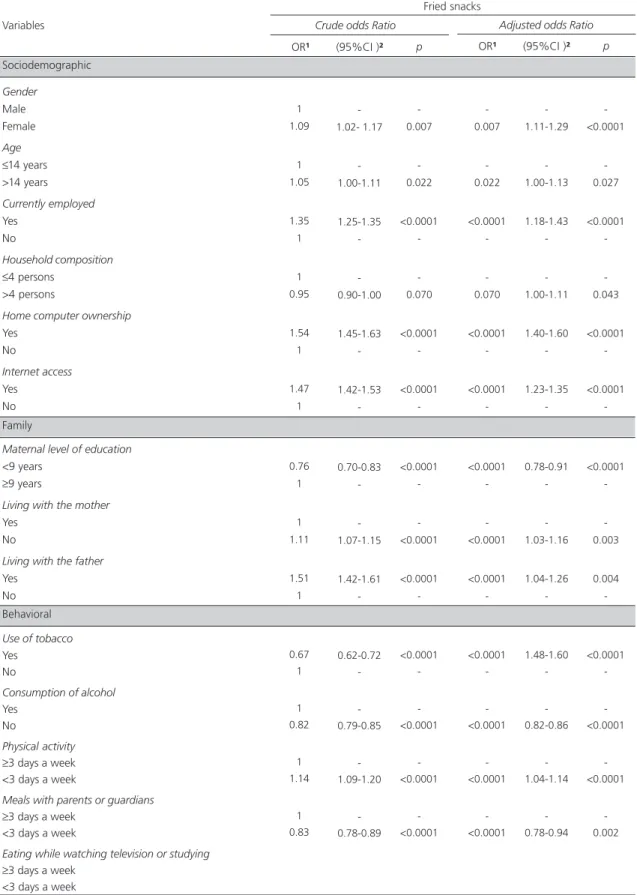
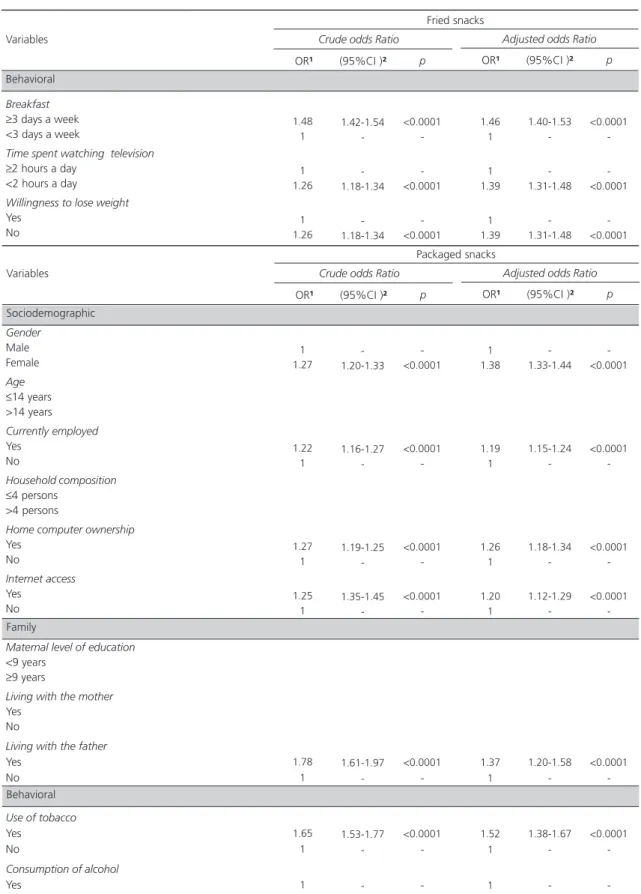
Table 4 shows the crude and adjusted odds
Table 1. Distribution of the population studied according to sociodemographic, family, behavioral, and school structural characteristics. Brazil, 2012.
1 of 2
Age (n=109,104) ≤14 years >14 years
Currently employed (n=108,984)
Yes No
Household composition (n=108,517) ≤4
>4
Home computer ownership (n=108,978)
Yes No
Internet access (n=108,965)
Yes No
Mobile phone ownership (n=108,984)
Yes No
Maternal level of education (n=90,577)
<9 years
≥9 years
Living with the mother (n=109,041)
Yes No
Living with the father (n=108,942)
Yes No Behavioral
Use of tobacco (n=108,826)
Yes No
Consumption of alcohol (n=108,668)
Yes No
Physical activity (n=108,752) ≥3 days a week
<3 days a week
Meals with parents or guardians (n=108,888) ≥3 days a week
<3 days a week
Eating while watching television or studying (n=108,823) ≥3 days a week
<3 days a week
Breakfast (n=108,856) ≥3 days a week <3 days a week
73,343 35,761 14,318 94,666 59,900 48,617 74,350 34,628 69,233 39,732 94,212 14,772 33,322 57,255 97,016 12,025 69,280 39,662
057,480
103,078 027,763 080,905 046,788 061,964 091,817 017,071 083,322 025,501 094,783 014,073 68.4 31.6 13.1 86.9 55.0 45.0 66.0 34.0 60.4 39.6 85.0 15.0 42.3 57.7 90.6 09.4 66.2 33.8 05.1 94.9 26.1 73.9 41.4 58.6 84.7 15.3 77.4 22.6 87.0 13.0 Variables Sociodemographic
n¹ %²
Total 32,388 19,627 91,010 42,853 28,843 22,859 36,624 15,332 33,984 17,961 43,653
083,050
14,768 28,104 46,206 57,710 34,488 17,450
029,3700
48,928 12,759 39,001 27,625 24,195 44928
069700
41,104 10,755 46,450 05,434 63.7 36.3 17.4 82.6 55.8 44.2 68.5 31.5 62.6 37.4 82.3 17.7 40.0 60.0 90.6 09.4 68.8 31.2 05.1 94.9 25.2 74.8 51.2 48.8 86.8 13.2 80.1 19.9 89.8 10.2
n¹ %²
Boys Family 40,955 16,134 05,217 51,813 31,057 25,758 37,726 19,296 35,249 21,771 50,559 06,467 18,554 29,151 50,810 06,254 34,792 22,212 28,110 54,150 15,004 41,904 19,163 37,769 46,889 10,101 42,218 14,746 48,333 08,639 72.8 27.2 09.2 90.8 54.4 45.6 63.7 36.3 58.4 41.6 87.5 12.5 44.4 55.6 90.7 09.3 63.7 36,3 05.0 95.0 26.9 73.1 32.5 67.5 82.8 17.2 75.0 25.0 84.6 15.4
n¹ %²
Table 1. Distribution of the population studied according to sociodemographic, family, behavioral, and school structural characteristics. Brazil, 2012.
2 of 2
Time spent watching television (n=108,792) ≥2 hours a day
<2 hours a day
Willingness to lose weight (n=108.447)
Yes No
School food consumption (n=108,854) ≥3 days a week
<3 days a week
Cafeteria (N=108,837)
Yes No
Sports facilities (N=108,795)
Yes No 067,672 041,120 029,144 079,303 022,753 086,101 55,645 53,192 88,534 20,261 63.6 36.4 26.3 73.7 20.9 79.1 51.1 48.9 79.4 20.6 30,821 21,024 11,119 40,493 12,079 39,802 26,961 24,937 42,609 9,270 60.5 39.5 21.1 78.9 23.3 76.7 50.3 49.7 81.0 19.0 School structural 36,851 20,096 18,025 38,810 10,674 46,299 28,684 28,255 45,925 10,991 66.6 33.4 31.1 68.9 18.7 81.3 47.6 52.4 77.9 22.1
Note: ¹Number of individuals in the unweighted sample; ²Prevalence calculated as weighted confidence interval due to the sampling design. Variables
Behavioral
n¹ %²
Total
n¹ %²
Boys
n¹ %²
Girls
Table 2. Distribution of the population studied in terms of the frequency of consumption of obsegenic foods according to gender. Brazil, 2012. Fried snacks Boys Girls Packaged snacks Boys Girls Sugar candies Boys Girls Soft drinks Boys Girls Foods 108,889 051,904 056,985 108,804 051,863 056,941 108,815 051,867 056,948 108,858 051,874 056,984 07,482 03,466 04,016 05,407 02,506 02,900 09,149 04,467 04,682 10,552 05,403 05,149 06.8 06.7 07.0 05.3 05.2 05.5 08.3 08.5 08.1 09.5 10.3 08.7 Total
n¹ n¹ %²
4 days
Weekly consumption frequency (%)
5,326 2,383 2,943 4,024 1,649 2,375 8,236 3,905 4,331 8,867 4,448 4,419 4.7 4.5 5.0 4.1 3.6 4.6 7.4 7.4 7.5 7.9 8.4 7.5
n¹ %²
5 days 2,773 1,206 1,567 2,696 1,019 1,677 6,378 2,587 3,791 6,361 2,900 3,461 2.7 2.4 2.9 2.8 2.2 3.3 5.9 5.0 6.7 5.9 5.7 6.1
n¹ %²
6 days 8,888 3,703 5,185 5,942 2,353 3,589 29,813 10,952 18,861 20,373 9,760 10,613 08.4 07.3 09.4 06.1 05.1 07.0 27.9 21.4 34.0 19.4 19.5 19.3
n¹ %²
7 days
Note: ¹Number of individuals in the unweighted sample; ²Prevalence calculated as weighted confidence interval due to the sampling design.
multiple logistic regression analysis. Among the factors that remained in the final model as factors associated with the consumption of fried snacks and packaged snacks, the variables female gender, currently employed, Internet access,
Sociodemographic
Table 3. Regular consumption (≥3 days a week) of obesogenic foods among adolescents, prevalence, and respective 95% confidence intervals, according to sociodemographic, family, behavioral, and school structural characteristics. Brazil, 2012.
1 of 6
Gender
Male Female
Age ≤14 years >14 years
Currently employed
Yes No
Household composition ≤4 persons
>4 persons
Home computer ownership
Yes No
Internet access
Yes No
Mobile phone ownership
Yes No
Maternal level of education
<9 years
≥9 years
Living with the mother
Yes No
Living with the father
Yes No
Use of tobacco
Yes No
Consumption of alcohol
Yes No
Physical activity ≥3 days a week <3 days a week
Meals with parents or guardians ≥3 days a week
<3 days a week
Eating while watching television or studying ≥3 days a week
<3 days a week
108,889
108,889
108,845
108,387
108,847
108,831
108,848
090,456
108,850
108,761
108,732
108,574
108,666
108,792
108,734 Variables
n¹ %² (95%CI)² p*
Family
Behavioral
n¹
Fried snacks
17,615 20,765
25,366 13,014
05,936 32,430
21,494 16,738
28,090 10,269
26,798 11,557
34,308
04,058
10,661 21,701
34,090
04,277
23,812 14,517
02,673 35,639
12,400 25,852
17,543 20,747
31,796
06,543
30,069
08,243
34.6 36.7
35.3 36.6
41.9 34.8
36.2 35.1
38.5 30.3
39.6 29.8
37.0 28.4
32.7 38.7
35.6 36.3
34.8 37.3
45.2 35.2
44.7 32.5
38.4 33.8
35.2 38.4
36.6 32.6
32.87-36.33 35.16-38.32
33.76-36.83 35-38.24
39.22-44.57 33.41-36.15
34.8-37.63 33.46-36.86
37.37-39.61 27.95-32.71
38.49-40.68 27.8-31.78
35.6-38.38 26.6-30.32
30.63-34.8 37-3740
34.14-37.16 34.96-37.7
33.33-36.41 35.96-38.69
42.9-47.43 33.83-36.58
42.71-46.71 31.19-33.88
36.61-40.12 32.59-35.1
33.83-36.63 36.5-40.27
35.09-38.14 30.85-34.33
<0.0069
<0.0223
<0.0001
<0.0718
<0.0001
<0.0001
<0.0001
<0.0001
0.3710
<0.0001
<0.0001
<0.0001
<0.0001
<0.0001
Table 3. Regular consumption (≥3 days a week) of obesogenic foods among adolescents, prevalence, and respective 95% confidence intervals, according to sociodemographic, family, behavioral, and school structural characteristics. Brazil, 2012.
2 of 6
Breakfast ≥3 days a week <3 days a week
Time spent watching television ≥2 hours a day
<2 hours a day
Willingness to lose weight
Yes No
School food consumption ≥3 days a week <3 days a week
Cafeteria
Yes No
Sports facilities
Yes No
Gender
Male Female
Age ≤14 years >14 years
Currently employed
Yes No
Household composition ≤4 persons
>4 persons
Home computer ownership
Yes No
Internet access
Yes No
Mobile phone ownership
Yes No
Maternal level of education
<9 years
≥9 years
108,761
108,698
108,355
108,766
108,622
108,580
108,804
108,804
108,762
108,305
108,764
108,752
108,772
90,373
33,041
05,287
25,849 12,452
09,168 29,017
07,343 30,991
20,698 17,572
31,723
06,528
11,771 15,405
17,769
09,407
04,116 23,048
14,878 12,160
19,390
07,771
18,455
08,700
24,214
02,952
08,186 14,656
35.4 37.4
38.9 30.0
31.8 37.1
33.2 36.4
37.7 33.8
36.6 32.1
24.7 29.4
26.8 28.1
30.7 26.6
27.0 27.4
28.4 24.8
29.0 24.3
28.0 22.4
26.7 28.1
33.89-37.03 36.26-38.6
37.45-40.43 28.52-31.53
30.77-32.88 35.37-38.81
30.68-35.88 34.76-37.98
36.17-39.18 31.72-35.98
35.14-38.15 30.07-34.24
23.52-25.92 28.3-30.61
25.48-28.1 26.9-29.25
29.11-32.36 25.7-27.61
26.21-27.88 26.06-28.67
27.74-29.04 22.95-26.78
28.36-29.73 22.8-25.91
26.98-29.09 21.1-23.68
24.67-28.81 27.48-28.65
<0.0056
<0.0001
<0.0001
<0.0359
<0.0010
<0.0002
<0.0001
<0.0934
<0.0001
<0.4468
<0.0001
<0.0001
<0.0001
<0.1424 Family
Behavioral Variables
n¹ n¹ %² (95%CI)² p*
Fried snacks
Sociodemographic Variables
n¹ n %² (95%CI)² p*
¹
Table 3. Regular consumption (≥3 days a week) of obesogenic foods among adolescents, prevalence, and respective 95% confidence intervals, according to sociodemographic, family, behavioral, and school structural characteristics. Brazil, 2012.
3 of 6
Living with the mother
Yes No
Living with the father
Yes No
Use of tobacco
Yes No
Consumption of alcohol
Yes No
Physical activity ≥3 days a week <3 days a week
Meals with parents or guardians ≥3 days a week
<3 days a week
Eating while watching television or studying ≥3 days a week
<3 days a week
Breakfast ≥3 days a week <3 days a week
Time spent watching television ≥2 hours a day
<2 hours a day
Willingness to lose weight
Yes No
School food consumption ≥3 days a week <3 days a week
Cafeteria
Yes No
Sports facilities
Yes No
Gender
Male Female
108,766
108,680
108,673
108,515
108,612
108,733
108,673
108,706
108,639
108,294
108,703
108,537
108,495
108,815
24,123
03,043
16,907 10,233
02,084 25,057
09,042 18,047
12,564 14,560
22,605
04,553
21,553
05,581
23,472
03,676
18,907
08,226
06,210 20,812
05,566 21,582
13,657 13,456
22,085
05,017
28,291 37,675
27.2 27.4
26.6 28.3
39.2 26.5
34.8 24.5
29.3 25.7
26.9 28.9
28.0 24.2
27.1 27.7
30.3 21.6
23.3 28.5
26.8 27.3
27.1 27.2
27.7 25.3
54.7 66.7
26.15-28.19 26.12-28.63
25.5-27.75 27.36-29.22
36.56-41.83 25.67-27.43
32.87-36.86 23.67-25.27
27.77-30.93 24.96-26.39
25.82-27.92 27.55-30.35
27.01-29.05 23.1-25.38
26.07-28.14 26.8-28.63
29.16-31.53 20.9-22.41
22.19-24.43 27.38-29.67
25.61-28.01 26.26-28.32
25.21-29.13 25.74-28.8
26.74-28.62 23.24-27.55
51.7-57.58 64.17-69.07
<0.7142
<0.0001
<0.0001
<0.0001
<0.0001
<0.0033
<0.0001
<0.0649
<0.0001
<0.0001
<0.3037
<0.9359
<0.0455
<0.0001 Behavioral
Family Variables
n¹ n¹ %² (95%CI)² p*
Packaged snacks
Sociodemographic Variables
n¹ n¹ %² (95%CI)² p*
Sociodemographic
Table 3. Regular consumption (≥3 days a week) of obesogenic foods among adolescents, prevalence, and respective 95% confidence intervals, according to sociodemographic, family, behavioral, and school structural characteristics. Brazil, 2012.
4 of 6
Age ≤14 years >14 years
Currently employed
Yes No
Household composition ≤4 persons
>4 persons
Home computer ownership
Yes No
Internet access
Yes No
Mobile phone ownership
Yes No
Maternal level of education
<9 years
≥9 years
Living with the mother
Yes No
Living with the father
Yes No
Use of tobacco
Yes No
Consumption of alcohol
Yes No
Physical activity ≥3 days a week <3 days a week
Meals with parents or guardians ≥3 days a week
<3 days a week
Eating while watching television or studying ≥3 days a week
<3 days a week
Breakfast ≥3 days a week <3 days a week
108,815
108,773
108,317
108,775
108,763
108,780
90,384
108,775
108,689
108.680
108,531
108,621
108,744
108,683
108,712 Variables
n¹ n¹ %² (95%CI)² p*
Sugar candies
45,824 20,142
08,711 57,237
36,722 28,994
46,569 19,376
43,730 22,210
58,138
07,810
19,210 35,728
58,771
07,175
41,616 24,294
03,918 61,973
18,969 46,841
29,267 36,603
55,077 10,849
50,939 14,953
56,905
09,008
63.0 56.5
61.5 60.8
61.7 60.1
63.2 56.4
63.7 56.7
62.3 53.3
58.0 63.2
61.0 60.5
60.6 61.6
69.0 60.5
68.7 58.2
63.5 59.2
60.3 64.3
61.4 59.2
60.4 64.5
60.7-65.19 54.48-58.45
60.11-62.96 58.11-63.52
58.6-64.69 58.05-62.17
60.02-66.34 54.38-58.46
60.4-66.93 54.5-58.8
59.61-64.84 51.96-54.66
55.57-60.37 60.26-66
58.35-63.52 59.16-61.9
57.83-63.26 59.6-63.67
66.47-71.32 58.1-62.86
66.71-70.63 55.61-60.77
60.92-65.99 56.72-61.55
57.81-62.8 61.66-66.9
59.04-63.74 56.25-62.15
57.83-62.93 62.26-66.68
<0.0001
<0.5608
<0.1117
<0.0001
<0.0001
<0.0001
<0.0001
<0.6294
<0.0384
<0.0001
<0.0001
<0.0001
<0.0001
<0.0001
<0.0001 Family
Table 3. Regular consumption (≥3 days a week) of obesogenic foods among adolescents, prevalence, and respective 95% confidence intervals, according to sociodemographic, family, behavioral, and school structural characteristics. Brazil, 2012.
5 of 6
Time spent watching television ≥2 hours a day
<2 hours a day
Willingness to lose weight
Yes No
School food consumption ≥3 days a week <3 days a week
Cafeteria
Yes No
Sports facilities
Yes No
Gender
Male Female
Age ≤14 years >14 years
Currently employed
Yes No
Household composition ≤4 persons
>4 persons
Home computer ownership
Yes No
Internet access
Yes No
Mobile phone ownership
Yes No
Maternal level of education
<9 years
≥9 years
Living with the mother
Yes No
108,655
108,309
108,716
108,548
108,506
108,858
108,858
108,814
108,359
108,814
108,800
108,817
90,412
108,817
43,905 21,978
17,105 48,604
13,131 52,781
34,423 31,357
54,115 11,639
30,004 30,986
40,537 20,453
08,995 51,973
34,098 26,658
44,195 16,772
41,650 19,313
54,031
06,940
17,211 33,459
54,192
06,778
65.2 53.5
59.1 61.6
57.7 61.8
62.7 59.2
61.8 57.6
58.1 54.2
55.5 57.3
62.8 55.0
57.5 54.4
60.4 47.6
61.4 48.0
57.5 47.7
51.7 59.2
56.0 56.1
62.27-68.04 51.47-55.49
56.13-61.95 59.3-63.94
56.19-59.26 58.92-64.56
60.11.65.27 57.34.60.97
59.04-64.46 53.3-61.69
56.57-59.65 51.71-56.58
54.32-56.62 53.44-61.06
61.33-64.35 52.92-57.12
56.08-58.92 51.79-56.98
59.35-61.49 44.02-51.12
60.37-62.31 44.75-51.24
55.73-59.26 44.23-51.26
48.97-54.4 57.52-60.87
54.04-58.04 54.14-57.98
<0.0001
<0.0001
<0.0001
<0.0001
<0.1054
<0.0001
<0.2258
<0.0001
<0.0001
<0.0001
<0.0001
<0.0001
<0.0001
<0.9659 Family
Behavioral Variables
n¹ n¹ %² (95%CI)² p*
Sugar candies
Sociodemographic Variables
n¹ n¹ %² (95%CI)² p*
Table 3. Regular consumption (≥3 days a week) of obesogenic foods among adolescents, prevalence, and respective 95% confidence intervals, according to sociodemographic, family, behavioral, and school structural characteristics. Brazil, 2012.
6 of 6
Living with the father
Yes No
Use of tobacco
Yes No
Consumption of alcohol
Yes No
Physical activity ≥3 days a week <3 days a week
Meals with parents or guardians ≥3 days a week
<3 days a week
Eating while watching television or studying ≥3 days a week
<3 days a week
Breakfast ≥3 days a week <3 days a week
Time spent watching television ≥2 hours a day
<2 hours a day
Willingness to lose weight
Yes No
School food consumption ≥3 days a week <3 days a week
Cafeteria
Yes No
Sports facilities
Yes No
108,728
108,721
108,570
108,655
108,794
108.729
108,759
108,694
108,348
108,760
108,591
108,549 Variables
n¹ n¹ %² (95%CI)² p*
Soft drinks
38,428 22,502
03,875 57,043
18,355 42,465
27,269 33,611
51,237
09,724
47,507 13,410
52,655
08,286
40,195 20,698
15,237 45,476
12,165 48,774
32,108 28,728
50,383 10,432
55.6 56.9
65.6 55.6
65.5 52.7
58.8 54.1
55.9 57.0
57.1 52.5
55.7 58.4
59.4 50.2
52.2 57.4
52.8 56.9
57.8 54.4
57.5 50.4
53.6-57.62 54.62-59.22
62.12-68.99 53.55-57.54
63.72-67.23 50.46-54.99
56.57-61.05 52.33-55.86
53.93-57.83 54.76-59.14
54.94-59.19 50.55-54.44
53.76-57.63 56.22-60.55
57.57-61.2 47.96-52.44
50.9-53.54 55.1-59.71
49.83-55.66 55.08-58.75
50.03-58.62 56.82-58.82
56.19-58.83 45.19-55.67
<0.1371
<0.0001
<0.0001
<0.0001
<0.0318
<0.0001
<0.0001
<0.0001
<0.0001
<0.0001
<0.1195
<0.0025 Behavioral
School structural Family
Note: *p-value - Pearson’s chi-square test; ¹Number of individuals in the unweighted sample; ²Prevalence and 95% confidence intervals (95%CI ), calculated as weighted confidence interval due to the sampling design.
95%CI : 95% Confidence Interval.
It is worth mentioning that the existence of cafeteria at school was not associated with the consumption of packaged snacks and soft
drinks (p>0.05) in the crude analysis. After
Table 4. Multiple logistic regression analysis for the regular consumption of obesogenic foods among adolescents, according to sociodemographic, family, behavioral, and school structural characteristics. Brazil, 2012.
1 of 6
Gender
Male Female
Age
≤14 years >14 years
Currently employed
Yes No
Household composition ≤4 persons
>4 persons
Home computer ownership
Yes No
Internet access
Yes No
Maternal level of education
<9 years
≥9 years
Living with the mother
Yes No
Living with the father
Yes No
Use of tobacco
Yes No
Consumption of alcohol
Yes No
Physical activity ≥3 days a week <3 days a week
Meals with parents or guardians ≥3 days a week
<3 days a week
Eating while watching television or studying ≥3 days a week
<3 days a week Variables
Fried snacks
Crude odds Ratio
OR¹ (95%CI )² p
Adjusted odds Ratio
OR¹ (95%CI )² p
Sociodemographic 1 1.09 1 1.05 1.35 1 1 0.95 1.54 1 1.47 1 0.76 1 1 1.11 1.51 1 0.67 1 1 0.82 1 1.14 1 0.83 -1.02- 1.17 -1.00-1.11 1.25-1.35 -0.90-1.00 1.45-1.63 -1.42-1.53 -0.70-0.83 -1.07-1.15 1.42-1.61 -0.62-0.72 -0.79-0.85 -1.09-1.20 -0.78-0.89
-<0.0070
-<0.0220
<0.0001
-<0.0700
<0.0001 -<0.0001 -<0.0001 -<0.0001 <0.0001 -<0.0001 -<0.0001 -<0.0001 -<0.0001
-<0.0070
-<0.0220
<0.0001
-<0.0700
<0.0001 -<0.0001 -<0.0001 -<0.0001 <0.0001 -<0.0001 -<0.0001 -<0.0001 -<0.0001 -1.11-1.29 -1.00-1.13 1.18-1.43 -1.00-1.11 1.40-1.60 -1.23-1.35 -0.78-0.91 -1.03-1.16 1.04-1.26 -1.48-1.60 -0.82-0.86 -1.04-1.14 -0.78-0.94 -<0.0001
-<0.0270
<0.0001
-<0.0430
<0.0001 -<0.0001 -<0.0001
-<0.0030
<0.0040
-<0.0001 -<0.0001 -<0.0001
-<0.0020
Table 4. Multiple logistic regression analysis for the regular consumption of obesogenic foods among adolescents, according to sociodemographic, family, behavioral, and school structural characteristics. Brazil, 2012.
2 of 6
Breakfast ≥3 days a week <3 days a week
Time spent watching television ≥2 hours a day
<2 hours a day
Willingness to lose weight
Yes No
Gender
Male Female
Age ≤14 years >14 years
Currently employed
Yes No
Household composition ≤4 persons
>4 persons
Home computer ownership
Yes No
Internet access
Yes No
Maternal level of education
<9 years
≥9 years
Living with the mother
Yes No
Living with the father
Yes No
Use of tobacco
Yes No
Consumption of alcohol
Yes No
1.48 1
1 1.26
1 1.26
1 1.27
1.22 1
1.27 1
1.25 1
1.78 1
1.65 1
1 0.83
1.42-1.54
-1.18-1.34
-1.18-1.34
-1.20-1.33
1.16-1.27
-1.19-1.25
-1.35-1.45
-1.61-1.97
-1.53-1.77
-0.78-0.88
<0.0001
-<0.0001
-<0.0001
-<0.0001
<0.0001
-<0.0001
-<0.0001
-<0.0001
-<0.0001
-<0.0001
1.46 1
1 1.39
1 1.39
1 1.38
1.19 1
1.26 1
1.20 1
1.37 1
1.52 1
1 0.79
1.40-1.53
-1.31-1.48
-1.31-1.48
-1.33-1.44
1.15-1.24
-1.18-1.34
-1.12-1.29
-1.20-1.58
-1.38-1.67
-0.75-0.84
<0.0001
-<0.0001
-<0.0001
-<0.0001
<0.0001
-<0.0001
-<0.0001
-<0.0001
-<0.0001
-<0.0001 Variables
Fried snacks
Crude odds Ratio
OR¹ (95%CI )² p
Adjusted odds Ratio
OR¹ (95%CI )² p
Behavioral
Variables
Packaged snacks
Crude odds Ratio
OR¹ (95%CI )² p
Adjusted odds Ratio
OR¹ (95%CI )² p
Sociodemographic
Family
Table 4. Multiple logistic regression analysis for the regular consumption of obesogenic foods among adolescents, according to sociodemographic, family, behavioral, and school structural characteristics. Brazil, 2012.
3 of 6
Physical activity ≥3 days a week <3 days a week
Meals with parents or guardians ≥3 days a week
<3 days a week
Eating while watching television or studying ≥3 days a week
<3 days a week
Breakfast ≥3 days a week <3 days a week
Time spent watching television ≥2 hours a day
<2 hours a day
Willingness to lose weight
Yes No
Gender
Male Female
Age ≤14 years >14 years
Currently employed
Yes No
Household composition ≤4 persons
>4 persons
Home computer ownership
Yes No
Internet access
Yes No
Maternal level of education
<9 years
≥9 years
Living with the mother
Yes No
1 0.82
1 1.03
1.57 1
1 1.31
1 1.31
1 1.62
1 0.76
1.32 1
1.34 1
1.44 1
0.80 1
-0.79-0.85
-0.99-1.06
1.53-1.62
-1.22-1.40
-1.22-1.40
-1.62-1.68
-0.69-0.83
1.16-1.51
-1.18-1.52
-1.34-1.55
-0.73-0.87
-<0.0001
-0.065
<0.0001
-<0.0001
-<0.0001
-<0.0001
-<0.0001
<0.0001
-<0.0001
-<0.0001
-<0.0001
-1 0.84
1 0.96
1.53 1
1 1.44
1 1.44
1 1.76
1 0.81
1.11 1
1.15 1
1.19 1
0.90 1
-0.81-0.87
-0.93-0.99
1.47-1.58
-1.33-1.55
-1.33-1.55
-1.70-1.82
-0.76-0.85
1.05-1.17
-1.06-1.25
-1.14-1.25
-0.86-0.95
-<0.0001
-<0.0320
<0.0001
-<0.0001
-<0.0001
-<0.0001
-<0.0001
<0.0001
-<0.0001
-<0.0001
-<0.0001 -Variables
Packaged snacks
Crude odds Ratio
OR¹ (95%CI )² p
Adjusted odds Ratio
OR¹ (95%CI )² p
Behavioral
Variables
Sugar candies
Crude odds Ratio
OR¹ (95%CI )² p
Adjusted odds Ratio
OR¹ (95%CI )² p
Sociodemographic
Table 4. Multiple logistic regression analysis for the regular consumption of obesogenic foods among adolescents, according to sociodemographic, family, behavioral, and school structural characteristics. Brazil, 2012.
4 of 6
Use of tobacco
Yes No
Consumption of alcohol
Yes No
Physical activity ≥3 days a week <3 days a week
Meals with parents or guardians ≥3 days a week
<3 days a week
Eating while watching television or studying ≥3 days a week
<3 days a week
Breakfast ≥3 days a week <3 days a week
Time spent watching television ≥2 hours a day
<2 hours a day
Willingness to lose weight
Yes No
School food consumption ≥3 days a week <3 days a week
Cafeteria Yes No Gender Male Female Age
≥14 years >14 years Currently employed Yes No 1.44 1 1.57 1 1 0.83 1 1.18 1 0.91 1 1.19 1.63 1 1 1.11 1 1.18 1.16 1 1 0.85 1.08 1 1.35-1.54 -1.48-1.67 -0.81-0.85 -1.12-1.25 -0.87-0.95 -1.15-1.23 1.53-1.73 -1.07-1.15 -1.09-1.28 1.07-1.24 -0.81-0.88 1.00-1.14 -<0.0001 -<0.0001 -<0.0001 -<0.0001 -<0.0001 -<0.0001 <0.0001 -<0.0001 -<0.0001 <0.0001 -<0.0001
<0.0430
-1.22 1 1.52 1 1 0.75 1 1.11 1 0.91 1 1.07 1.56 1 1 1.30 1 1.07 1.08 1 1 0.89 1.36 1 1.12-1.33 -1.42-1.62 -0.73-0.77 -1.06-1.15 -0.88-0.94 -1.04-1.11 1.45-1.67 -1.26-1.34 -1.02-1.12 1.05-1.12 -0.85-0.93 1.31-1.41 -<0.0001 -<0.0001 -<0.0001 -<0.0001 -<0.0001 -<0.0001 <0.0001 -<0.0001
-<0.0050
<0.0001 -<0.0001 <0.0001 -School Structural Variables Sugar candies
Crude odds Ratio
OR¹ (95%CI )² p
Adjusted odds Ratio
OR¹ (95%CI )² p
Behavioral
Variables
Soft drinks
Crude odds Ratio
OR¹ (95%CI )² p
Adjusted odds Ratio
OR¹ (95%CI )² p
Table 4. Multiple logistic regression analysis for the regular consumption of obesogenic foods among adolescents, according to sociodemographic, family, behavioral, and school structural characteristics. Brazil, 2012.
5 of 6
Household composition
≤4 persons >4 persons
Home computer ownership
Yes No
Internet access
Yes No
Maternal level of education
<9 years
≥9 years
Living with the mother
Yes No
Use of tobacco
Yes No
Consumption of alcohol
Yes No
Physical activity ≥3 days a week <3 days a week
Meals with parents or guardians ≥3 days a week
<3 days a week
Eating while watching television or studying ≥3 days a week
<3 days a week
Breakfast ≥3 days a week < days a week
Time spent watching television ≥2 hours a day
<2 hours a day
Willingness to lose weight
Yes No
School food consumption ≥3 days a week <3 days a week
1.68 1
1.72 1
1.48 1
0.73 1
1 1.38
1.52 1
1.70 1
1 0.82
1 0.83
1 1.11
1.45 1
1 1.26
1.49-1.90
-1.54-1.91
-1.36-1.60
-0.67-0.80
-1.29-1.48
1.38-1.68
-0.63-0.76
-0.80-0.84
-0.76-0.90
-1.07-1.15
1.40-1.49
-1.16-1.30
<0.0001
-<0.0001
-<0.0001
-<0.0001
-<0.0001
<0.0001
-<0.0001
-<0.0001
-<0.0001
-<0.0001
<0.0001
-<0.0001
1.21 1
1.40 1
1.27 1
0.89 1
1 1.05
1.22 1
1.59 1
1 0.88
1 0.85
1 1.07
1.44 1
1 1.34
1.10-1.34
-1.32-1.50
-1.19-1.35
-0.85-0.95
-0.98-1.13
1.15-1.29
-1.52-1.66
-0.85-0.92
-0.82-0.88
-1.03-1.12
1.33-1.55
-1.27-1.42
<0.0001
-<0.0001
-<0.0001
-<0.0001
-0.137
<0.0001
-<0.0001
-<0.0001
-<0.0001
-<0.0001
<0.0001
-<0.0001 Variables
Soft drinks
Crude odds Ratio
OR¹ (95%CI )² p
Adjusted odds Ratio
OR¹ (95%CI )² p
Sociodemographic
Family
Table 4. Multiple logistic regression analysis for the regular consumption of obesogenic foods among adolescents, according to sociodemographic, family, behavioral, and school structural characteristics. Brazil, 2012.
6 of 6
Cafeteria Yes No Variables
Soft drinks
Crude odds Ratio
OR¹ (95%CI )² p
Adjusted odds Ratio
OR¹ (95%CI )² p
School Structural
Note: ¹OR: OddsRatio, calculated as weighted odds ratio due to the sampling design; ²95%IC: 95% Confidence Interval, calculated as weighted confidence interval due to the sampling design.
Additionally, the adolescents that had greater probability of eating eat sugar candies regularly were females who owned a home computer and a mobile phone, had Internet access, smoked, consumed alcohol, and showed a lower frequency of eating breakfast, eating meals with the family, and school food consumption. These girls also spent more time watching television and attended schools that did not have a cafeteria.
In the final logistic model, the probability of regular consumption of soft drinks was greater among adolescents who had a job, owned a home computer and amobile phone, had Internet access, did not live with their father, smoked, consumed alcohol, ate breakfast less than 3 three days a week, watched television for more than two hours daily, and did not display willingness to lose weight.
Moreover, maternal level of education of less than nine years was a protective factor in the final adjusted models for the regular consumption of fried snacks, sugar candies, and soft drinks among the Brazilian adolescents analyzed.
D I S C U S S I O N
The distribution of the population studied in terms of the frequency of consumption of obsegenic foods showed that their regular and daily consumption was higher among girls, except
for soft drinks (difference of 0.2% between the genders). An interesting fact is that more than one third of girls reported daily consumption of sugar candies. In the logistic models used, females also showed greater probability of regular consumption of fried snacks (OR=1.20; 95%CI 1.11 to 1.29), packaged snacks (OR=1:38; 95%CI 1.33 to 1.44), and sugar candies (OR=1.76; 95%CI 1.70-1.282). In general, adolescent girls were more susceptible to developing unhealthy behavior and eating habits (use of tobacco, low frequency of eating meals with parents or guardians, low-frequency physical activity, and excessive amount of time spent watching television).
Although the literature often addresses differences between genders in food consumption patterns, the results from many studies differ from those found in the present
study12,13. Investigating a representative sample
of children and adolescents in the United States, some authors found that on averageboys had higher daily caloric intake, and the portion sizes and energy density of their meals and snacks were
larger than those of girls12.
Yannakoulia et al.13 evaluated the eating
scores, afinding that was significant in all three age groups investigated (11, 13, and 15 years old).
In addition to the high percentage of adolescents who regularly consumed fried snacks, packaged snacks, sugar candies, and soft drinks with regular frequency (ranging from 27.17% to 65.96%, as previously mentioned) in the final logistic regression model (after adjusting the variables), the consumption of these four types of food was statistically associated with mobile phone ownership, Internet access, watching television for more than 2 hours a day, use of tobacco, and consumption of alcohol. The low frequency (less than three days a week) of the habit of eating while watching television or studying was a protective factor (OR<1.0) for the regular consumption of all foods.
The grow thin mobile media use, such as mobile phones (smartphones) and tablets, has been the subject of many studies that aim to identify their impact on the lives of consumers, in particular the Generation Z (or also called Generation, cohort of people born between 1991-2000), which is the first generation born after the advent of the Internet and who are
growing up in an era of global interaction14.
There is a consensus that the time spent on social networking is positively associated with the consumption of unhealthy foods, which is also consistent with research carried out by
Boynton--Jarret et al.15. These authors evaluated
adolescents over a period of 19 months and found an inverse relationship between the time spent watching television and the intake of fruits and vegetables. They believe that this reflects a replacement of healthy foods with unhealthy ones, which are highly advertised on television.
In addition to the negative approach associating the use of media with physical inactivity, obesity, mental disorders, reduction in sleeping hours and rest, problems with interpersonal relationships, and learning
difficulties in the classroom16, these adolescents
are subjected to the massive advertising for
industrialized foods15.
However, given the growing trend of technological advances and their rapidly spread among children and adolescents, confronting such reality does not appear to be an effective approach. A more appropriate strategy would be investing in electronic media to promote healthy eating, advertising health enhancing-foods, and transmitting appropriate nutrition education
messages17. For example, Peterson et al.18 used
healthy eating videos for 20 minutes for 10 days to assess the eating habits of children aged 5 and 6 years. The results showed that the students learned nutrition concepts and displayed certain tendency towards healthy food consumption.
As for the findings related to use of tobacco and alcohol consumption, these variables, whichrefer to unhealthy life style habits, lead to harmful eating behaviors, a fact that is consistent
with the literature19.
Although in Brazil the law prohibits the consumption of alcoholic beverage by any person under 18 years, the allure of alcohol is due to the fact that it is not an illegal drug and therefore is not subjected to censorship as strict as that of illegal drugs. Early age alcohol use can be related to several factors, such aseasy access and influence of friends and family. Other countries have also revealed high frequency of alcohol consumption among adolescents. It has been
reported that in Coimbra, Portugal, 65% of
adolescents aged 12 to 18 have already consumed
alcohol and 19% have already gotten drunk20,
and in Germany, it was found that 93% of adolescents aged 15 to 16 have already tried
alcoholic berverages21.
Moreover, based on data from the Project Eating Among Teens (EAT), a study designed to investigate socio environmental, personal, and behavioral factors associated with dietary intake
in adolescents 11-18 years, Larson et al.19
dinner) and consumption of fruits, vegetables, grains, and some vitamins and minerals. Smoking frequency was directly related to the frequency of fast-food and soft drink consumption.
The results from the present study revealed that the like lihood that adolescents will consume fried snacks, packaged snacks, sugar candies, and soft drinks was higher among those who worked. Considering that all adolescents were attending schools, such association may reflect the fact that they had less time to have regular meals and frequently ate outside the home. Furthermore, given the characteristics of these food groups, it can be said that these preparations and foods have been replacing the major meals. Corroborating this assertion, a study found that one third of adolescents replaced lunch and half of them replaced dinner with snacks, a habit that was most common among girls. Sandwiches, savory snacks, pizzas, and hamburgers were the
main meal replacements22.
Similarly, our study found that adolescents who had breakfast less than three days a week were more likely to regularly consume packaged snacks, sugar candies, and soft drinks.
Skipping breakfast is common among adolescents and has been associated with higher body mass index, and attention and concentration problems, with possible impacts on adult health. A longitudinal study conducted in Australia showed that both children and adults who skipped breakfast had larger waist circumference, higher fasting insulin, and higher levels of total cholesterol and Low Density Lipoprotein cholesterol in adulthood when compared to those who ate breakfast during childhood and
adulthood23. One reason for this finding is the
association of this habit with other unhealthy lifestyle habits, such as low fruit and vegetable intake.
Within the same context, in a prospective study of adolescents participating in the National Longitudinal Study of Adolescent Health,
Niemeier et al.24 investigated whether fast food
consumption and breakfast skipping were associated with weight gain during the transition from adolescence to adulthood. The authors found marked increases in the consumption of these foods and decreases in the consumption of breakfast for five years. Another important finding is that these dietary behaviors were associated with increased weight gain from adolescence to adulthood.
With regard to the role of the family in the eating habits of adolescents, our findings revealed a significant association between low frequency of meals with parents or guardians (less than three days a week) and regular consumption of sugar candies and soft drinks. This variable remained in the explanatory model proposed after final adjustment.
An interesting finding was that low maternal level of education (less than 9 years) was as a protective factor (OR<1:00) for the consumption of fried snacks, sugar candies, and soft drinks since the regular consumption of these types of foods is frequently found among the children with mothers that have higher levels of education. Similarly, investigating the association between maternal determinants and dietary
patterns of children, Villa et al.25 found that
children whose mothers had nine or more years of education consumed more “sugary drinks and snacks”. These authors also showed that the probability of children having a diet rich in these food items increased by four times when maternal level of education was 12 or more years, compared to mothers who had less years of education.
However, these data challenge the assumption that higher level of education means greater access to health-related information and greater ability to distinguish between what is healthy and what is not. Thus, contrary to our results, a cross-sectional population study carried out in Spain, found that children whose mothers had lower level of education were more likely to follow the eating pattern called “Snacky”, characterized by increased consumption of bakery
Furthermore, the adolescents who did not reported willingness to lose weight (70%) had the highest frequency of consumption of all
obesogenic foods investigated (p<0.05), and this
variable remained in all final explanatory models after final adjustment of the other variables. This fact may indicate that body weight dissatisfaction among adolescents leads to behavior changes and reduced unhealthy food consumption to achieve weight loss.
It is known that during adolescence there are changes in anthropometric measures and body composition, and individuals acquire approximately 50% of their final weight and 20% of their final height. These common changes during puberty often trigger body dissatisfaction associated with the influence of psychological factors (search for a new identity and social and emotional independence), peers, friends, family, and the media. Therefore, the search for a thin body as a necessary attribute to achieve success, happiness, and beauty, results in increased body dissatisfaction and larger desire to lose weight. These facts consequently lead to dietary restrictions or compensatory behaviors to prevent weight gain, which are predictors of many eating
disorders27. Although their mechanisms have not
yet been defined, the literature has associated eating disorders, especially anorexia and bulimia, with lipid disorders and metabolic syndrome. It has been reported that these disorders occur due to physiological and hormonal changes and also by excessive intake of unhealthy foods followed by compensatory behaviors, typical of some eating disorders28.
Finally, considering that PeNSE was
conducted in the school context, it is worth highlighting that the regular consumption of the foods studied was higher among the students who attended schools that had a cafeteria and consumed school food less than three days a week. However, after adjustment in the multivariate analysis, there was no significant association between having a cafeteria and consuming school food with the consumption of
fried snacks, packaged snacks, and soft drinks. In the final explanatory model, the variables remained associated only with the regular consumption of sugar candies among teenagers.
It is important to mention that although there are initiatives to improve school cafeteria food items, high energy density foods, which are rich in sugar, fat, and salt, such as fried snacks, packaged snacks, sugar candies, and soft drinks,
are still available, indicating students’ preference
forthem29. This is due to the high prevalence of
outsourced management of school cafeterias, with little interference from the school community, and thus the owner has autonomy and focuses primarily on profit generation at the expense of a healthy diet. Therefore, improving the nutritional quality of foods sold around schools should be a continuous integration effort among suppliers, school board, students, families, and
the governement29.
With regard to the consequences of the type of foods available in schools and school
surroundings, Virtanen et al.30 investigated the
association among the proximity of fast food chains and grocery stores to schools and the food choices of Finnish adolescents. The authors found an association between the presence of these food establishments in the vicinity of schools and poor eating habits, such as skipping breakfast, low consumption of free school meals, and a 1.25-fold risk of overweight.
After discussing the factors associated with the regular consumption of obesogenic foods considering literature data and trying to understand these associations, it is important to add that there is a consensus in the literature on
the negative consequences of this behavior5.
In addition to the exponentially increased risk of overweight and obesity, the consumption of fried snacks, packaged snacks, sugar candies, and soft drinks contributes to Non Communicable Diseases (NCD). The incidence of NCD has increased
in the past decades among adolescents31. These
and are low in fibers3, which affects the body’s
ability to maintain energy balance, increasing the risk of gaining too much weight, prevalence of dental caries, and morbidity and mortality due to cardiovascular disease, hypertension, diabetes,
and several forms of cancers5.
It should be added that, as demonstrated
by Johnson & Kenny32, like other substances
(such as cocaine or heroin), unhealthy foods can be addictive. This is due to the fact that their consumption triggers progressive deterioration of the chemical balance in brain reward circuitries leading to the development of a pattern of compulsive eating, especially foods that are high in fats and calories, contributing to the maintenance of these food preferences throughout the life span.
The concept of tracking has been defined in epidemiology as the stability of a given variable over a period of time. Dietary tracking values can therefore be considered to illustrate the maintenance of dietary habits, nutrient intakes,
or food consumption over time33. There is a
tendency to change(or absence of ‘tracking’) in
these standards, which appear to be negative, i.e., there is a decrease in dietary quality throughout the life span.
Based on data from the Framingham
Children’s study, which evaluated children aged
3 to 5 years over a span of up to 6 years six years,
Singer et al.34 showed a prevalence of tracking
of 40-90% both in the highest and the lowest quintiles of intake, and 57% of the individuals remained in the highest quintile of fat intake for three years. The authors considered tracking as the proportion of children in the highest and lowest quintiles of nutrient density intake at baseline who remained in the same quintile or moved only one quintile in subsequent years. The study supports the idea that the levels of intake of nutrients are maintained in subsequent ages.
One limitation of our study is the cross-sectional design, which prevents cause-and-effect inferences. Therefore, the findings should be treated with caution until a longitudinal
assessment of risk factors is carried out. Although cross-sectional studies do not enable causal inferences, they are essential for generating hypotheses and planning prospective studies that can establish clear relationships between the determinants of overweight among adolescents. Despite this limitation, the sampled population in the present study was representative of the of Brazilian schoolchildren, allowing the conclusion that the regular consumption of obesogenic foods is a major eating-related problem among this population.
C O N C L U S I O N
Considering the objective of this study, it can be said that the consumption of fried snacks, packaged snacks, sugar candies, and soft drinks is regular in the diet of Brazilian adolescents. The consumption of these foods is associated with sociodemographic, family, behavioral, and school structural variables. It is worth highlighting that the variables female gender, mobile phone ownership, Internet access at home, use of tobacco, alcohol consumption, regular physical activity, eating while watching television or studying, watching television for at least 2 hours a day, and not willing to lose weight were associated with regular consumption in the final explanatory models of the four types of foods analyzed.
We hope our findings may lead to a new and better understanding of the profile of adolescents who regularly consume unhealthy and obesogenic foods. The identification of the factors that are associated with the consumption of these foods shows that strategies that promote healthy eating should consider sociodemographic, family, behavioral, and environmental characteristics.
Therefore, interventions should be designed aiming at a health promoting school,
including, in a systematic way, the topic ‘eating’