Ilana Nogueira BezerraI Amanda de Moura SouzaI Rosangela Alves PereiraII Rosely SichieriI
I Departamento de Epidemiologia. Instituto
de Medicina Social. Universidade do Estado do Rio de Janeiro. Rio de Janeiro, RJ, Brasil
II Departamento de Nutrição Social Aplicada.
Instituto de Nutrição Josué de Castro. Universidade Federal do Rio de Janeiro. Rio de Janeiro, RJ, Brasil
Correspondence: Ilana Nogueira Bezerra
Departamento de Epidemiologia, Instituto de Medicina Social – UERJ
Rua São Francisco Xavier, 524 7° andar Bloco E Sala E7002 Maracanã
20550-012 Rio de Janeiro, RJ, Brasil E-mail: [email protected]
Received: 11/25/2011 Approved: 8/17/2012
Article available from: www.scielo.br/rsp
Consumption of foods away from
home in Brazil
ABSTRACT
OBJECTIVE: To describe foods consumed away from home and associated factors in Brazil.
METHODS: The study was based on the National Dietary Survey which was conducted among residents aged over 10 years old in 24% of households participating in the Household Budget Survey in 2008-2009 (n = 34,003). The consumption of food and beverages was collected through records of foods consumed, type of preparation, quantity, time and food source (inside or outside home). The frequency with which individuals consumed food away from home was calculated according to age, gender, income, household area location, family size, presence of children at home and age of head of household in Brazil and in each Brazilian region. Specifi c sampling weight and effect of the sampling design were considered in the analyses.
RESULTS: Consumption of food away from home in Brazil was reported by 40% of respondents, varying from 13% among the elderly in the Midwest Region to 51% among adolescents in the Southeast. This percentage decreased with age and increased with income in all regions of Brazil and was higher among men and in urban areas. Foods with the highest percentage of consumption outside home were alcoholic beverages, baked and fried snacks, pizza, soft drinks and sandwiches.
CONCLUSIONS: Foods consumed away from home showed a predominance of high energy content and poor nutritional content, indicating that the consumption of foods away from home should be considered in public health campaigns aimed at improving Brazilians’ diet.
The proportion of food consumed away from home has increased in Brazil. Data on food spending indi-cated that 31% was spent on eating out in 2008-2009, compared with 24% in 2002-2003.a
In spite of this evident increase in spending on food outside of the home, data on food consumption away from home in Brazil are limited in the literature, especially in relation to the type and quantity of food consumed. The only publication in Brazil on the topic, which analyses data from the 2002-2003 Household Budget Survey, contains no detailed analysis of the type or quantity of food consumed.3
In developed countries, the study of food consumed away from home has received a fair amount of attention in recent years, due to the high content of calories, fat, saturated fat, sugar and salt of food sold in restaurants and snack bars.10,12,13,15
Social, demographic and economic factors, such as the greater participation of women in the labor market,b
increased household income,17,23 urbanization,21 and
lack of time in modern society11 and decreasing prices of
convenience foods6 which have infl uenced the increase
in spending on food outside of the home, will continue to drive spending on this type of food. Thus, the increase in popularity of eating out may have a signifi cant infl u-ence on Brazilians’ quality of diet.
The majority of studies on the impact of eating out on the population’s diet have been carried out in developed countries, principally the U.S and Europe.
This study aims to analyze characteristics of food consumed outside of the home.
METHODS
This study is based on the National Dietary Survey carried out as part of the most recent Household Budget Survey, carried out in 2008-2009. The Household Budget Survey is carried out every fi ve years by the IBGE (Instituto Brasileiro de Geografi a e Estatística – the Brazilian Institute of Geography and Statistics)c in a
representative sample of Brazilian households, aiming to outline living conditions in the Brazilian population based on a framework of consumption, spending and household income.
INTRODUCTION
a Instituto Brasileiro de Geografi a e Estatística. Pesquisa de Orçamentos Familiares 2008-2009: despesas, rendimentos e condições de vida.
Rio de Janeiro: IBGE; 2010.
b Garriguet D. Nutrition: fi ndings from the Canadian Community Health Survey: overview of Canadians’ eating habits-2004. Ottawa: Health
Statistics Division; 2006. (Catalogue nº 82-620-MIE-Nº 2). [cited 2011 Aug 10]. Available from: http://dsp-psd.pwgsc.gc.ca/Collection/ Statcan/82-620-M/82-620-MIE2006002.pdf
c Instituto Brasileiro de Geografi a e Estatística. Pesquisa de Orçamentos Familiares 2008-2009: despesas, rendimentos e condições de vida.
Rio de Janeiro: IBGE; 2010.
d Instituto Brasileiro de Geografi a e Estatística. Pesquisa de Orçamentos Familiares 2008-2009: análise do consumo alimentar pessoal no
Brasil. Rio de Janeiro: IBGE; 2011.
In the 2008-2009 Household Budget Survey, the house-holds were selected using two-stage cluster sampling. Census tracts are the main units of the sample and are initially stratifi ed according to geographical location and mean income. Tracts were randomly selected with probability proportional to the number of households they contained. In the second stage, the households were selected for simple random sampling and a subsample of 24.5% of these households was selected to participate in the National Dietary Survey.
Individuals aged 10 and over in these households were included in the fi nal National Dietary Survey sample (n = 34,003). Details on the sampling plan and study design are available in a previous publication.d
Food and beverage consumption was collected using food records from two non-consecutive days. Participants were told to record everything they ate and drank, except water, in the 24 hour period. In addition to the food consumed, the method of preparation, quantity, time and source (inside or outside home) was registered.
Eating out was defi ned based on the source of the food and the place it was consumed and included all food prepared and consumed outside of the home.
In order to guide correct recording, each participant received instructional material with guidance on fi lling in the food record and photographs of utensils commonly used to serve the food and drink.
All of the records were checked by research agents, probing for foods frequently omitted (small snacks, sweets, confectionary, drinks), refi ning the information on the type of preparation used for specifi c foods such as meat and vegetables, and estimations of quantity consumed, verifying the number of items consumed and the interval between meals. All of this information was entered into a laptop computer in the household itself, using a program specifi cally designed for data entry on food consumption.
In this article, analysis of the fi rst day’s food record is considered.
(60 and over). To calculate per capita income, the sum of all the household members’ income was divided by the number of residents in the household. Income was stratifi ed into four groups up to $ 124.30; between $ 124.30 and $ 239.93; between $ 239.93 and $ 457.58 and over $ 457.58, respectively.
The size of the family and age of the head of the household were stratifi ed based on median values for each variable: families with up to three and with more than three residents in the household, with head of the household younger than 45 and 45 and over. Children in the household was defi ned as the existence of at least one individual age under ten in the household.
In the data analysis, the frequency with which indi-viduals ate out was calculated according to age group, gender, income group, area in which the household was
located, family size, presence of children in the house-hold and age of the head of the househouse-hold for Brazil and for each region. Association between the frequency of eating out and age and income were examined using linear trend. To evaluate differences between frequen-cies of consumption outside of the home and the other variables, the Chi-squared test was used. To analyze the time of consumption of food outside of the home, the variable was stratifi ed into six periods: 6-8 AM, 9-11 AM, 12-2 PM, 3-5 PM, 6-8 PM and between 9 PM and 5 AM.
All of the food and drink reported in the fi rst day’s food record of the individual food consumption survey were organized into 33 food groups: rice, corn, beans and other pulses, vegetables, legumes, potato, cassava and yam, fruit, oilseeds, other cereals, pasta, soup, bread,
Table 1. Sample size (n), frequency (%) of individuals who ate out on the fi rst day’s food record for the National Dietary Survey, according to socio-economic and demographic characteristics. Brazil, 2008-2009.
Variable n Brazil %
North %
Northeast %
Southeast %
South %
Midwest % Age (years)
10-19 7,613 48.1 51.0 41.4 51.3 50.3 51.0 20-59 22,068 42.6 42.8 34.7 46.8 43.8 43.5 60 and over 4,322 16.1 15.3 13.2 18.9 13.0 16.3 p of the trend < 0.0001 < 0.0001 < 0.0001 < 0.0001 < 0.0001 < 0.0001 Sex
Male 15,700 44.5 48.2 36.7 48.2 45.0 46.6 Female 18,303 36.3 37.0 30.6 39.5 36.7 37.6 p of X2 test < 0.0001 < 0.0001 < 0.0001 < 0.0001 < 0.0001 < 0.0001
Income (quartile)
1º 12,238 32.1 37.7 28.4 36.0 30.6 36.9
2º 9,406 37.1 42.1 33.5 38.4 37.0 37.3
3º 6,947 43.3 46.8 41.3 45.9 36.3 41.7
4º 5,412 51.9 56.5 50.6 51.2 53.3 53.3
p of the trend < 0.0001 < 0.0001 < 0.0001 < 0.0001 < 0.0001 < 0.0001 Area
Urban 25,753 42.8 45.9 36.7 44.8 44.1 44.3 Rural 8,250 27.4 33.6 25.2 31.9 22.5 25.2 p of X2 test < 0.0001 <0.0001 < 0.0001 < 0.0001 < 0.0001 < 0.0001
Residents per household
3 14,309 40.5 46.0 35.3 42.0 39.9 44.7 > 3 19,694 40.1 41.0 32.4 45.1 41.5 39.3 p of X2 test 0.74 0.03 0.04 0.16 0.54 0.05
Children present in the household
Yes 19,955 39.5 43.9 34.6 43.5 40.0 42.3 No 14,048 40.7 41.3 32.1 44.1 41.9 41.3 p of X2 test 0.30 0.28 0.11 0.78 0.44 0.70
Age of head of household (years)
cakes, cookies, processed snacks and crackers, meat, pork, chicken, fi sh and seafood, salted meat and fi sh, sausages, eggs, milk and other dairy products, cheese, sugar and sweets, oil, sauces and condiments, alcoholic drinks, juices, tea and coffee, soft drinks, pizza, fried and roasted snacks and sandwiches. A description of the food present in each group can be found in Table 1. The mean consumption and percentage consumed outside of the home for each group were estimated according to location of household, Brazilian regions, gender and age. The difference between the mean consump-tion of the food groups and the percentage consumed away from home was tested using linear contrast of the means.
To calculate the estimates, the specifi c sample weighting of the National Dietary Survey and the cluster effect of the census tract were taken into consideration, using
SAS, version 9.1 software.
This study was approved by the Ethical Research Committee of the Instituto de Medicina Social da
Universidade do Estado do Rio de Janeiro, protocol
nº CAAE 0011.0259.000-11, July 19th, 2011.
RESULTS
The expanded percentages were 52% women, 65% adults, 22% adolescents and 13% elderly. Eating out was reported by 40% of the interviewees, varying between 13% for the elderly in the South of the country to 51% among adolescents in the Southeast.
The percentage of individuals who ate out decreased with age and increased with income in all regions of Brazil. More men reported eating out than women, as did residents in urban areas compared to those who lived in rural areas. The presence of children in the household did not affect the frequency of eating out, nor did family size, with the exception of the North and Northeast regions, where larger families ate out less often (Table 2).
The most common time for eating out was between 12 and 2 PM (40%); 8% of consumption was between 6 and 8 AM; 19% between 9 and 11 AM; 17% between 3 and 5 PM, 11% between 6 and 8 PM and the remaining 5% between the hours of 9PM and 5 AM.
The food groups which were, on average, most commonly consumed in Brazil were beans and other pulses and rice and the groups most frequently consumed outside of the home were alcoholic drinks and fried and roast snacks.
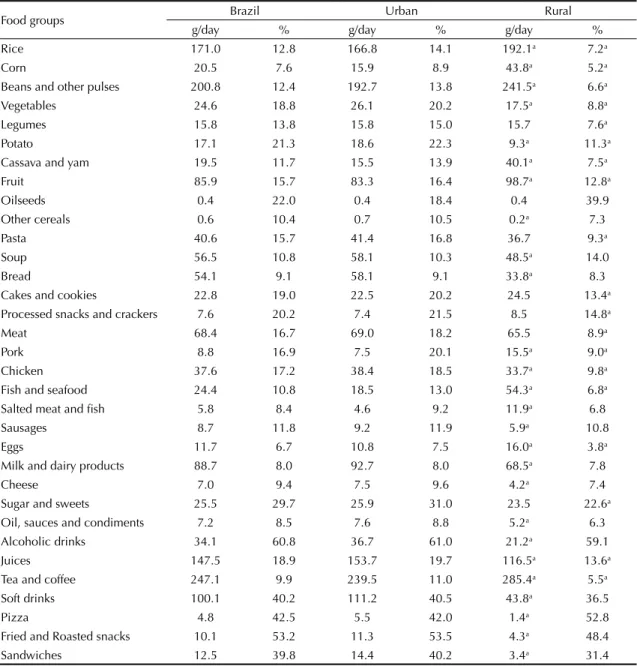
The contribution of eating out according to percentage of food consumed away from home in the urban area was greater than that in the rural area for the majority of groups, with the exception of oilseeds, other cereals, soups, bread, salted meat and fi sh, sausages, milk and
other dairy products, cheese, oil, sauces and condi-ments, alcoholic drinks, soft drinks, pizza, fried and roast snacks and sandwiches. The food groups with the highest percentages of consumption outside of the home were alcoholic drinks, fried and roast snacks, pizza, soft drinks and sandwiches, in both the urban and rural areas (Table 3).
In all regions, the food group most commonly consumed outside of the home was alcoholic drinks, with the exception of the Midwest region, where pizza was the food group with the highest percentage of consumption outside of the home. Fried and roast snacks were the second most consumed group, with the exception of the Midwest region, where alcoholic drinks had the second largest frequency of consumption outside of the home. In the North, the food groups most commonly consumed outside the home were cakes and cookies, milk and other dairy products and alcoholic drinks, in comparison to the Midwest, Southeast and South. However, total consumption of these groups was, on average, higher in these regions than in the North, with the exception of alcoholic drinks, which had similar total consumption in all of the regions. The percentage of soup consumed outside of the home was higher in the North than in the South, in spite of total consumption being similar in both regions. The same was true of pasta, when comparing the North with the Midwest region. The North also had higher percentages of consumption of cheese outside of the home than the Northeast and Southeast regions, in spite of mean consumption being half of that in the Northeast and a quarter of that in the Southeast. The contribution of fruit juices to foods consumed outside the home was greater in the North than in the Northeast, Midwest and Southeast regions, whereas the total quan-tity of juice consumed was similar in all of the regions, with the exception of the Northeast, where consumption was lower than in the North. The percentage of fried and roasted snacks consumed outside the home in the Southeast was lower than in the North and Northeast regions, but the mean total consumed was greater in the Southeast. The percentage of consumption of sand-wiches outside of the home was similar in all regions, despite means of total consumption being higher in the Southeast, South and Midwest regions compared with the North and Northeast (Table 4).
sweets. The percentage of corn, oilseeds, other cereals, cakes and cookies, processed snacks and crackers, pork, fi sh and seafood, salted meat and fi sh, milk and other dairy products, cheese, oil, sauces and condiments, alcoholic drinks, juices and pizzas consumed outside the home was similar for both sexes. The groups most often consumed outside of the home were alcoholic drink and fried and roasted snacks, followed by pizza, soft drinks and sandwiches, for both sexes.
Different consumption profiles can be observed between the age groups. Adolescents had higher mean consumption of cakes and cookies, processed snacks, milk and other dairy products, cheese, sugar and sweets,
juice, soft drinks, fried and roasted snacks and sand-wiches. Those aged 60 and over consumed, on average, larger quantities of legumes, fruit, soup, cheese and tea and coffee. The contribution of eating out to consump-tion was more frequent among adults than in the other age groups for most of the food groups. Adolescents had higher percentages of eating out for soup, cakes and cookies, processed snacks and crackers, sugar and sweets and alcoholic drinks. The percentage of soft drinks, pizza, fried and roasted snacks and sandwiches was the same for adults and adolescents, although adolescents had higher mean consumption of these groups, excepting pizza.
Table 2. Mean daily consumption of food groups (g/day) and percentage consumed outside of the home in the National Dietary Survey, according to location of household. Brazil, 2008-2009.
Food groups Brazil Urban Rural
g/day % g/day % g/day %
Rice 171.0 12.8 166.8 14.1 192.1a 7.2a
Corn 20.5 7.6 15.9 8.9 43.8a 5.2a
Beans and other pulses 200.8 12.4 192.7 13.8 241.5a 6.6a
Vegetables 24.6 18.8 26.1 20.2 17.5a 8.8a
Legumes 15.8 13.8 15.8 15.0 15.7 7.6a
Potato 17.1 21.3 18.6 22.3 9.3a 11.3a
Cassava and yam 19.5 11.7 15.5 13.9 40.1a 7.5a
Fruit 85.9 15.7 83.3 16.4 98.7a 12.8a
Oilseeds 0.4 22.0 0.4 18.4 0.4 39.9
Other cereals 0.6 10.4 0.7 10.5 0.2a 7.3
Pasta 40.6 15.7 41.4 16.8 36.7 9.3a
Soup 56.5 10.8 58.1 10.3 48.5a 14.0
Bread 54.1 9.1 58.1 9.1 33.8a 8.3
Cakes and cookies 22.8 19.0 22.5 20.2 24.5 13.4a
Processed snacks and crackers 7.6 20.2 7.4 21.5 8.5 14.8a
Meat 68.4 16.7 69.0 18.2 65.5 8.9a
Pork 8.8 16.9 7.5 20.1 15.5a 9.0a
Chicken 37.6 17.2 38.4 18.5 33.7a 9.8a
Fish and seafood 24.4 10.8 18.5 13.0 54.3a 6.8a
Salted meat and fi sh 5.8 8.4 4.6 9.2 11.9a 6.8
Sausages 8.7 11.8 9.2 11.9 5.9a 10.8
Eggs 11.7 6.7 10.8 7.5 16.0a 3.8a
Milk and dairy products 88.7 8.0 92.7 8.0 68.5a 7.8
Cheese 7.0 9.4 7.5 9.6 4.2a 7.4
Sugar and sweets 25.5 29.7 25.9 31.0 23.5 22.6a
Oil, sauces and condiments 7.2 8.5 7.6 8.8 5.2a 6.3
Alcoholic drinks 34.1 60.8 36.7 61.0 21.2a 59.1
Juices 147.5 18.9 153.7 19.7 116.5a 13.6a
Tea and coffee 247.1 9.9 239.5 11.0 285.4a 5.5a
Soft drinks 100.1 40.2 111.2 40.5 43.8a 36.5
Pizza 4.8 42.5 5.5 42.0 1.4a 52.8
Fried and Roasted snacks 10.1 53.2 11.3 53.5 4.3a 48.4
Table 3. Mean daily consumption per capita of food groups (g/day) and percentage consumed outside of the home in the National Dietary Survey, according to region of Brazil. Brazil, 2008-2009.
Food groups North Northeast Midwest Southeast South g/day % g/day % g/day % g/day % g/day % Rice 178.2 11.7 153.8a 10.8 208.3e 13.0b,e 183.8c,f,h 13.8f 143.6d,g,i,j 13.7g
Corn 8.1 6.1 51.4a 4.8 9.2e 14.3e 7.4f,h 13.3c,f 12.8g 17.3g
Beans and other pulses
158.2 12.7 194.4 9.8a 214.1b,e 12.5e 226.1f,h 13.5f 154.2d,g,j 13.5g
Vegetables 13.1 20.4 12.1 19.8 39.6b,e 21.3 28.6c,f,h 17.9 35.1d,g,i 18.8
Legumes 6.3 14.2 7.1 9.1 25.6b,e 18.4e 20.3c,f 13.0f 19.0d,g,i,j 16.3
Potato 6.6 22.5 4.9 34.8 8.6b,e 25.1e 25.9c,f 19.8f 23.5g,i,j 20.1
Cassava and yam 59.6 11.6 31.7a 7.8a 16.1b,e 22.4e 8.0c,f,h 16.9f 11.5d,g,i,j 14.4d,g
Fruit 111.2 16.1 75.9a 14.9 76.7b 14.7 81.9f,h 15.8 107.5d,j 16.7
Oilseeds 1.1 9.9 0.4 50.6a 0.2 20.4e 0.2,h 9.7f 0.6d,g,j 11.8
Other cereals 0.2 12.1 0.4 3.1 0.6b,e 3.1 0.9c,f 12.2 0.7d 13.4
Pasta 37.3 21.3 35.7 17.5 31.7 16.8b 37.6c,f,h 13.8 64.9j 15.0
Soup 62.3 13.1 64.8 12.7 44.0b,e 6.5 50.1h 10.8f 63.3d,g,j 7.5d,g
Bread 45.7 8.5 56.7a 7.0 44.0b,e 10.2b,e 53.0c,f,h 11.0h 61.6g,i,j 7.5g,j
Cakes and cookies 19.7 25.9 21.1 20.7 24.3 12.8b 23.1c,f 18.1c 25.9d 18.6d,g,i,j
Processed snacks and crackers
7.8 19.9 9.6a 12.9 4.7 16.5 b,e 7.6c,f,h 25.0f 5.1d,g,i 27.8
Meat 76.3 14.4 63.5a 12.7 94.6b 16.7b,e 67.1c 18.7c,f 64.6d,g,i,j 19.3
Pork 6.8 14.7 5.1 15.5 11.3e 9.6 10.0c,f 19.8 12.1g 14.8i
Chicken 45.5 13.6 42.3 12.8 41.1b,e 19.6b,e 33.1c,f 20.5f 36.5i 19.0d,g
Fish and seafood 97.8 10.9 36.4a 7.9 8.8b,e 10.8 12.1c,f,h 13.3f 7.7d,g 23.6
Salted meat and fi sh
10.8 9.4 11.4 8.2 1.5b,e 7.7 3.4c,f 6.6 1.6d,g 18.1
Sausages 4.6 14.9 5.1 9.4 4.9b,e 14.5 11.8c,f 11.9 10.0i,j 12.3
Eggs 13.3 5.6 16.5a 5.2 8.2b,e 5.9e 9.9c,f 8.2 8.9d,g 8.2
Milk and dairy products
66.3 12.1 81.1a 9.0 93.4b,e 8.0b 97.7c,h 7.2c 85.9d,g 6.9d
Cheese 2.3 16.6 5.8a 7.7a 4.7b,e 13.7 8.4c,f 10.3c 8.5d,i,j 6.6
Sugar and sweets 23.5 33.4 25.8 28.1 24.7 36.8 23.9c,f,h 30.7 31.3 25.8g,j
Oil, sauces and condiments
6.4 8.1 6.0 5.4a 4.8b,e 8.8e 8.2c,f 10.3 8.2d,g,i,j 7.5g
Alcoholic drinks 33.6 85.9 27.5 70.8 34.5 59.4b 38.2 56.4c,f 34.5 48.3d
Juices 159.8 24.2 138.5a 17.7a 147.3 23.0b 149.0 18.3c 154.0 17.9
Tea and coffee 206.2 9.5 237.2a 6.4a 196.9b 11.6b,e 228.0c,f,h 12.5f,h 367.3g,i,j 9.4g
Soft drinks 84.4 47.4 60.8a 41.8 105.5b,e 40.5b 118.4c,f,h 39.6c 125.6d,g,j 38.1
Pizza 2.5 54.6 2.3 35.9 6.7e 71.7 4.7c,f,h 36.5 10.2 42.4g,i,j
Fried and Roasted snacks
8.1 60.0 6.1a 62.5 13.8b,e 41.0 12.6f,h 54.4c,f,h 9.5d,g,j 42.6d,g,i
Sandwiches 8.4 50.0 6.7 41.5 9.4b,e 47.4 15.5c,f 39.0 18.4i,j 36.2 a Statistically signifi cant differences(p < 0.05) between North and Northeast regions
The food groups most commonly consumed outside of the home were the same for adults and adolescents: alcoholic drinks, fried and roasted snacks and sand-wiches. Among the elderly, consumption of pizza was not so important; only 10% of pizza consumed by the elderly was consumed outside of the home (Table 5).
DISCUSSION
For all the regions, eating out is inversely related to age, is greater among men than among women, more frequent in urban than in rural areas and increases with income. Other studies have also identifi ed higher
frequency of eating out among the young and among men,8,12,13,23 as well as the association between demand
for eating out and income or indicators of income such as schooling and employment situation.2,14,23 In Brazil, a
10% increase in income contributed to a 3% rise in food bought to be consumed outside of the home.7
In contrast to what has been observed in the United States,2,23 the presence of children and family size were
not associated with frequency of eating out in Brazil, except in the North and Northeast regions. Family size is a variable used as an indicator of a household’s socio-economic level and it is estimated that smaller families have higher levels of income and, therefore,
Table 4. Mean per capita daily consumption of food groups (g/day) and percentage consumed outside of the home in the National Dietary Survey, according to sex. Brazil, 2008-2009.
Food groups Male Female
g/day % g/day %
Rice 201.7 14.2 142.3a 11.0a
Corn 23.2 8.6 18.0a 6.5
Beans and other pulses 245.2 13.9 159.3a 10.2a
Vegetables 22.8 23.1 26.3a 15.4a
Legumes 16.7 16.4 15.0a 11.1a
Potato 17.9 24.1 16.3 18.5a
Cassava and yam 22.9 13.4 16.4a 9.6a
Fruit 80.2 18.5 91.1a 13.4a
Oilseeds 0.4 23.5 0.4 20.6
Other cereals 0.5 5.6 0.7 13.7
Pasta 45.3 17.7 36.3a 13.2a
Soup 51.6 13.4 61.2a 8.8a
Bread 58.8 9.7 49.7a 8.3a
Cakes and cookies 23.0 19.5 22.6 18.5
Processed snacks and crackers 7.3 22.7 7.8 18.1
Meat 79.3 18.9 58.3a 13.9a
Pork 10.5 19.2 7.2a 13.6
Chicken 41.3 18.8 34.3a 15.4a
Fish and seafood 27.5 11.7 21.5a 9.6
Salted meat and fi sh 6.8 8.5 4.9a 8.1
Sausages 10.7 12.9 6.8a 10.1
Eggs 13.9 8.2 9.6a 4.6a
Milk and dairy products 86.0 8.1 91.2 7.8
Cheese 6.9 9.4 7.0 9.3
Sugar and sweets 24.3 26.8 26.7 32.2a
Oil, sauces and condiments 7.9 9.3 6.6a 7.6
Alcoholic drinks 60.3 61.4 9.7a 57.6
Juices 154.4 20.5 141.2a 17.3
Tea and coffee 249.8 11.4 244.6 8.6a
Soft drinks 117.6 43.6 83.8a 35.8a
Pizza 5.1 44.1 4.6 40.9
Fried and Roasted snacks 10.5 57.0 9.8 49.3a
Sandwiches 14.4 43.9 10.8a 34.6a
eat out more frequently. In this study, it was only in the North and Northeast regions that frequency of eating out was inversely associated with the number of people in the household, possible as these regions are those with the poorest socio-economic levels in the country, where larger families are also less well off.e
In general, the food groups consumed in the largest quantities, irrespective of where they were consumed, were beans and other pulses and rice, showing the predominance of traditional eating habits in Brazil. However, data on trends suggest negative changes in the availability of these foods in the home, with a 20% decrease in mean acquisition of cereals and pulses in
Table 5. Mean per capita daily consumption of food groups (g/day) and percentage consumed outside of the home in the National Dietary Survey, according to age. Brazil, 2008-2009.
Food groups
Age (years)
10-19 20-59 60 and over
g/day % g/day % g/day %
Rice 170.1 8.3 175.8 15.5a 148.5b,c 5.3b,c
Corn 21.8 8.0 20.3 8.7 19.3 1.4b,c
Beans and other pulses 202.7 7.3 205.1 15.3a 176.0b,c 5.4b,c
Vegetables 14.6 9.1 27.2a 22.6a 28.4b 9.2c
Legumes 8.8 9.6 17.0a 17.1a 21.0b,c 3.6b,c
Potato 15.2 16.1 17.8 24.4a 16.3 12.7c
Cassava and yam 18.0 8.1 19.8 14.5a 20.4 3.4b,c
Fruit 72.7 17.4 83.2a 17.9 120.2b,c 6.4b,c
Oilseeds 0.5 17.4 0.4 24.4 0.3 21.1
Other cereals 0.5 9.1 0.6 14.3 1.0b 0c
Pasta 41.6 14.7 43.2 17.1a 26.4b,c 6.4b
Soup 52.6 20.4 53.2 10.1a 79.2b,c 2.7b,c
Bread 55.6 6.7 54.8 10.9a 48.1b,c 3.0b,c
Cakes and cookies 33.5 20.9 20.3a 20.0a 17.6b 7.3b
Processed snacks and crackers 11.0 25.9 6.6a 20.6a 6.9b 4.1b
Meat 64.3 10.8 71.9a 20.1a 58.3c 6.8b,c
Pork 7.3 8.3 9.6a 20.6 7.5c 6.8b,c
Chicken 36.6 12.6 39.1 19.9 32.0b,c 9.7b,c
Fish and seafood 22.6 10.2 25.0 12.0 24.5 5.6b
Salted meat and fi sh 5.5 8.0 5.9 9.7 6.0 2.3b
Sausages 9.3 11.2 8.8 13.2 6.8b 3.8b,c
Eggs 12.8 4.8 11.8 7.5 9.5b,c 5.6
Milk and dairy products 118.1 9.4 77.4a 8.7 96.7b,c 2.0b,c
Cheese 3.8 7.8 7.5a 10.8 9.4b,c 4.7c
Sugar and sweets 37.7 36.2 23.2a 29.4a 17.5b,c 9.1b,c
Oil, sauces and condiments 7.5 3.8 7.3 10.9a 6.3b,c 4.0c
Alcoholic drinks 5.9 72.2 45.4a 63.0 23.9b,c 35.8b,c
Juices 169.4 15.3 149.3a 21.4a 103.7b,c 10.2b,c
Tea and coffee 182.2 6.4 259.0a 12.2a 293.5b,c 3.6b,c
Soft drinks 131.2 39.6 102.5a 41.5 38.4b,c 26.7b,c
Pizza 4.6 37.5 5.7 44.7 0.8b,c 9.9b,c
Fried and Roasted snacks 13.7 51.9 9.7a 57.6 6.4b,c 24.4b,c
Sandwiches 16.8 40.5 12.5a 39.4 5.8b,c 40.7 a Statistically signifi cant differences(p < 0.05) between adolescents and adults
b between adolescents and the elderly c between adults and the elderly
e Oliveira VH, Loureiro AOF, Holanda MC. Pobreza, distribuição de renda e bolsa família no estado do Ceará. Fortaleza: Instituto de Pesquisa
the last 40 years. Although eating out has increased in Brazil, this does not seem to explain the lower avail-ability of rice and beans in the home, as around 12% of these foods are consumed outside of the home. Moreover, comparisons with previous surveys reveal the increasing importance of processed, convenience foods in food eaten at home, which are probably consumed in place of more traditional items such as rice and beans.e,f
Forty percent of those interviewed reported consuming something outside of the home on the fi rst day’s food record. In studies carried out in other countries, eating out is less frequent than reported in Brazil. Among British adults, 29% reported eating out.13 In Australia,
36% of individuals aged over 18 had consumed food prepared outside of the home on the day preceding the interview.5 In Canada, only consumption of food from
‘fast food’ type restaurants was considered, and on the day preceding the interview, 25% of individuals aged 19 and over reported eating out.b It should be born
in mind that the defi nition of eating out is a variable which does not have a standardized defi nition in the scientifi c literature and may explain the large varia-tions observed.4
In Brazil, the food groups most commonly consumed outside of the home in all regions, in urban and rural areas, among both sexes and for all age groups were alcoholic drinks, fried and roasted snacks, pizza, soft drinks and sandwiches, consistent with data based on spending on eating out in 2002-2003.3 Consumption of
food with high calorie and low nutrient content outside of the home is consistent with studies which describe the signifi cant contribution of eating out to total calorie, fat and sugar consumption, and its low contribution to micronutrient consumption.5,10,13,20 Soft drinks,
alco-holic drinks and savory snacks were those food groups most frequently consumed outside of the home in other studies.14,18,19,24 Fried and roasted snacks characteristic
to Brazil are cheaper than meals and fast food.3
The percentage of high calorie, low nutrient food consumed outside of the home was greater among adolescents. These results are compatible with those seen in another study in the UK, which showed that food consumed by adolescents outside of the home had low levels of nutrients (protein, calcium, iron and vitamin A), but high levels of fat and sugar compared to food eaten at home.1
Direct comparisons with international studies are limited due to different defi nitions of “eating out”, different foci of investigation on specifi c places such as fast food restaurants, school and workplace and other methodological limitations, for example, related
to sampling and methods of assessing consumption. In this study, the defi nition included all food prepared and consumed outside the home, with the aim of excluding food available to eat at home, i.e., those foods that made up the stock of food in the home.
As concerns regional difference, the highest percent-ages of eating out were found in the Southeast, South and midwest regions. The total consumption means of the food groups were, in general, higher in the more developed regions of the country ( Southeast and South). Few food groups had higher total consumption means in the North and Northeast, with the exception of cassava and yam and fi sh and seafood. Thus, although the South and Southeast regions have lower means for eating out for some food groups, this percentage might be more important due to the higher mean consumption of these groups. An example of this is in the lower percentage of fried and roasted snacks consumed outside the home in the Southeast compared to the North and Northeast, whereas the mean total consumption of this group was higher in the Southeast. The percentage of sandwich consumption outside the home was also observed to be similar in all regions, although mean consumption was twice as high in the South and Southeast compared with the North and Northeast.
As regards the households’ locations, those in rural areas tended to eat more traditional Brazilian foods, with higher means for total consumption of beans and other pulses, rice, corn and cassava and yam. The rural areas also showed lower percentages of eating out for the majority of the food groups. However, the food groups most frequently consumed outside of the house: soft drinks, pizza, fried and roasted snacks, sandwiches and alcoholic drinks, the percentages consumed outside of the home were similar for both areas, although total mean consumption is much higher in urban areas than in rural.
The advantages of this analysis are using a representa-tive sample of the Brazilian population aged ten and over according to different demographic and socio-economic strata and analysis of effective consump-tion of these food groups, this being the fi rst study to describe eating out in Brazil and its correlations, based on individual food consumption.
The analysis was based on one day’s food records, and this was a limitation as it does not refl ect usual consumption of these food outside of the home. However, the analyses developed in this study are based on population means, suffi cient to provide adequate estimates of consumption for the population, espe-cially when a suffi ciently large number of individuals is used.25 With regards to the comparative analyses of
the variables used in this study, the use of one day’s
f Instituto Brasileiro de Geografi a e Estatística. Pesquisa de Orçamentos Familiares 2008-2009: avaliação nutricional da disponibilidade
1. Adamson AJ, Rugg-Gunn AJ, Butler TJ, Appleton DR. The contribution of foods from outside the home to the nutrient intake of young adolescents. J Hum Nutr Diet. 1996;9(1):55–68. DOI:10.1046/j.1365-277X.1996.00441.x
2. Beydoun MA, Powell LM, Wang Y. Reduced away-from-home food expenditure and better nutrition knowledge and belief can improve quality of dietary intake among US adults.
Public Health Nutr. 2008;12(3): 369-81. DOI:10.1017/S1368980008002140
3. Bezerra IN, Sichieri R. Characteristics and spending on out-of-home eating in Brazil.
Rev Saude Publica. 2010;44(2):221-9. DOI:10.1590/S0034-89102010000200001
4. Bezerra IN, Curioni C, Sichieri R. Association between eating out of home and body weight. Nutr Rev. 2012;70(2): 65-79. DOI:10.1111/j.1753-4887.2011.00459.x
5. Burns C, Jackson M, Gibbons C, Stoney RM. Foods prepared outside the home: association with selected nutrients and body mass index in adult Australians. Public Health Nutr. 2002;5(3):441-8. DOI:10.1079/PHNPHN2001316
6. Chou SY, Grossman M, Saffer H. An economic analysis of adult obesity: results from the Behavioral Risk Factor Surveillance System. J Health Econ. 2004;23(3):565-87. DOI:10.1016/j.jhealeco.2003.10.003
7. Claro RM, Levy RB, Bandoni DH. Infl uência da renda sobre as despesas com alimentação fora do domicílio, no Brasil, 2002-2003.
Cad Saude Publica. 2009;25(11):2489-96. DOI:10.1590/S0102-311X2009001100018
8. French SA, Harnack L, Jeffery RW. Fast food restaurant use among women in the Pound of Prevention study: dietary, behavioral and demographic correlates. Int J Obes Relat Metab Disord. 2000;24(10):1353-9.
9. Geraldo APG, Bandoni DH, Jaime PC.Aspectos dietéticos das refeições oferecidas por empresas participantes do Programa de Alimentação do Trabalhador na Cidade de São Paulo, Brasil.
Rev Panam Salud Publica. 2008;23(1):19-25. DOI:10.1590/S1020-49892008000100003
10. Guthrie JF, Lin BH, Frazao E. Role of food prepared away from home in the American diet, 1977-78 versus 1994-96: changes and consequences.
J Nutr Educ Behav. 2002;34(3):140-50. DOI:10.1016/S1499-4046(06)60083-3
11. Jabs J, Devine CM. Time scarcity and food choices: an overview. Appetite. 2006;47(2):196-204. DOI:10.1016/j.appet.2006.02.014
12. Kant AK, Graubard BI. Eating out in America, 1987-2000: trends and nutritional correlates. Prev Med. 2004;38(2):243-9. DOI:10.1016/j.ypmed.2003.10.004
13. Kearney JM, Hulshof KF, Gibney MJ. Eating patterns: temporal distribution, converging and diverging foods, meals eaten inside and outside of the home: implications for developing FBDG. Public Health Nutr. 2001;4(2B):693-8. DOI:10.1079/PHN2001156
14. Lachat C, Khanh le NB, Khan NC, Dung NQ, Nguyen VA, Roberfroid D, et al. Eating out of home in Vietnamese adolescents: socioeconomic factors and dietary associations. Am J Clin Nutr. 2009;90(6):1648-55. DOI:10.3945/ajcn.2009.28371
15. Lin BH, Frazão E, Guthrie J. Away-from-home foods increasingly important to quality of American diet. Washington (DF):USDA Economic Research Service; 1999. (Agriculture Information Bulletin, 749).
16. Lozada M, Sanchez-Castillo CP, Cabrera GA, Mata II, Pichardo-Ontiveros E, Villa AR, et al. School food in Mexican children. Public Health Nutr. 2008;11(9):924-33. DOI:10.1017/S1368980007001127
17. Ma H, Huang J, Fuller F, Rozelle S. Getting rich and eating out: consumption of food away from home in REFERENCES
food records generated conservative estimates. With correction for intra-individual variability, other differ-ences may also be considered statistically signifi cant for a value of p < 0.05.
Other studies have also been based on one day’s food records, and were also not corrected for intra-individual variability.5,15,19,20 This correction is only possible with
at least two days’ records.
Another limitation of the study was the impossibility of evaluating different places where food was consumed outside of the home, such as the school of workplace, as meals consumed on these premises can have an impor-tant infl uence on the quality of an individual’s diet.9,14,16
In Brazil, these meals are generally planned out based on specifi c governmental programs and should, there-fore, follow specifi c nutritional recommendations and even serve as tools for promoting health eating. In a
study in the city of São Paulo, Southeastern Brazil, lunch was the meal most frequently eaten outside of the home.22 This analysis does not allow consumption
to be analyzed according to type of meal, although the majority of food eaten outside the home was consumed between 12 and 2 PM.
Research funded by Coordination of Improvement of Personnel with Higher Education – Coordenação de Aperfeiçoamento de Pessoal de Nível Superior (CAPES) – Doctoral Program with Internship Abroad – Programa de Doutorado no País com Estágio no Exterior (PDEE), Process nº 6748-10-4.
Article based on doctoral thesis presented to the Postgraduate program in Clinical and Experimental Physiopathology of the Universidade do Estado do Rio de Janeiro, March 2012.
The authors declare that there are no confl icts of interest.
This manuscript was submitted for publication and underwent a peer review process as any other manuscripts submitted to this publication, and anonymity was guaranteed for authors and reviewers. Editors and reviewers declare no confl icts of interest that may affect the peer-review process.
Urban China. Can J Agric Econ. 2006;54(1):101-19. DOI:10.1111/j.1744-7976.2006.00040.x
18. Nago ES, Lachat CK, Huybregts L, Roberfroid D, Dossa RA, Kolsteren PW. Food, energy and macronutrient contribution of out-of-home foods in school-going adolescents in Cotonou, Benin. Br J Nutr. 2010;103(2):281-8. DOI:10.1017/S0007114509991668
19. Orfanos P, Naska A, Trichopoulos D, Slimani N, Ferrari P, Bakel M, et al. Eating out of home and its correlates in 10 European countries. The European Prospective Investigation into Cancer and Nutrition (EPIC) study. Public Health Nutr. 2007;10(12):1515-25. DOI:10.1017/S1368980007000171
20. Orfanos P, Naska A, Trichopoulou A, Grioni S, Boer JM, Bakel MM, et al. Eating out of home: energy, macro-and micronutrient intakes in 10 European countries. The European Prospective Investigation into Cancer and Nutrition. Eur J Clin Nutr. 2009;63(Suppl 4):S239-62. DOI:10.1038/ejcn.2009.84
21. Paulin GD. Let’s do lunch: expenditures on meals away from home. Mon Labor Rev. 2000;123(5):36-45.
22. Sanches M, Salay E. Alimentação fora do domicílio de consumidores do município de Campinas, São Paulo. Rev Nutr. 2011;24(2):295-304. DOI:10.1590/S1415-52732011000200010
23. Stewart H, Yen ST. Changing household characteristics and the away-from-home food market: a censored equation system approach. Food Policy. 2004;29(6):643-58. DOI:10.1016/j.foodpol.2004.10.003
24. Vandevijvere S, Lachat C, Kolsteren P, Van Oyen H. Eating out of home in Belgium: current situation and policy implications. Br J Nutr. 2009;102(6):921-8. DOI:10.1017/S0007114509311745