1Universidade Federal do Rio de Janeiro, Instituto de Nutrição Josué de Castro, Observatório de Epidemiologia Nutricional. Av.
Carlos Chagas Filho, 367, Bloco J, 2º andar, Cidade Universitária, Ilha do Fundão, 21941-902, Rio de Janeiro, RJ, Brasil. Correspondência para/Correspondence to: MBT CASTRO. E-mail: <[email protected]>.
2Universidade Federal de Mato Grosso, Instituto de Saúde Coletiva, Programa de Pós-Graduação em Saúde Coletiva. Cuiabá,
MT, Brasil.
Support: Fundação Universitária José Bonifácio, Universidade Federal do Rio de Janeiro (Process: 8149/3) and the Fundação Carlos Chagas Filho for Amparo à Pesquisa do Estado do Rio de Janeiro (Protocol nº 26/171.275/98). Research, support of Rio de Janeiro State Conselho Nacional de Desenvolvimento Científico e Tecnológico.
Association between sociodemographics
factors and dietary patterns
during pregnancy
Associação entre fatores sociodemográficos
e padrões de consumo alimentar
durante a gestação
Maria Beatriz Trindade de CASTRO1
Rita Adriana Gomes de SOUZA2
Ana Amélia Freitas VILELA1
Gilberto KAC1
A B S T R A C T
Objective
To investigate the association between socio-demographic factors and dietary patterns in pregnancy.
Methods
Cross-sectional study with baseline data from a cohort of 421 postpartum women aged 18 and 45 years resident in Rio de Janeiro, Brazil. Dietary intake was evaluated with a validated food frequency questionnaire at 15 days following delivery, having as time frame the second and third pregnancy trimesters. Dietary patterns were identified using factor analysis for principal components analysis. The association between socio-demographic factors and the identified dietary patterns was assessed with multiple linear regression analysis.
Results
flour and pasta; breads; cake and cookies; soda and juice; sugar and sweets; fatty foods; meats; chicken; and eggs. The linear regression showed that the income (β=0.0002; 95%CI: 0.0002-0.0004) and schooling (β=0.0491; 95%CI: 0.0264-0.0718) were positively associated with healthy pattern, and parity (β=-0.1044; 95%CI: -0.1665- -0.0423) and skin color (β=-0.3102; 95%CI: -0.5256- -0.0947) were negatively associated. Skin color (β=0.1647; 95%CI: 0.0378- 0.2916) and marital status (β=0.1065; 95%CI: 0.0062- 0.2067) were positively associated with mixed pattern and income (β=-0.0001; 95%CI:-0.0002- -0.0001) and schooling (β=-0.0281; 95%CI: -0.0417- -0.0146) were negatively associated.
Conclusion
Socio-demographic factors such as income, schooling, skin color, marital status and parity were associated with dietary patterns in this sample of postpartum women residents in Rio de Janeiro.
Indexing terms: Demographic data. Factor analysis. Food consumption. Pregnant women. Socioeconomic factors.
R E S U M O
Objetivo
Investigar a associação entre fatores sociodemográficos e padrões de consumo alimentar gestacional.
Métodos
Estudo transversal, com dados da linha de base de uma coorte com 421 puérperas entre 18 e 45 anos, residentes no Rio de Janeiro. O consumo alimentar foi avaliado com um questionário de frequência alimentar validado, aplicado aos 15 dias do pós-parto, e teve como referência o segundo e o terceiro trimestres gestacionais. Os padrões alimentares foram identificados a partir da análise fatorial por meio de análise de componentes principais. A associação entre os fatores sociodemográficos e os padrões alimentares foi avaliada com regressão linear múltipla.
Resultados
Foram identificados dois padrões alimentares: i) saudável: frutas; folhosos; hortaliças; peixe; raízes, milho e batata; leite e derivados e mate, e, negativamente para o consumo de álcool e café; e ii) misto: arroz; feijão; farinhas e macarrão; pães; bolo e biscoito; refrigerante e suco; açúcares e doces; alimentos gordurosos; carnes; frango e ovos. Na regressão linear, a renda (β=0,0002, IC95%: 0,0002-0,0004) e a escolaridade (β=0,0491, IC95%: 0,0264-0,0718) associaram-se positivamente ao padrão saudável, e a paridade (β=0,1044, IC95%: -0,1665- -0,0423) e a cor da pele (β=-0,3102, IC95%: -0,5256- -0,0947) associaram-se negativamente. A cor da pele (β=0,1647, IC95%: 0,0378-0,2916) e o estado marital (β=0,1065, IC95%: 0,0062-0,2067) associaram positivamente ao padrão misto; e a renda (β=-0,0001, IC95%: -0,0002- -0,0001) e a escolaridade (β=-0,0281, IC95%: -0,0417- -0,0146) associaram-se negativamente.
Conclusão
Fatores sociodemográficos como a renda, a escolaridade, a cor da pele, o estado marital e a paridade influenciaram os padrões alimentares nessa amostra de puérperas residentes no Rio de Janeiro.
Termos de indexação: Dados demográficos. Análise fatorial. Consumo de alimentos. Gestantes. Fatores socioeconômicos.
cultural6,7, physiologic, genetic8, and demographic9
factors.
Studies on nutritional epidemiology have analyzed the diet of populations using their dietary patterns6,10 and associating these patterns
with sociodemographic determinants during pregnancy9,11-13. Principal Component Analysis
(PCA) is one of the methods used for assessing
I N T R O D U C T I O N
Dietary nutrient adequacy during pregnancy is usually assessed by estimating the intake of specific macro and micronutrients, foods, and food groups1-4. Although these studies are
dietary patterns14. This analytical procedure allows
assessing a diet within a multidimensional context of exposure6,10 by reducing the number of dietary
variables, which are grouped into factors composed of correlated foods. Analysis of dietary patterns assesses the global effect of diet on health and identifies population groups at the greatest risk of diet-related morbidities15,16.
Northstone et al.9 used a Food Frequency
Questionnaire (FFQ) to assess the food intake of 12,053 pregnant women on the third trimester of pregnancy and found five distinct dietary patterns. These authors found a positive association between schooling and the pattern called “health conscious”. Arkkola et al.12 found
that the mother’s age and schooling were positively associated with “healthy” and “low-fat foods” patterns when they studied 3,730 Finnish women. To date, only one study about the dietary patterns of pregnant women was published in Brazil17.
Food intake during pregnancy varies greatly18. The analysis of dietary patterns can be
a guide for specific groups of women according to their demographic and socioeconomic determinants, promoting a healthier diet during pregnancy. Hence, the aim of the present study was to investigate if demographic and socioeconomic factors are associated with dietary patterns during pregnancy.
M E T H O D S
Study design and population
This cross-sectional study used the baseline data of a prospective cohort of 479 women aged 18 to 45 years. The study was conducted from May 1999 to April 2001. The prospective cohort design included 15 months of recruitment and 9 months of follow-up, and collected data on the following occasions: 15 days after delivery (baseline), and 2, 6, and 9 months postpartum. The participants were recruited for the cohort
during prenatal and newborn Bacillus Calmette-Guérin (BCG) immunization visits, performed at the Municipal Health Center Marcolino Candau, and immediately after delivery at the maternity hospital of the Praça XV, both located in the municipality of Rio de Janeiro, Brazil.
The present study analyzed only the baseline data. Forty-seven women aged less than 18 years and two with a daily total energy intake in excess of 6,000kcal were excluded. Of the 430 (100.0%) eligible women, 421 (97.9%) answered the FFQ.
Dependent variable
A total of 421 postpartum women answered the FFQ approximately 15 days after delivery. The FFQ, previously validated by Sichieri & Everhart19, was administered to collect food
intake data during the second and third trimesters of pregnancy1. This instrument was validated to
investigate food intake during the six months prior to its administration19.
breads, and herbal mate tea were not grouped because they were consumed frequently. Other foods such as chicken, eggs, and fish were placed in individual groups because they have a unique nutritional composition. Alcoholic beverages and coffee were kept in the same group because they were consumed only occasionally during pregnancy, and also because they should be avoided during this time.
The factor analysis for PCA determined the dietary patterns of the women during pregnancy. Commonalities greater than 0.30 determined whether the groups were correctly correlated. The following criteria established the number of factors (patterns): (1) eigenvalues >1.50 and (2) the Scree test plots. After varimax orthogonal rotation, factor loadings above 0.20 limited the intercorrelation between the dietary variables given by the factors10,20. The internal consistency
of dietary pattern identified was given by Cronbach’s alpha. Next, the factors were labeled according to the most prevalent foods14-16.
Independent variables
The following sociodemographic and obstetric variables were selected as independent: family income (reais), schooling (years), skin color (white or brown/black), marital status (married/ living together or single/other) and parity (number of deliveries). Pregnancy-related information was collected at baseline using a structured questionnaire.
Covariates
Information about total energy intake (calories), pre-pregnancy Body Mass Index (BMI) [pre-pregnancy weight (kg)/height2 (meters), and
age (years) were used as adjustment variables in data analysis.
Total energy intake was determined by a program developed by Sichieri21 in the statistical
package Statistical Analysis System (SAS) version
8.2. The usual food intake was converted into daily total energy intake by multiplying each food consumed in standardized portions22 by the daily
intake frequency: more than 3 times a day; 2 to 3 times a day; once a day; 5 to 6 times a week; 2 to 4 times a week; once a week; 1 to 3 times a month; never or hardly ever. The energy content of the foods was given by the nutrient composition database from Escola Paulista de
Medicina23. If a food was not listed in the
aforementioned database, the food composition table of the National Household Expenditure Study was used24.
The pre-pregnancy BMI was obtained by pre-pregnancy weight reported by women and their height was measured by a stadiometer of the brand Holtain-Harpeden (Crymych, United Kingdom) with an accuracy of 0.1 cm. The women were measured barefoot.
Statistical analysis
The Student’s t test and the Chi-square test compared the independent variables and covariates according to the forth quartile of identified dietary patterns. Bivariate linear regression analysis considered the dietary pattern scores as the outcome variable. Age and total energy intake were used as adjustment variables. Although the pre-pregnancy BMI of women with healthy and mixed dietary patterns were not different distributed, this covariate was used as an adjustment variable because its p-value was <0.20 in the bivariate linear regression analysis. The dependent variable of the final multiple linear regression model was the score of each dietary pattern, and the model was adjusted for age, total energy intake, and pre-pregnancy BMI. The significance level was set at p<0.05.
Ethical aspects
The study was approved by the Research Ethics Committee of the Núcleo de Estudos em
do Rio de Janeiro (UFRJ) under Protocol number 041/98. All participants signed an Informed Consent Form before they joined the study. More information about the study design and population can be found elsewhere4,25.
R E S U L T S
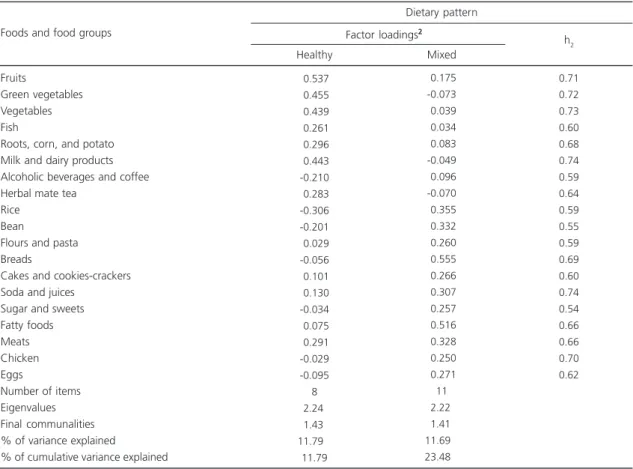
Two dietary patterns were identified and labeled healthy and mixed. Their eigenvalues were 2.24% and 2.22%, respectively. The accumulated variance was 23.48%. The healthy pattern explained 11.79% of the total variance and consisted of fruits; green vegetables; vegetables; fish; roots, corn and potato; milk and dairy products; and herbal mate tea; and inversely with alcohol and coffee intake. The mixed pattern explained 11.69% of the total variance and
consisted of rice; bean; flours and pasta; breads; cake and cookies-crackers; soda and juices; sugar and sweets; fatty foods; meats; chicken, and eggs (Table 1).
Women who adhered more to the healthy pattern were older (28.4x24.7 years, p<0.001), had higher income (R$1.038,00xR$569,00 reais,
p<0.001), and higher schooling (8.1x6 years,
p<0.001) than those who adhered more the mixed pattern. White and married women or those living with a partner also preferred the healthy pattern as opposed to the brown/black women who were single/other(Table 2).
The bivariate linear regression model showed that income and schooling were positively associated with the healthy pattern. Brown or black skin color was positively associated with the mixed pattern and negatively associated with
Table 1. Distribution of factor loadings and communalities (h2) of the two dietary patterns identified in the gestational period1 in a cohort with 421 postpartum women. Rio de Janeiro, Brazil, 1999-2001.
Fruits
Green vegetables Vegetables Fish
Roots, corn, and potato Milk and dairy products Alcoholic beverages and coffee Herbal mate tea
Rice Bean
Flours and pasta Breads
Cakes and cookies-crackers Soda and juices
Sugar and sweets Fatty foods Meats Chicken Eggs
Number of items Eigenvalues Final communalities % of variance explained
% of cumulative variance explained
-0.537
-0.455
-0.439
-0.261
-0.296
-0.443 -0.210
-0.283 -0.306 -0.201
-0.029 -0.056
-0.101
-0.130 -0.034
-0.075
-0.291 -0.029 -0.095 8
-2.240 -1.430 -11.7900
11.79
-0.175 -0.073
-0.039
-0.034
-0.083 -0.049
-0.096 -0.070
-0.355
-0.332
-0.260
-0.555
-0.266
-0.307
-0.257
-0.516
-0.328
-0.250
-0.271 11
-2.220 -1.410 -11.6900 -23.4800
0.71 0.72 0.73 0.60 0.68 0.74 0.59 0.64 0.59 0.55 0.59 0.69 0.60 0.74 0.54 0.66 0.66 0.70 0.62 Foods and food groups
Healthy Mixed
h2 Factor loadings2
Dietary pattern
Table 2. Mean values and proportions of selected variables from the dietary patterns identified in the gestational period1 in a cohort
with 421 postpartum women. Rio de Janeiro, Brazil, 1999-2001.
Age (years)
Total energy intake (kcal) Pre-pregnancy BMI (kg/m²) Income (reais)
Schooling (years) Parity <1 ≥2 Skin color White Brown/Black Marital status
Married or stable partnership Single/Other 28.4 2.867 22.6 1.038 8.1 N 22 35 38 32 59 11 5.79 653 3.24 995 3.45 % 38.6 61.4 54.3 45.7 84.3 15.7 <0.001 <0.001 <0.889 <0.001 <0.001
p value*
<0.746
<0.001
<0.029
Note:*The p value refers to the Student’s t test or Chi-square test. 1Food intake refers to second and third gestational trimester.
SD: Standard Deviation; BMI: Body Mass Index.
24.7 3.874 22.5 569 6.0 N 29 41 26 80 74 32 5.76 666 4.05 414 2.75 % 41.4 58.6 24.5 75.5 69.8 30.2 Variables Mean SD Healthy Mean SD
Mixed p value*
Dietary pattern
Table 3. Bivariate linear regression and multiple linear regression of selected variables from the dietary patterns identified in the gestational period in a cohort with 421 postpartum women. Rio de Janeiro, Brazil, 1999-2001.
Age (years)
Total energy intake (kcal) Pre-pregnancy BMI (kg/m²)†
Income (reais) Schooling (years) Parity (n) Skin color††
Marital status†††
-0.0184 -0.0003 -0.0068 -0.0003 -0.0493 -0.0321 -0.2062 -0.1464 Age (years)
Total energy intake (kcal) Pre-pregnancy BMI (kg/m²)†
Income (reais) Schooling (years) Parity (n) Skin color††
Marital status†††
-0.0128 -0.0008 -0.0160 -0.0001 -0.0336 -0.0230 -0.4242 -0.1213
<0.0050
<0.0010 <0.5140
<0.0010
<0.0010 <0.2710 <0.0630 <0.1080
<0.0500
<0.0010 <0.1240 <0.1363
<0.0060 <0.4150
<0.0010 <0.1820
[0.0056] - [0.0312] [0.0002] - [0.0004] [-0.0274] - [0.0137] [0.0002] - [0.0004] [0.0256] - [0.0729] [-0.0893] - [-0.0252]
[-0.4238] - [0.0114] [-0.3249] - [-0.0321]
[-0.0256] - [-0.00001] [0.0007] - [0.0008] [-0.0363] - [-0.0044] [-0.0002] - [-0.00003] [-0.0572] - [-0.0099] [-0.0324] - [0.0784] [0.2091] - [0.6393] [0.0570] - [0.2997]
--0.0002 -0.0491 -0.1044 -0.3102 -0.1384 -<0.001 <0.001 <0.001 <0.005 <0.112 -[0.0001] - [0.0004] [0.0264] - [0.0718] [-0.1665] - [-0.0423] [-0.5256] - [-0.0947] [-0.3094] - [0.0326]
--0.0001 -0.0281 -0.0328 -0.1647 -0.1065 -<0.001 <0.001 <0.083 <0.011 <0.038 -[-0.0002] - [-0.0001] [-0.0417] - [-0.0146] [-0.0043] - [0.0698]
[0.0378] - [0.2916] [0.0062] - [0.2067] Variables
β p value* 95%CI
Bivariate linear regression
β p value** 95%CI
Multiple linear regression Healthy pattern
Variables
β p value* 95%CI
Bivariate regression
β p value** 95%CI
Multiple regression Mixed pattern
Note:*p value refers to bivariate linear regression; **p value refers to multiple linear regression; The final multiple linear regression model was
adjusted for age, total energy intake, and pre-pregnancy BMI. †Pre-pregnancy Body Mass Index (BMI): [Pre-pregnancy weight (kg)/height 2 (meters)]
was obtained by pre-pregnancy weight reported by women and their height was measured; ††White or Brown/Black; †††Married or stable partnership
schooling. The multiple linear regression model found that income and schooling were positively associated with the healthy pattern and negatively associated with parity and skin color. Income and schooling were negatively associated with the mixed pattern, and marital status and skin color were positively associated with it. The multiple regression model was adjusted for age, total energy intake, and pre-pregnancy BMI (Table 3).
D I S C U S S I O N
Two dietary patterns were identified, a healthy pattern that explained most of the dietary variance and was characterized by fruits; green vegetables; vegetables; roots, corn and potato; milk and dairy products; fish; and herbal mate tea; and inversely with alcoholic beverages and coffee; and a mixed pattern characterized by rice; bean; breads; cakes and cookies-crackers; sodas and juices; fatty foods; meats, chicken, and eggs. Older women with higher schooling, higher income, lower parity, married or living with a partner, and white were more likely to adhere to the healthy pattern. The results of the multiple regression analysis model showed that higher income and schooling were positively associated with the healthy pattern, and higher parity and brown or black skin color were negatively associated with it. Married women or those living with their partners and those with brown or black skin color were positively associated with the mixed pattern, while income and schooling were negatively associated with it. Women who adhered more to the mixed pattern were more likely to be younger and have higher parity.
Among the study limitations, it is important to emphasize that even though the broader study comprises a prospective cohort of postpartum women, the analyses were based exclusively on baseline data, therefore the study has a cross-sectional design. Other limitations include the potential memory bias associated with the FFQ; the arbitrary decisions taken by the researchers, such as food grouping; number of extracted factors; and naming of the retained factors20. However, these decisions are inherent
to PCA, which is being widely used in epidemiological studies on the dietary patterns of pregnant women9,11,12,26.
Women with higher schooling, higher income, lower parity, and white were more likely to adhere to the healthy dietary pattern, a finding corroborated by other studies. Northstone et al.9
studied a cohort of pregnant women in the Southeast region of England and found a pattern that they called “health conscious”, characterized by the intake of salads, fruits, rice, pasta, oat, breakfast cereals, fish, fruit juices, and whole bread. Low schooling and multiple parities were negatively associated with this pattern. Arkkola
et al.12 studied the dietary patterns of a cohort of
pregnant Finnish women and found that higher schooling was associated with the healthy pattern. In a population-based, cross-sectional study of 1,026 women aged 20 to 60 years living in the Brazilian South region, Alves et al.27 found
that those with higher schooling and socioeconomic status adhered more frequently to the healthy pattern. The first Brazilian study to assess the dietary patterns of pregnant women included women attended in health care facilities located in the Brazilian South; this study found that high family income and schooling were positively associated with a healthy dietary pattern17.
In general, higher socioeconomic status and age tend to be associated with healthier food choices13,28. These results are expected since these
factors are related to access to health services and consequently, to health-related information, and additionally, higher income grants better access to healthier foods29 since these are usually more
expensive30. The study women had low income
and schooling. Yet, it was possible to detect a positive association between income and schooling and healthier food choices. This is probably because women tend to prefer healthier foods when they are pregnant to promote better fetal development, even when these foods are nutrient poor 31.
in the Brazilian diet32,33. The women who adhered
to this pattern were married or lived with a partner, had brown or black skin, and had lower income and schooling. Thompson et al.26 found
that the women who adhered to the “junk and fusion pattern”, consisting of foods similar to those of the mixed pattern of the present study, were from middle and low socioeconomic levels. Olinto
et al.32 studied 4,202 adults from a birth cohort
from Pelotas (RS), a city in the Brazilian South region, and found that low schooling and income were associated with the common Brazilian pattern, which consisted of rice, beans, sugar, bread, coffee, butter/margarine.
In the present study, pregnant women with lower schooling and income and brown or black skin were more likely to prefer high-energy, refined carbohydrates, and high-fat foods, characteristic of the mixed pattern. Black women of low socioeconomic level usually do not begin prenatal care during the first trimester of pregnancy34, that may compromise the information
they receive about a healthy pregnancy and consequently, proper diet during pregnancy. The changes in Brazilian eating habits seen in the last years included the replacement of healthier foods by high-fat, high-carbohydrate foods, especially those with sugar, although many people still consume the traditional diet35,36. Most of these
foods are inexpensive and available everywhere, good reasons for women of low income and schooling to adhere more of these foods during pregnancy.
In summary, this study has shown that sociodemographic factors such as income, schooling, skin color, marital status, and parity were associated with the dietary patterns of pregnant women. These sociodemographic factors influenced the dietary patterns of a sample of pregnant women from Rio de Janeiro (RJ), emphasizing that women with higher schooling and income preferred the healthy pattern.
C O N T R I B U T O R S
MBT CASTRO contributed to the data analysis, interpretation of data, and drafting of the manuscript;
RAG SOUZA and AAF VILELA contributed in the interpretation of data, and drafting of the manuscript; and G KAC participated in the design and coordination of the study, interpretation of data, and drafting the manuscript. All authors read, revised, and approved the final manuscript.
R E F E R E N C E S
1. Castro MBT, Kac G, Sichieri R. Padrão de consumo alimentar em mulheres no pós-parto atendidas em um centro municipal de saúde do Rio de Janeiro, Brasil. Cad Saúde Pública. 2006; 22(6):1159-70. doi: 10.1590/S0102-311X2006000600005 2. Black RE, Victora CG, Walker SP, Bhutta ZA,
Christian P, Onis M, et al. Maternal and child undernutrition and overweight in low-income and middle-income countries. Lancet. 2013; 382(9890): 427-51. doi: 10.1016/S0140-6736(13)60937-X 3. Pinto E, Barros H, Silva IS. Dietary intake and
nutritional adequacy prior to conception and during pregnancy: A follow-up study in the north of Portugal. Public Health Nutr. 2008; 12(7):922-31. doi: 10.1017/S1368980008003595
4. Castro MBT, Kac G, Leon AP, Sichieri R. High-protein diet promotes a moderate postpartum weight loss in a prospective cohort of Brazilian women. Nutrition. 2009, 25(11-12):1120-8. doi: 10.1016/ j.nut.2009.02.006
5. Kubota K, Itoh H, Tasaka M, Naito H, Fukuoka Y, Muramatsu Kato K, et al. Changes of maternal dietary intake, bodyweight and fetal growth throughout pregnancy in pregnant Japanese women. J Obstet Gynaecol Res. 2013; 39(9): 1383-90. doi: 10.1111/jog.12070
6. Hu HB. Dietary pattern analysis: A new direction in nutritional epidemiology. Curr Opin Lipidol. 2002; 13(1):3-9.
7. Baião M, Deslandes SF. Alimentação na gestação e puerpério. Rev Nutr. 2006; 19(2):245-53. doi: 10.1590/S1415-52732006000200011
8. Gedrich K. Determinants of nutritional behavior: A multitude of levers for successful intervention. Appetite. 2003; 41(3):231-8.
9. Northstone K, Emmett P, Rogers I. Dietary patterns in pregnancy and associations with socio-demographic and lifestyle factors. Eur J Clin Nutr. 2008; 62(4):471-9. doi: 10.1038/sj.ejcn.1602741 10. Kant AK. Dietary patterns and health outcomes. J
Am Diet Assoc. 2004; 104(4):615-35.
12. Arkkola T, Uusitalo U, Kronberg-Kippila C, Männisto S, Virtanen M, Kenward MG, et al. Seven distinct dietary patterns identified among pregnant Finnish women: Associations with nutrient intake and sociodemographic factors. Public Health Nutr. 2007; 11(2):176-82. doi: 10.1017/S13689800 07000420
13. Lenz A, Olinto MT, Dias-da-Costa JS, Alves AL, Balbinotti M, Pattussi MP, et al. Socioeconomic, demographic and lifestyle factors associated with dietary patterns of women living in Southern Brazil. Cad Saúde Publica. 2009; 25(6):1297-306. doi: 10.1590/S0102-311X2009000600012
14. Olinto MTA. Padrões alimentares: análise de componentes principais. In: Kac G, Sichieri R, Gigante DP. Epidemiologia nutricional. Rio de Janeiro: Fiocruz; 2007. p.213-25.
15. Newby PK, Tucker KL. Empirically derived eating patterns using factor or cluster analysis: A review. Nutr Rev. 2004; 62(5):177-203.
16. Wirfält E, Drake I, Wallström P. What do review papers conclude about food and dietary patterns? Food Nutr Res. 2013; 57:20523. doi: 10.3402/fnr.v 57i0.20523
17. Hoffmann JF, Camey S, Olinto MTA, Schmidt MI, Ozcariz SGI, Melere C, et al. Dietary patterns during pregnancy and the association with sociodemographic characteristics among women attending general practices in southern Brazil: The ECCAGe Study. Cad Saúde Pública. 2013; 29(5):970-80. doi: 10.1590/S0102-311X2013000900014
18. Meltzer HM, Brantsæter AL, Ydersbond TA, Alexander J, Haugen M. Methodological challenges when monitoring the diet of pregnant women in a large study: Experiences from the Norwegian Mother and Children Cohort Study (MOBA). Matern Child Nutr. 2008; 4(1):14-27. doi: 10.1111/ j.1740-8709.2007.00104.x
19. Sichieri R, Everhart JE. Validity of a Brazilian Food Frequency Questionnaire against dietary recalls and estimated energy intake. Nutr Res. 1998; 18(10): 1649-59.
20. Martinez ME, Marshall JR, Sechrest L. Invited commentary: Factor analysis and the search for objectivity. Am J Epidemiol. 1998; 148(1):17-9. 21. Sichieri R. Epidemiologia da obesidade. Rio de
Janeiro: EdUERJ; 1998.
22. Pinheiro ABV. Tabela para avaliação de consumo alimentar em medidas caseiras. 3ª ed. Rio de Janeiro: Atheneu; 1996.
23. Centro de Informática em Saúde. Programa de apoio à nutrição. São Paulo: Unifesp; 1995. 24. Instituto Brasileiro de Geografia e Estatística. Estudo
nacional da despesa familiar: tabela de composição de alimentos. Rio de Janeiro: IBGE; 1985. 25. Kac G, Benício MHD, Valente JG,
Velásquez-Meléndez G. Postpartum weight retention among
women in Rio de Janeiro: A follow-up study. Cad Saúde Pública. 2003: 19(Supl 1):S149-61. doi: 10.1590/S0102-311X2003000700016
26. Thompson JMD, Wall C, Becroft DMO, Robinson E, Wild CJ, Mitchell EA. Maternal dietary patterns in pregnancy and the association with small-for-gestational-age infants. Br J Nutr. 2010; 103(11): 1665-73. doi: 10.1017/S0007114509993606 27. Alves ALS, Olinto MTA, Costa JSD, Bairros FS,
Balbinotti MAA. Padrões alimentares de mulheres adultas residentes em área urbana no Sul do Brasil. Rev Saúde Pública. 2006; 40(5):865-73. doi: 10.1590/S0034-89102006000600017
28. Laaksonen M, Prattala R, Helasoja V, Uutela A, Lahelma E. Income and health behaviours: Evidence from monitoring surveys among Finnish adults. J Epidemiol Community Health. 2003; 57(9):711-7. doi: 10.1136/jech.57.9.711
29. Braveman PA, Cubbin C, Egerter S, Chideya S, Marchi KS, Metzler M, et al. Socioeconomic status in health research: One size does not fit all. JAMA. 2005; 294(22):2879-88. doi:10.1001/jama.294.2 2.2879
30. Attree P. Low-income mothers, nutrition and health: A systematic review of qualitative evidence. Matern Child Nutr. 2005; 1(4):227-40.
31. Reyes NR, Klotz AA, Herring SJ.A qualitative study of motivators and barriers to healthy eating in pregnancy for low-income, overweight, African-American mothers.J Acad Nutr Diet. 2013; 113(9): 1175-81. doi: 10.1016/ j.jand.2013.05.014 32. Olinto MTA, Willett WC, Gigante DP, Victora GC.
Sociodemographic and lifestyle characteristics in relation to dietary patterns among young Brazilian adults. Public Health Nutr. 2010; 14(1):150-9. doi: 10.1017/S136898001000162X
33. Sichieri R. Dietary patterns and their associations with obesity in the Brazilian city of Rio de Janeiro. Obes Res. 2002; 10(1):42-8.
34. Victora CG, Matijasevich A, Silveira MF, Santos IS, Barros AJD, Barros FC. Socio-economic and ethnic group inequities in antenatal care quality in the public and private sector in Brazil. Health Policy Plan. 2010; 25(4):253-61. doi: 10.1093/heapol/czp065 35. Mondini L, Monteiro CA. Mudanças no padrão de alimentação da população urbana brasileira (1962-1988). Rev Saúde Pública. 1994; 28(6):433-9. 36. Souza AM, Pereira RA, Yokoo EM, Levy RB, Sichieri
R. Alimentos mais consumidos no Brasil: Inquérito nacional de alimentação 2008-2009. Rev Saúde Pública. 2013; 47(1 Supl):190S-9S.doi: 10.1590/S0 034-89102013000700005