Abstract
This study aims to provide statistical evidence of the complementarity between classical test theory and item response models for certain educational assessment purposes. Such complementarity might support, at a reduced cost, future development of innovative procedures for item calibration in adaptive testing. Classical test theory and the generalized partial credit model are applied to tests comprising multiple choice, short answer, completion, and open response items scored partially. Datasets are derived from the tests administered to the Portuguese population of students enrolled in the 4th and 6th grades. The results show a very strong association between the estimates of dificulty obtained from classical test theory and item response models, corroborating the statistical theory of mental testing.
Keywords: Generalized partial credit. Item response model. Classical test theory. Educational assessment.
1 Introduction
The increasing usability of computers and Web-based assessments requires innovative approaches to the development, delivery, and scoring of tests. Statistical methods play a central role in such frameworks. The item response model (IRM) (LORD; NOVICK, 1968) has been the most common statistical method used. In computer-based adaptive testing (CAT), IRM allows adaptive
a European Commission, Joint Research Centre - JRC, Econometrics and Applied Statistics.
b University of Beira Interior - UBI, Department of Mathematics. Covilhã, Portugal. University of Lisbon - ULISBOA, CEMAPRE (The Centre for Applied Mathematics and Economics). Lisbon, Portugal.
Recebido em: 09 jun. 2014 Aceito em: 30 abr. 2015
On the complementarity of classical
test theory and item response
models: item dificulty estimates
and computerized adaptive testing
Patrícia Costa a
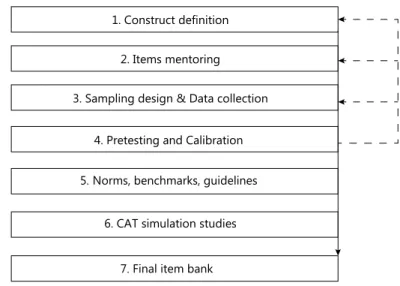
item selection from an item bank, according to examinee proiciency during test administration. The eficiency of CAT is realized through the targeting of item dificulty to the examinee proiciency (WISE; KINGSBURY, 2000). It implies an item bank or multiple item banks properly developed. A good item bank should cover all aspects of the construct to be measured (content validity) and contain a suficient number of items to ensure measurement accuracy in the domain, i.e., for all scale values. Items should fulill requirements set in the American Educational Research Association (AERA), the American Psychological Association (APA), and the National Council on Measurement in Education (NCME) (1999). Stocking (1994) found that doubling the number of item banks reduced test overlap to a much greater extent than doubling the number of items in each bank (apud NYDICK; WEISS, 2009). The development of an item bank for CAT is a complex and multidisciplinary process that follows seven major steps (e.g., BJORNER et al., 2007) represented in Diagram 1, thus, requiring experts from the subject–scientiic areas of Construct Framework (steps 1, 2, 5, and 7), Statistics (steps 3, 4, 5, 6, and 7), and Computer Science and Informatics (steps 3, 6, and 7). Once an item bank is available for CAT use, its management requires decisions on several issues such as item bank size and control, security protocols (including item exposure control), statistical modeling, item removal and revision, item addition, maintenance of scale consistency, and use of multiple banks (WISE; KINGSBURY, 2000). Thereafter, CAT administration is basically the repetition of a two-phase process. As Wise and Kingsbury (2000) explain, irst, an item with dificulty matched to the examinee’s current proiciency estimate is administered. Second, the examinee’s response to the item is scored, and the proiciency estimate is updated. This sequence is repeated until some stopping criterion is met, usually a predetermined maximum number of items or measurement precision. Thus, despite obvious advantages of adaptive testing, there are still some limitations, such as the high cost related to item bank development. However, the cost could be reduced by decreasing expenses on item writing, pretesting, and calibrating new items (VELDKAMP; MATTEUCCI, 2013), involving steps 2, 3, and 4 of Figure 1.
questions: (1) What is the level of association between CTT indexes and IRM parameter estimates? (2) Can CTT provide initial item dificulty estimates for posterior IRM use in CAT?
The CTT model and the generalized partial credit model (GPCM) are applied to data collected from the Portuguese student population enrolled in the 4th and 6th grades and to those who were administered with mathematics and mother-language tests. The number of students involved is approximately 108,000 in each grade. Estimates of item discrimination and dificulty are obtained and compared. Percentile conidence intervals based on 1000 bootstrap samples are presented for correlation between item dificulty estimates. The study is organized as follows: the next section describes the data and statistical methods used. The results are presented in section three, and conclusions are considered in the last section.
2 Methodology
This section comprises three parts. The irst part presents details and characteristics of the data. The second addresses the statistical speciication of models in use and explains how to quantify the level of association between estimates obtained from the CTT and the IRM. The third presents a brief description of various steps in the CAT framework.
1. Construct definition
3. Sampling design & Data collection 2. Items mentoring
6. CAT simulation studies 5. Norms, benchmarks, guidelines
4. Pretesting and Calibration
7. Final item bank
Figure 1. Steps for the development of an item bank.
2.1 Data
In Portugal, Primary School Assessment Tests (Provas de Aferição do Ensino Básico) are the responsibility of GAVE (Gabinete de Avaliação Educacional), the ofice of educational assessment, which aims to evaluate how objectives established for each education cycle are achieved. These instruments are yearly administered to all students enrolled in the fourth and sixth years of schooling, in mathematics, and in the mother-tongue language (Portuguese), according to provisions of law no. 2351/2007, of February 14, II Series. GAVE tests are always administered to the population nationwide and are based on speciic competences of the mathematics and Portuguese subjects presented in the document National Curriculum of Primary School: Key competences and the current syllabus. The mathematics test assesses understanding of concepts and procedures, reasoning and communication abilities, and competence for using mathematics in analysis and problem solving. In the academic year 2006–2007, the mathematics test was administered to 108,441 students attending the 4th grade and also to 108,296 students attending the 6th grade. These tests were composed of two identical parts, including 27 items and containing multiple choice, short answer, completion, and open-ended questions, covering the following content: numbers and calculation; geometry and measurement; statistics and probabilities; and algebra and functions. From now onward, these tests are called Math4 and Math6 for the 4th and 6th grades, respectively.
Portuguese tests involved 108,447 students in the 4th grade and 108,548 students in the 6th grade. Three competences were assessed: reading comprehension, explicit knowledge of language, and written expression. These tests were composed of two parts. The irst part mainly contained short answer items, completion, right or wrong association, and multiple choice questions. The second included extensive composition items in which a text of 20–25 lines is produced. Portuguese tests were composed of 27 and 33 items for the 4th and 6th grades, respectively. From now onward, Portuguese tests of the 4th and 6th grades are called Port4 and Port6, respectively. Before statistical modeling, partial scoring of open-ended answers and extensive composition was performed by experts. The tests’ reliability, as demonstrated by the coeficient of internal consistency, i.e., the coeficient of Kuder–Richardson, is p ≥ 0.85.
2.2 Statistical methods
(p. 17). Two main statistical approaches are used in educational measurement: Classical Test Theory (CTT) and Item Response Models (IRM). Some examples of introductory readings and reviews may be found in Hambleton, Swaminathan, and Rogers (1991), Hambleton (2004) and Klein (2013). The rest of this section presents the model and assumptions underlying classical test theory, explanation and functional speciication of the generalized partial credit model, and a brief review of the complementarity of these statistical methods.
2.2.1 Classical test theory
It is assumed that variable X represents competencies/skills gained by the student
during the learning process. The observable variable X0 is generally obtained by test administration. If tests were instruments with absolute precision, the observed value X0 ,regardless of the test used, would be equal to true value X. In a hypothetical situation where the student is tested t times, equation (1) represents the relationship between the true and the observed value,
X 0
t = X + εt , (t = 1,..., T) (1)
where ε represents the measurement error. Measurement error is assumed to be non-systematic, homoscedastic, and non-correlated with the true value X.
Characteristics of items are quantiied through the discrimination index (ci) and the dificulty index (pi). The discrimination index measures capacity of the item to distinguish the high performance group of students from the low performance group of students, and its values vary from −1 to 1. The dificulty index (pi) is provided by the proportion of correct answers to the item i (e.g., Guilford; Fruchter, 1978). Therefore, high values indicate easy questions.
2.2.2 Item response models
for analyzing responses scored in two or more ordered categories. The aim is to extract from an item more information about the examinee’s level than simply whether the examinee correctly answers the item. Items are ranked in which examinees receive partial credit for successfully completing the various levels of performance needed to complete an item. This model relaxes the assumption of items’ uniform discriminating power and includes parameters to represent item dificulty and discrimination. The model is applied to several types of items, such as multiple choice, short answer, completion, and open response items (with the previous items that were gradually scored). Thus, the GPCM suitable for such data is speciied by equation (2),
Pik (θ) =
k
c mi
j = 1
j = 1 c = 1
exp
exp
ai (θ - βij)
ai (θ - βij)
Σ
Σ
Σ
(k = 1,..., mi) (2)
where
i is the item number (i = 1,.,I; I is the total number of items in the test);
Pik (θ) is the probability that an examinee with latent factor θ selecting the
kth category from m
i possible categories for the polytomous item i; ai is the discrimination parameter for item i, using a logistic metric. In addition,βij = bi - dj, where bi is the dificulty/location parameter of item I, and dj is the parameter of the intercept category, with d1 = 0.
According to equation (2), the probability of the student to answer (or to be ranked) in the k category is a conditional probability on the answer to the k-1 category. That is to say, the answer to category k has underlying response criteria satisfaction that is associated with the previous category. Estimates are obtained by maximum likelihood procedure, using the EM algorithm. This model, estimation procedures, and maths data were utilized by Ferrão, Costa, and Oliveira (2015) for linking scales and by Ferrão and Prata (2014) for a simulation CAT study.
2.2.3 Complementarity
the unity of item response models by sitting them within an explicit linear modelling framework. The logistic models […] can be seen merely to be one class out of many possible classes of models. […] In practice, the simple identity models used over the effective response range, typically give near equivalent results (p. 163).
The paper published by Hambleton and Jones (1993) describes and compares (similarities and differences of) the methodological approaches mentioned above. Two of these approaches are relevant for this paper’s purpose. They concern the relationship between the IRM item dificulty parameter, the CTT index of dificulty, and the relationship between the IRM discrimination parameter and the CTT bi-serial correlation. Lord (1980) describes a monotonic relationship between the CTT index of item dificulty (pi) and the IRM item dificulty parameter (bi) so that as pi increases, bi decreases when all items discriminate equally. If items have unequal discrimination values, then the relationship between them depends on the item bi-serial correlation. Lord also demonstrates that, under certain conditions, the item bi-serial correlation ri and the IRM item discrimination parameter approximately monotonically increase functions of one another, i.e.,
ai = ri
√
~ 1 - r 2
i
(3)
where
ai is the item i discrimination parameter estimate, and
ri is the item i bi-serial correlation.
2.3 Computer-based adaptive testing
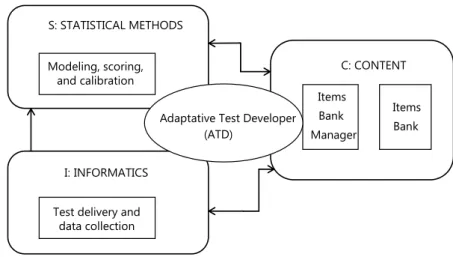
The CAT platform concerns operations from modular structures of Statistical Methods (S), Content (C), and Informatics (I), which provide elements to be integrated throughout the Adaptive Test Developer (ATD). The modular structure S comprises statistical methods for item calibration, scoring, scale fitting, and linking, examinees’ ability modeling, test measurement error, and reliability; structure I contains a computer or Web application with interfaces to examinees via desktop or mobile devices. The server connects the database that contains the item bank (module C) and the statistical methods (module S) using the ATD to adapt tests to examinees; structure C
includes the item bank (in general, each item record is defined by question, by type of question and field specification, correct answer, its statistical properties-discrimination, difficulty, information, level of exposure to date, and whether it is an anchor item), and the item bank manager, which is software for operations with items.
3 Results
CTT and GPCM were applied to Math4, Port4, Math6, and Port6 data. Tables 1 to 4 contain discrimination and dificulty indexes, bi-serial correlations, and estimates of GCPM discrimination and dificulty parameters. Since intersection parameters are not used for any research questions addressed in this study, their estimates are not presented. The chi-square hypotheses test for goodness of it suggests this IRM as an adequate model at the 5% level of signiicance.
Figure 2. Knowledge areas and their relationships supporting a CAT platform.
Modeling, scoring, and calibration
Test delivery and data collection
Items Bank Manager
Items Bank C: CONTENT S: STATISTICAL METHODS
I: INFORMATICS
Adaptative Test Developer (ATD)
Regarding Math4 test, joint analysis of item properties based on CTT and IRM, presented in Table 1, indicates that most items discriminate; items 4, 9, and 14 slightly discriminate; and item 19 is very discriminatory in both approaches. Concerning the dificulty parameter, we verify that approximately 44% of items are easy, whereas items 4 and 14 are very easy. In general, results demonstrate that the tests are mainly composed of discriminative and very discriminative items and, additionally, items of all dificulty levels.
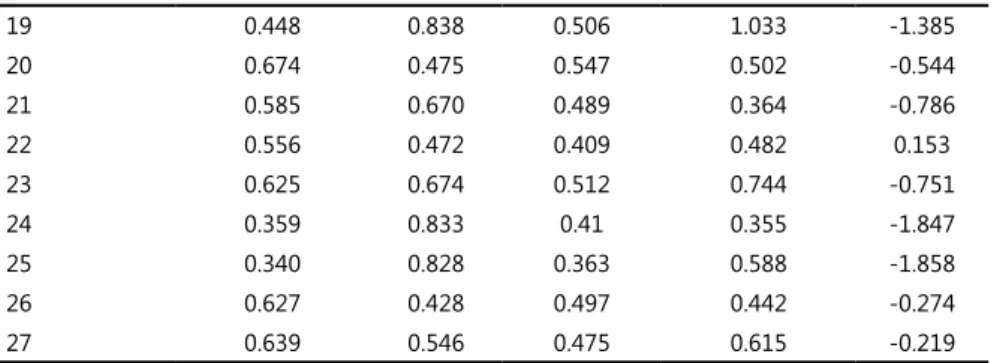
A joint analysis of Port4 reveals that, in general, the test items do discriminate, with the exception of item 6, which slightly discriminates, and item 26, which is very discriminative and has a medium dificulty level. Additionally, items 2, 5, 8, 12, 16, 17, and 20 are very easy.
Concerning Math6 items, analysis based on CTT and IRM shows that the most discriminative items are 13, 15, 16, 19, and 21; the least discriminative items are
Table 1. Item indexes, bi-serial correlation and GPCM estimates, 4th grade, and mathematics.
Math4 CTT IRM
Item
Discrimination Index
(c)
Dificulty
Index
(p)
Bi-serial Correlation
(r)
Discrimination Estimate
(a)
Dificulty
Estimate
(b)
1 0.650 0.647 0.532 0.785 -0.611
2 0.610 0.630 0.507 0.714 -0.569
3 0.569 0.303 0.458 0.340 0.215
4 0.126 0.913 0.172 0.278 -5.159
5 0.670 0.667 0.594 0.604 -0.670
6 0.414 0.837 0.505 0.981 -1.412
7 0.330 0.817 0.381 0.291 -1.890
8 0.742 0.366 0.551 0.393 0.241
9 0.242 0.874 0.318 0.219 -2.835
10 0.610 0.542 0.461 0.302 -0.210
11 0.412 0.787 0.43 0.633 -1.478
12 0.215 0.917 0.364 0.821 -2.220
13 0.618 0.703 0.545 0.860 -0.817
14 0.107 0.947 0.179 0.283 -4.001
15 0.373 0.800 0.37 0.535 -1.767
16 0.558 0.743 0.544 0.492 -0.951
17 0.747 0.582 0.588 0.421 -0.467
18 0.500 0.757 0.472 0.530 -1.984
Table 2. Item indexes, bi-serial correlation and GPCM estimates, 4th grade, and Portuguese.
Port4 CTT IRM
Item
Discrimination Index
(c)
Dificulty
Index
(p)
Biserial Correlation
(r)
Discrimination Estimate
(a)
Dificulty
Estimate
(b)
1 0.380 0.744 0.376 0.270 -2.415
2 0.228 0.870 0.305 0.329 -3.569
3 0.490 0.246 0.461 0.324 0.116
4 0.312 0.771 0.334 0.297 -2.507
5 0.335 0.806 0.380 0.343 -3.188
6 0.196 0.162 0.229 0.286 0.640
7 0.438 0.668 0.412 0.299 -1.435
8 0.272 0.897 0.417 0.450 -3.130
9 0.493 0.461 0.424 0.375 -2.328
10 0.565 0.549 0.534 0.239 -1.530
11 0.388 0.266 0.352 0.363 -1.106
12 0.243 0.879 0.393 0.579 -2.343
13 0.486 0.723 0.519 0.535 -1.209
14 0.398 0.350 0.331 0.318 -0.985
15 0.457 0.701 0.461 0.475 -2.603
16 0.360 0.829 0.476 0.313 -2.141
17 0.321 0.881 0.534 0.764 -1.952
18 0.364 0.333 0.357 0.268 -0.739
19 0.419 0.675 0.408 0.303 -1.726
20 0.102 0.955 0.283 0.474 -3.221
21 0.673 0.307 0.650 0.895 -0.427
Continue Continuation
19 0.448 0.838 0.506 1.033 -1.385
20 0.674 0.475 0.547 0.502 -0.544
21 0.585 0.670 0.489 0.364 -0.786
22 0.556 0.472 0.409 0.482 0.153
23 0.625 0.674 0.512 0.744 -0.751
24 0.359 0.833 0.41 0.355 -1.847
25 0.340 0.828 0.363 0.588 -1.858
26 0.627 0.428 0.497 0.442 -0.274
27 0.639 0.546 0.475 0.615 -0.219
Continuation
22 0.433 0.157 0.480 1.286 -0.219
23 0.447 0.169 0.494 2.032 -0.421
24 0.476 0.187 0.500 1.955 -0.549
25 0.438 0.163 0.480 1.554 -0.768
26 0.524 0.228 0.507 1.091 -0.517
27 0.557 0.283 0.480 0.598 -1.055
Font: Authors (2014).
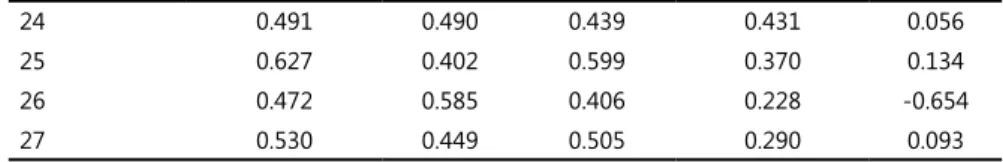
Table 3. Item indexes, bi-serial correlation and GPCM estimates, 6th grade, and mathematics.
Math6 CTT IRM
Item
Discrimination Index
(c)
Dificulty
Index
(p)
Biserial Correlation
(r)
Discrimination Estimate
(a)
Dificulty
Estimate
(b)
1 0.348 0.841 0.381 0.402 -2.034
2 0.647 0.527 0.579 0.531 -0.476
3 0.280 0.864 0.342 0.544 -2.296
4 0.546 0.683 0.534 0.625 -0.888
5 0.352 0.805 0.379 0.508 -1.872
6 0.738 0.427 0.721 0.347 0.062
7 0.348 0.841 0.412 0.431 -1.664
8 0.381 0.703 0.353 0.197 -1.541
9 0.728 0.350 0.762 0.431 0.221
10 0.122 0.181 0.169 0.219 4.170
11 0.569 0.437 0.496 0.300 -1.102
12 0.126 0.037 0.319 0.536 2.200
13 0.559 0.362 0.519 0.734 0.573
14 0.632 0.406 0.607 0.307 0.206
15 0.699 0.262 0.818 0.612 0.564
16 0.728 0.360 0.788 0.882 -0.138
17 0.544 0.247 0.596 0.364 0.447
18 0.527 0.765 0.552 0.485 -1.248
19 0.530 0.348 0.531 0.749 0.629
20 0.175 0.049 0.402 0.462 2.019
21 0.476 0.260 0.486 0.696 1.110
22 0.593 0.298 0.591 0.440 0.017
23 0.461 0.208 0.501 0.336 0.599
Continuation
24 0.491 0.490 0.439 0.431 0.056
25 0.627 0.402 0.599 0.370 0.134
26 0.472 0.585 0.406 0.228 -0.654
27 0.530 0.449 0.505 0.290 0.093
Font: Authors (2014).
Table 4. Item indexes, bi-serial correlation and GPCM estimates, 6th grade, and Portuguese.
Port6 CTT IRM
Item
Discrimination Index
(c)
Dificulty
Index
(p)
Biserial Correlation
(r)
Discrimination Estimate
(a)
Dificulty
Estimate
(b)
1 0.484 0.607 0.416 0.404 -0.699
2 0.512 0.618 0.471 0.354 -2.931
3 0.258 0.320 0.231 0.175 2.594
4 0.028 0.991 0.141 0.470 -6.256
5 0.052 0.978 0.166 0.414 -5.447
6 0.249 0.442 0.202 0.207 -3.025
7 0.223 0.892 0.342 0.485 -2.872
8 0.417 0.743 0.407 0.269 -2.272
9 0.161 0.921 0.269 0.487 -3.279
10 0.452 0.439 0.379 0.211 -0.715
11 0.479 0.686 0.439 0.376 -1.328
12 0.451 0.529 0.386 0.159 -1.844
13 0.299 0.668 0.263 0.259 -1.659
14 0.207 0.192 0.207 0.109 3.398
15 0.289 0.825 0.330 0.415 -2.405
16 0.513 0.558 0.470 0.506 -0.312
17 0.118 0.059 0.212 0.423 2.028
18 0.142 0.040 0.348 0.407 1.471
19 0.283 0.111 0.402 0.416 -0.560
20 0.217 0.092 0.327 0.617 0.977
21 0.391 0.207 0.463 0.343 0.988
10 and 20. The dificulty index and parameter indicate that the easiest items are items 1, 3, 5, 7, and 18; the most dificult items are 10, 12, and 20. In particular, item 12 is slightly discriminative according to the CTT approach and discriminative according to the GPCM approach.
For Port6 items, analysis based on the two approaches reveals that items 3, 4, 5, 7, 9, 13, 14, 15, 17, 18, 19, and 26 discriminate slightly and that there is one set of six very easy items (4, 5, 7, 9, 15, and 26) and a set of three very dificult items (14, 17, and 18). The relationship between the bi-serial correlation (r) and the discrimination parameter estimate (a), given by formula (3), indicates a moderate correlation varying from 0.4 to 0.5.
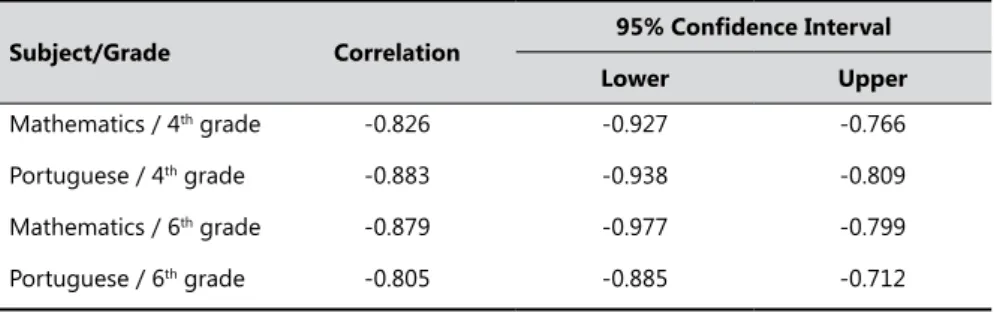
Concerning dificulty, the correlation between p and b is very strong since it ranges from −0.8 to −0.9, i.e., the correlation is −0.83 in Mathematics 4th grade, −0.88 in Portuguese 4th grade, −0.88 in Mathematics 6th grade, and −0.80 in Portuguese 6th grade. Percentile confidence intervals of 95% based on 1000 bootstrap samples are presented in Table 5. The intervals conirm that in the population, the correlation is strong since its absolute value is always greater than 0.71. In this sense, results support this study’s purpose of providing empirical evidence on the complementarity between the two statistical approaches regarding the estimate of item dificulty.
Continuation
22 0.475 0.506 0.422 0.419 -2.155
23 0.389 0.667 0.371 0.428 -2.911
24 0.405 0.279 0.380 0.460 -0.605
25 0.508 0.579 0.464 0.410 -1.261
26 0.052 0.978 0.200 0.428 -3.202
27 0.603 0.469 0.517 0.559 -1.223
28 0.509 0.228 0.524 0.813 -0.768
29 0.420 0.175 0.496 1.159 -0.427
30 0.415 0.168 0.493 1.401 -0.610
31 0.391 0.141 0.497 1.295 -0.761
32 0.354 0.128 0.447 1.160 -0.339
33 0.585 0.279 0.567 0.514 -0.603
4 Conclusion
The results obtained in this study show a very strong correlation between the CTT index of dificulty and the IRM item dificulty parameter estimate. The correlation is −0.83 in Mathematics 4th grade, −0.88 in Portuguese 4th grade, −0.88 in Mathematics 6th grade, and −0.80 in Portuguese 6th grade. The results also suggest that the level of association does not depend on subject or on grade. A moderate relationship between the IRM estimate of discrimination and the approximation given by the bi-serial function was veriied. In addition, it was shown that even when items do not discriminate equally, a monotonic relationship exists between the CTT index of item dificulty and the IRM item dificulty parameter. Therefore, CTT may be utilized as initial estimates for item pretesting and pre-calibration in item bank development, particularly supporting implementation of Web-based adaptive tests. Since the sample size required for item pretesting and calibration is a crucial aspect for development of item banks, these are promising results for the future of computer or Web-based testing. Further work is needed to determine whether changes in pretesting and in algorithms related to adaptive test design and administration affect score precision and reliability.
Acknowledgments
This study is based on work sponsored in part by the Portuguese Ministry of Education under the protocol signed with Universidade da Beira Interior in November 2007, with the purpose of developing the project “Improving the quality of educational assessment tests and scales of measurement.”
This work was partially funded by Fundação para a Ciência e Tecnologia throught the project PEst-OE/EGE/UI0491/2014.
Table 5. Correlation and Bootstrap Conidence Intervals.
Subject/Grade Correlation
95% Conidence Interval
Lower Upper
Mathematics / 4th grade -0.826 -0.927 -0.766
Portuguese / 4th grade -0.883 -0.938 -0.809
Mathematics / 6th grade -0.879 -0.977 -0.799
Portuguese / 6th grade -0.805 -0.885 -0.712
Sobre a complementaridade da teoria clássica dos
testes e dos modelos de resposta ao Item: estimativas da
diiculdade do item e testes adaptativos computarizados
Resumo
O presente artigo tem por objetivo fornecer evidência estatística sobre a complementaridade
entre a teoria clássica dos testes e os modelos de resposta ao item para determinados ins de
avaliação educacional. Essa complementaridade pode contribuir para o desenvolvimento futuro de processos inovadores de calibração dos items no contexto de testes adaptativos, a custo reduzido. A teoria clássica dos testes e o modelo de resposta ao item de crédito parcial generalizado são aplicados a testes compostos por items de múltipla escolha,
de resposta curta, de completamento e de resposta aberta, parcialmente classiicados.
Os conjuntos de dados advêm dos testes realizados junto da população portuguesa de
estudantes inscritos no 4º e no 6º ano. Os intervalos de coniança de 95% baseados em 1.000 amostras bootstrap revelam uma forte associação entre as estimativas da diiculdade
do item, corroborando a teoria estatística de testes psicológicos.
Palavras-chave: Crédito parcial generalizado. Modelo de resposta ao item. Teoria
classica dos testes. Avaliação educacional.
En la complementariedad de la teoría clásica de
los tests y los modelos de la teoría de respuesta al
ítem: estimaciones de la diicultad de un ítem y tests
adaptativos computarizados
Resumen
El presente estudio tiene como inalidad presentar evidencia estadística de la correlación
entre la Teoría Clásica de los Tests (TCT) y los modelos de la Teoría de Respuesta al
Ítem (TRI) para determinados ines de evaluación educativa. Dicha correlación podría
contribuir al desarrollo de futuros procedimientos innovadores, a bajo costo, para la calibración de los ítems en el contexto de los sistemas de evaluación adaptables. La Teoría Clásica de los Tests y el Modelo del Crédito Parcial Generalizado de Respuesta al Ítem, se aplican a pruebas que están formadas por ítems de opción múltiple, de respuestas
breves, de completar espacios o de respuesta abierta que se caliican de manera parcial.
Los conjuntos de datos se extrajeron de las pruebas administradas a población portuguesa
compuesta por estudiantes procedentes de 4° y 6° grado. Los intervalos de conianza del percentil 95º obtenidos mediante muestras bootstrap ponen de relieve una fuerte relación entre las estimaciones de la diicultad del ítem y por ende, corroboran la teoría
estadística de los tests mentales.
Palabras clave: Crédito parcial generalizado. Modelos de respuesta al ítem. Teoría
References
AMERICAN EDUCATIONAL RESEARCH ASSOCIATION – AERA; AMERICAN PSYCHOLOGICAL ASSOCIATION – APA; NATIONAL COUNCIL ON MEASUREMENT IN EDUCATION – NCME. Standards for educational and psychological testing. Washington, D.C., 1999.
BJORNER, J. et al. Developing tailored instruments: item banking and computerized adaptive assessment. Quality of Life Research, v. 16, n. 1 Suppl., p. 95-108, Aug. 2007. DOI:10.1007/s11136-007-9168-6
FERRÃO, M. E.; COSTA, P.; OLIVEIRA, P. N. Generalized partial credit item response model: linking scales in the assessment of learning.
Journal of Interdisciplinary Mathematics, v. 18, n. 4, p. 339-54, Jun. 2015. DOI: 10.180/09720502.2014.932119
FERRÃO, M. E.; PRATA, P. Item response models in computerized adaptive testing: a simulation study. Lecture Notes in Computer Science, v. 8581, p. 552-65, 2014. Apresentado no 14th International Science and Its Applications – ICCSA 2014, Guimarães, Portugal, 2014. DOI:10.1007/978-3-319-09150-1_40 GOLDSTEIN, H.; WOOD, R. Five decades of item response modelling. British Journal of Mathematical and Statistical Psychology, v. 42, n. 2, p. 139-67, Nov. 1989. DOI:10.1111/j.2044-8317.1989.tb00905.x
GUILFORD, J. P.; FRUCHTER, B. Fundamental statistics in psychology and education. 6. ed. New York: McGraw-Hill, 1978.
HAMBLETON, R. K. Theory, methods, and practices in testing for the 21st century. Psicothema, v. 16, n. 4, p. 696-701, 2004.
HAMBLETON, R. K.; JONES, R. W. Comparison of classical test theory and item response theory and their applications to test development.
Educational Measurement: Issues and Practice, v. 12, n.3, p. 38-47, Sep. 1993. DOI:10.1111/j.1745-3992.1993.tb00543
HAMBLETON, R.; SWAMINATHAN, H.; ROGERS, H. J. Fundamentals of item response theory. California: Sage, 1991.
LORD, F. M. Applications of item response theory to practical testing problems. Hillsdale: Lawrence Erlbaum, 1980.
LORD, F. M.; NOVICK, M. R. Statistical theories of mental test scores. Oxford: Addison-Wesley, 1968.
MURAKI, E. Information functions of the generalized partial credit model. Applied Psychological Measurement, v. 17, n. 4, p. 351-63, Dec.1993.
MURAKI, E. A generalized partial credit model. In: VAN DER LINDEN, W. J.; HAMBLETON, R. K. (Eds.). Handbook of modern item response theory. New York: Springer, 1997. p. 153-64.
MURAKI, E.; BOCK, R. IRT based test scoring and item analysis for graded
open-ended exercises and performance tasks (Version 3). Chicago: Scientiic
Software, 2002.
NYDICK, S. W.; WEISS, D. J. A hybrid simulation procedure for the development of CATs. In: 2009 GMAC® CONFERENCE ON
COMPUTERIZED ADAPTIVE TESTING, 2009, Minneapolis. Proceedings. Disponível em: <http://publicdocs.iacat.org/cat2010/cat09nydick.pdf>. Acesso em: 20 fev 2014.
STOCKING, M. L. Three practical issues form modern adaptive testing item pools. Princeton: Educational Testing Research, 1994. (ETS Research Report, 93-2). THISSEN, D.; STEINBERG, L. The taxonomy of item response models. Psychometrika, v. 51, n. 4, p. 567-77, Dec. 1988. DOI:10.1007/BF02295596
VELDKAMP, B. P.; MATTEUCCI, M. Bayesian computerized adaptive testing. Ensaio: Avaliação e Políticas Públicas em Educação, v. 21, n. 78, p. 57-82, jan./mar. 2013. DOI:10.1590/S0104-40362013005000001
Informações das autoras
Patrícia Costa: Doutora em Engenharia Industrial e de Sistemas, Universidade do
Minho, Portugal. Investigadora na Unidade de Econometria e Estatística Aplicada do Joint Research Center – European Commission. Contato: [email protected]
Maria Eugénia Ferrão: Doutora em Engenharia (área de concentração Estatística e Teoria