Social capital at work:
psychometric analysis of a short
scale in Spanish among Mexican
health workers
Capital social en el trabajo: Análisis
psicométrico de una escala breve
en español entre trabajadores de la
salud mexicanos
Alvaro J. Idrovo
IAnabel Camacho-Avila
IIJavier García-Rivas
IIArturo Juárez-García
III Centro de Investigación en Sistemas de Salud, Instituto Nacional de Salud Pública. Cuernavaca, Morelos, México.
II Unidad de Investigación y Servicios Psicológicos (UNISEP), Facultad de Psicología, Universidad Autónoma del Estado de Morelos. Cuernavaca, Morelos, México.
Solicitud de sobretiros: Alvaro J. Idrovo. Centro de Investigación en Sistemas de Salud, Instituto Nacional de Salud Pública. Avenida Universidad 655, Colonia Santa María Ahuacatitlán, CP 62100. Cuernavaca, Morelos, México. Correo electrónico: [email protected]
Abstract
Most studies on social capital and health are carried out with large home-based surveys, neglecting that many interactions among individuals occur in the workplace. The objective of this study was to explore the psychometric properties of a scale in Spanish used to measure social capital at work. The scale designed by Kouvonen et al was translated into Spanish and tested under classical test theory, item response theory, and confirmatory factorial analysis; 152 public health workers from different socio-cultural contexts participated in the survey. Internal consistency was high (Chronbach’s alpha = 0.88). Social capital at work correlated properly with two Job Content Questionnaire dimensions. A ceil-ing effect was detected and item difficulty was quantified. The confirmatory factor analysis showed the expected theoretical components of social capital: bonding, bridging and trust. The scale has acceptable psychometric properties, thus it can be used in future studies.
Resumen
La mayoría de estudios sobre capital social y salud se realizan con grandes encuestas en hogares, olvidando que muchas inter-acciones entre los individuos ocurren en el ambiente laboral. Este estudio tuvo como objetivo evaluar las propiedades psico-métricas de una escala en español para la medición del capital social en el trabajo. La escala de Kouvonen y colaboradores fue traducida al español y evaluada mediante la teoría clásica de las pruebas, la teoría de respuesta a los ítems y análisis facto-rial confirmatorio. Participaron 152 traba-jadores de la salud mexicanos de diferentes contextos socioculturales. La consistencia interna fue alta (alfa de Cronbach= 0.88). El capital social en el trabajo se correlacionó adecuadamente con dos dimensiones del Cuestionario de Contenido del Trabajo. Se detectó un efecto techo y se cuantificó la dificultad de los ítems. El análisis facto-rial confirmatorio mostró los componentes teóricamente esperados de vinculación, puente y confianza del capital social en el trabajo. La escala tuvo un aceptable com-portamiento psicométrico, por lo que podrá ser utilizada en futuros estudios.
Palabras clave: Capital social. Salud ocupa-cional. Psicometría. Epidemiología social.
Introduction
Social capital is considered an important determinant of individual and population
health1. Although there are several
defini-tions of social capital, the most commonly used in public health is Robert Putnam’s one. He uses the concept to refer to features of social organization which promote or im-prove the acquisition of skills, agreements, trust and networks that facilitate social
functioning to achieve common goals2. This
definition has allowed quantitative approxi-mations given that it can be related to indi-cators such as the level of trust, perceived reciprocity and the density of membership
to civic associations3. Other definitions such
as James Coleman and Pierre Bourdieu´s tend not to be used in epidemiology since their approaches are more extensive and dif-ficult empirical operationalization. The first defines social capital in terms of its role in the facilitation of individual or group action, while the latter emphasizes the fungible nature of social capital within the political
economy4.
Evidence from political sciences indi-cates that communities with greater cohe-sion, by having greater participation by civil society, tend to be more efficient in its operation, creative in political initiatives, more successful in the implementation of
policies, and less corrupt2. The same review
by Kawachi & Berkman also reports obser-vations from criminology that support this type of evidence, by stating that societies with higher levels of organization tend to have less crime and fewer suicides. Other studies have shown fewer behavioral prob-lems among minors and better economic and labor development in societies with
greater social capital2.
The vast majority of studies conducted in developed countries suggest that social capital is part of the causal mechanism whereby acts the income inequality on
health (“income inequality hypothesis”)5;
however, there is evidence that this does not occur in other countries with lower
America and the Caribbean, studies on the subject are still scarce and tend to repeat the same findings observed in other developed
countries8. Perhaps the most relevant
excep-tion are the contrary effects described in the studies where it seems to have a “perverse”
connotation9-11; in other words, with
harm-ful effects on health.
Most epidemiological studies on social capital have been carried out with general
population using large-scale surveys1,8. This
has disregarded that much of the interac-tions of individuals occur in working envi-ronments, which is why it is highly relevant to assess social capital at work; in these contexts, important interactions take place between peers and between leaders and subordinates, which may reflect the general
organization of society as a whole12. In
ad-dition, the notion of social capital, recently has received greater attention as a possible explanation to the disparities in health and its social gradient13.
A breakthrough in this topic was the development in Finland of a short scale to
measure social capital at work14. This scale
has the prospect of an inequality perspec-tive of the efficacy of social capital; with only eight items (table 1), it seeks to explore whether people feel respected, valued and treated with equality at work. Theoretically, the scale incorporates cognitive (items 3, 5 and 8) and structural components of social capital (items 1, 2, 4, 6 and 7), it also incor-porates the linking social capital (items 3, 4 and 5), the bridging or relational social capital (items 6 and 7) and the bonding
social capital (items 1, 2 and 8)14. The
cog-nitive component makes reference to per-ceptions of support, reciprocity, exchange and confidence, while the structural refers to the extent and intensity of the links. Another classification identifies union so-cial capital in relations among individuals of the same social group, while it includes the bridging social capital to refer to con-nections between people from different
social groups14.
These dimensions represent the core axes of social capital in the labor context,
and therefore the most representative in-dicators for its assessment, regardless of other cultural, occupational or geographical
aspects14. It is important to note that the
measurement of social capital in epidemio-logical studies tends to be one-dimensional and based on relationships of trust and
re-spect15,16, so this proposal incorporates the
key elements for an adequate measurement of social capital.
An initial assessment of the scale, based on the classical test theory, was performed with the answers given by Finnish work-ers in the public sector. The evaluation included validation of appearance by an expert; internal consistency analysis; cor-relations between items and the total score; convergence validity with procedural justice
(Moorman’s scale)17, effort-reward
imbal-ance (Siegrist’s Effort-Reward Imbalance
scale)18, and Job control (Karasek’s Job Content Questionnaire)19, and divergence
validity with anxiety traits (Trait Anxiety
Inventory)20, and the magnitude of changes
at work (single question with values of one to seven, interpreted as larger and more significant changes). The psychometric results obtained during this analysis were satisfactory14.
The few studies on social capital at work and health consistently show a positive effect, although it should be noted that they all have been in countries with significant differences in compari-son with Latin America. For example, an ecological study in Russia used the quality of relationships at work as an indicator of social capital. This allowed identifying a relationship between social capital and life
expectancy and mortality21. Other data of
the Saskatchewan working population in Canada show that those who frequently socialized with coworkers tend to have better health, compared with those who
do not socialize22; something similar was
reported by Lindström et al. with Swedish workers. They used participation in trade union meetings or study in labor circles as
indicators of social capital23.
shown that Finnish employees working in places with low social capital tend to have more health problems, in contrast with those who work in companies with high
so-cial capital24. Also in Finland, Liukkonen et
al. demonstrated that better self-reported health and less psychological distress oc-cur among workers who have a contract with job security and confidence in the
support of co-workers25. More recently,
Suzuki et al. measured social capital at work, through trust and reciprocity, in 1800 workers in 60 Japanese companies. Then, through a multi-level analysis, they explored the effect of these indicators on the individual and enterprise. It was found that only the level of corporate mistrust is associated with a greater likelihood of
individual smoking26.
All these studies used different ways to measure social capital, which is a
com-mon trait in investigations on the subject27.
However, the need for a uniform vision of the construct and its measurement remains an area of opportunity. One advantage of Kouvonen´s model and scale is the fact that it incorporates the most important dimen-sions of social capital in only a few items, and that regardless of culture they can be considered universal dimensions, which led to the use of this scale in Latin American populations. In this way, and given the need for standardized ways to measure social capital, the objective of this work was to evaluate the psychometric properties of a brief measurement scale of social capital at work. This seeks to contribute to the achievement of a standard measure that allows future studies to explore on key in-dicators of the level of social capital present in the workplace.
The psychometric testing of the scale is part of a study on work characteristics of the health services context and its impact on population health. In this context, it is as-sumed that social capital and organizational characteristics are positively associated with organizational performance, work-ers’ health, and consequently the health of
individuals who receive their services28-30.
Materials and methods
Participants in the study. The study was performed in the municipalities of Guachochi (Chihuahua), Jojutla (Morelos) and Tizimín (Yucatán), all in the Mexican Republic, which were selected to incor-porate the inherent variability between the North, Center and South of Mexico. In each of these locations, workers in the state health services or the Institute of social se-curity and social services for workers of the state were invited to participate. To collect the data, managers were first contacted to explain the study in detail. Meetings were then held with workers with the same objective, emphasizing that their participa-tion would be voluntary, anonymous, and without labor implications for those who decide to answer the questionnaire or not. Informed consent with signature from each participant was obtained. This study was approved by the Ethics Committee of the National Institute of Public Health in Mexico.
Construction of the scale in Spanish.
Based on the original scale, an initial translation into Spanish was done, and then back-translated into English to verify that the content of the original scale was
maintained31. Pilot tests were conducted
with 22 health professionals. This allowed modifying sentences to make them under-standable for individuals from the three participating regions. The original and final items in English and Spanish, respectively, are found in table 1.
and that the errors of measurement in a test
are independent of errors in other tests32.
Firstly, an exploratory factor analysis with the eight items was conducted, seek-ing to identify the latent variables not observed and the structure foundation of
the construct33; in order to do this, an
a-priori criterion was established to consider that a factor was relevant if it presented a proportional contribution exceeding 5%. Then Cronbach’s internal consistency was assessed. We explored the concurrent valid-ity through Spearman correlations among the scores obtained in the scale and the dimensions of supervisor/boss social sup-port and co-workers social supsup-port from
the job content questionnaire (JCQ)29, in its
version validated for Mexico34,35. This is one
of the few validated scales in Mexico related to the construct at issue. Analyses were done with the statistical program Stata 11 (Stata Corporation, College Station, Texas).
Given that the classical theory does not allow the comparison of a same construct scores obtained with different instruments,
and the inability to identify differences in the difficulty of items and the skill of those who respond, among other limitations, we carried out a follow-up assessment with some elements of the item response theory. With this analysis, the difficulty of each item in relation to the ability of people can evalu-ated. This facilitates the obtaining of total scores and incorporating these features on
a linear scale36. Moreover, among other
ad-vantages, it can express parameters of items and people in the same units, which allows to identify the items that an individual can resolve with greater or lesser difficulty; it facilitates proper assessment even when there is missing data, estimates the accuracy of measurement, and detects data that do
not conform to the model and outliers.From
this approach, an efficient item must follow a logistic curve in a manner that should only be properly answered by individuals who possess the skills required by the cognitive
demands intended to be measured36.
Since on a Likert scale, as the one evalu-ated here, a total score of the construct is
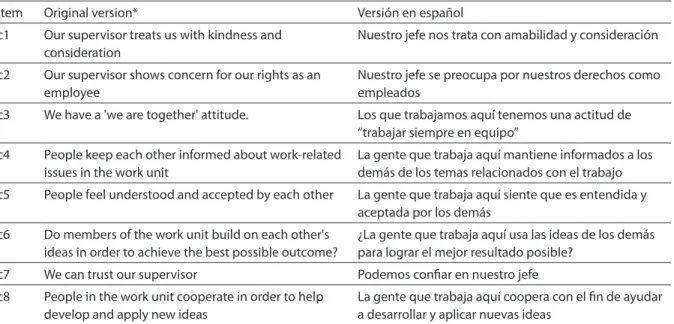
Table 1 – Items of the original social capital scale in English and the assessed version in Spanish.
Tabla 1 – Ítems de la escala de capital social en el trabajo original, en inglés, y de la versión evaluada en español.
Item Original version* Versión en español
c1 Our supervisor treats us with kindness and consideration
Nuestro jefe nos trata con amabilidad y consideración
c2 Our supervisor shows concern for our rights as an employee
Nuestro jefe se preocupa por nuestros derechos como empleados
c3 We have a 'we are together' attitude. Los que trabajamos aquí tenemos una actitud de
“trabajar siempre en equipo”
c4 People keep each other informed about work-related
issues in the work unit
La gente que trabaja aquí mantiene informados a los demás de los temas relacionados con el trabajo
c5 People feel understood and accepted by each other La gente que trabaja aquí siente que es entendida y aceptada por los demás
c6 Do members of the work unit build on each other's ideas in order to achieve the best possible outcome?
¿La gente que trabaja aquí usa las ideas de los demás para lograr el mejor resultado posible?
c7 We can trust our supervisor Podemos coniar en nuestro jefe
c8 People in the work unit cooperate in order to help develop and apply new ideas
La gente que trabaja aquí coopera con el in de ayudar a desarrollar y aplicar nuevas ideas
* Tomado de Kouvonen et al, 200612. Los primeros siete ítems están construidos como escala Likert donde 1 = desacuerdo total (fully disagree), indicando
bajo nivel de capital social, y 5 = completo acuerdo (fully agree); indicando alto nivel de capital social. El último ítem tuvo como opciones de respuesta 1= muy poco (very little) y 5 = mucho (very much), teniendo la misma interpretación de los anteriores.
* From Kouvonen et al, 200612. The first seven items are on a Likert scale in which 1 = fully disagree, indicating low level of social capital, and 5 = fully agree, indicating
obtained by the sum of the scores obtained in each item, an initial exploration was car-ried out with data from all workers using the
Partial Credit Model37. Under this model,
the distances between the categories within the items are not assumed as uniform. Data adjustment with the model was then esti-mated with statistics of internal and exter-nal adjustment of workers and items, thus identifying outliers that did not conform to the model. The quality of the instrument was determined with criteria suggested by
Fisher38. Curve characteristics of each of the
items were estimated. This allows looking at the relationship between the candidates’ level of skills and the probability of correct answer to each item. All these analyses were
undertaken with Winsteps ®39.
Lastly, taking into consideration the in-formation obtained in the previous analyses and conceptual foundations of Kouvonen et al.’s scale, confirmatory factorial analyses were done. This technique has shown its value to validate new questionnaires and adaptations of questionnaires developed in other languages or implemented in
popu-lations with different cultures40. The first
model was made for the single factor model (model 1) according to what was obtained in the exploratory analysis; model 2 ex-plored two factors (structural and cognitive components of social capital) following the theoretical concepts referred by Kouvonen
et al14. Finally, a three factor model was
assessed (linking, bridging and bonding components of social capital). Schumacker
& Lomax and Hair et al.’sindexes and
recom-mended values were used for the evaluation
of adjustment41,42.These analyses were done
with use of the AMOS 4.01 program43.
Results
Information was obtained from 152 health workers, most of them were women (62.8%), with ages between 16 and 60 years (median = 34). The main activities of the par-ticipants were nursing (38.16%), administra-tive (28.95%) and medicine (15.79%). Scores according to their occupation can be seen
in Figure 1, where the similarity of scores is noticeable, however, with a tendency to be higher among doctors. During factor analysis it was noted that a single factor,
with eigenvalue of 3.94, explained 94.13%
of the variance. After a varimax rotation,
it wasobserved that factor loading greater
than 0.65 were those for items c3, c4, c5 and c7. After calculating the Kaiser-Meyer-Olkin measures of sampling adequacy, values exceeding 0.80 were obtained for each item and in overall, except for item c2 (0.78),
which can be considered as “appropriate”44.
A Cronbach’s alpha of 0.88 showed that all items have the same direction and a high internal consistency.
Table 2 shows Spearman correlations with their respective 95% confidence inter-vals between scores on the scale and dimen-sions of the JCQ. Social capital at work posi-tively correlated with the two dimensions of the JCQ that evaluate the level of support
provided by the boss (rho 0.66, p <0.01) and
co-workers (rho 0.54, p <0.01). The other
dimensions showed several positive cor-relations, as expected theoretically, but not with the same magnitude. These findings suggest that there is a single construct that can be called social capital at work, with an acceptable concurrent validity.
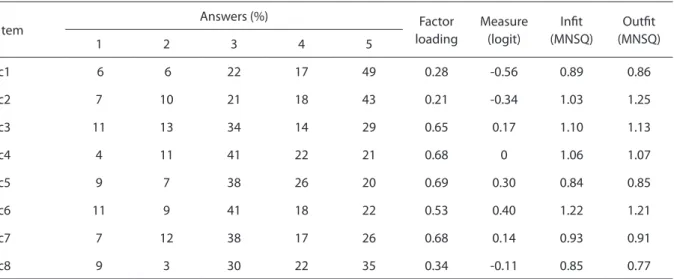
Item difficulty was quantified by means of logit, obtained by multiplying the re-sponse odds ratios to each item of the natural log. Thus it was observed that the easiest item was c1 (- 0.51); followed in increasing order by items c2 (- 0.32), c8 (- 0.11), c4 (- 0.02), c7 (0.11), c3 (0.19), c5 (0.28), and c6 (0.37). This is summarized in table 3. In the Wright map, it was evident that workers have a much greater dispersion in skill to respond, in comparison with the items (figure not shown). The three easiest items were those part of the trust relation-ships component. In the same table, it can be seen that the internal (infit) and external (outfit) adjustment statistics show values between 0.8 and 1.3, which is evidence of an appropriate adjustment.
models, using confirmatory factor analysis. The indexes were satisfactory in the three-factor model (Figure 2), except for the
evalu-ation using the x 2 test, which could have
been due to sample size45.
Discussion
This study presents the results of sev-eral psychometric analyses on the Spanish version of Kouvonen et al.’s social capital
Figure 1 – Levels of social capital observed in the diferent participating occupational groups of the study.
Figura 1 – Niveles de capital social observados en los diferentes grupos ocupacionales participantes en el estudio.
Table 2 – Spearman coorelations and 95% conidence intervals between social capital at work scale and the social support dimensions (supervisor and coworkers) of the Job Content Questionnaire (JCQ).
Tabla 2 – Correlaciones de Spearman e intervalos de conianza de 95% entre la escala de capital social en el trabajo y las dimensiones de apoyo social del jefe y apoyo social de los compañeros del Cuestionario de Contenido del Trabajo (JCQ).
Social capital at work
Questionnaire content of work (JCQ)
1 2 3 4 5 6
1. Supervisor social support
0.66 (0.56 – 0.74)
1
2 Co-worker social support
0.54 (0.39 – 0.63)
0.37 (0.17 – 0.47)
1
3 Skill discretion 0.25
(0.11 – 0.41)
0.32 (0.18 – 0.47)
0.16 (-0.01 – 0.31)
1
4. Decision-making authority
0.38 (0.20 – 0.49)
0.36 (0.23 – 0.51)
0.26 (0.07 – 0.38)
0.53 (0.39 – 0.63)
1
5. Psychological demands
-0.08 (-0.21 – 0.12)
-0.16 (-0.30 – 0.02)
-0.07 (-0.22 – 0.10)
-0.07 (-0.22 – 0.11)
-0.13 (-0.29 – 0.03)
1
6. Job control 0.38
(0.21 – 0.50)
0.39 (0.24 – 0.52)
0.25 (0.06 – 0.37)
0.78 (0.70 – 0.83)
0.93 (0.91 – 0.95)
-0.11 (-0.27 – 0.06)
at work scale. The findings showed a good performance of the scale in terms of classi-cal theory. While globally acceptable perfor-mance was observed from the item response theory, it also allowed identifying some weaknesses in the scale. A ceiling-effect was evident in 8.55% of the participants, which exceeds the expected (a maximum of 5% to
be “acceptable”)38, and this thus suggests
the need to have items that explore higher levels of social capital at work and/or that workers responses were biased.
A differential in the difficulty of items was also established, those related to trust (c1 and c2) being the easiest. While possible complementary items should seek the in-corporation of cognitive, structural, linking, bridging and bonding, it is suggested that these latter ones are prioritized in terms of the construction of items of greater dif-ficulty. This should be explored in greater depth as most of the epidemiological stud-ies on social capital use measures based on this type of indicators. If this is repeated in other types of populations, it may be that the attempts to measure social capital have only partially explored its effects. Model 3 shows the presence of dimensions of link-ing, bridging and bonding of social capital with use of confirmatory factor analysis.
Some methodological issues must be considered to adequately interpret the validity of the results. The sample size can be considered small, however, this turns out to be sufficient for the Rasch analysis, where it is well known that even in samples with less than 150 individuals have more than 99% probability that the estimated value of the difficulty of the item is not
further than ± 1 logit of its stable value46-49;
something similar happens in the case of factor analysis, where good estimates can be obtained when high commonalities are
present50, as seen in this study. In the case of
confirmatory factor analysis, it is important to remember that only the Tucker-Lewis
index is independent of sample size51, and
good a index was obtained in this analysis. While acknowledging that a larger sample would have allowed a more detailed as-sessment, all the findings suggest that the sample size was sufficient to have a global scale psychometric assessment.
The results of this study support the conclusion that we can rely on a short Spanish scale which includes the compo-nents of linking, bridging and bonding, with acceptable psychometric properties to measure social capital at work in contexts where expected levels are not too high, or
Table 3 – Distribution of answers obtained for each ítem, factorial loads and indicators of adjustment of the social capital at work scale to the Rasch model (n = 152).
Tabla 3 – Distribución de las respuestas obtenidas para cada uno de los ítems, cargas factoriales e indicadores de ajuste al modelo Rasch de la escala de capital social en el trabajo (n = 152).
Item
Answers (%) Factor
loading
Measure (logit)
Init (MNSQ)
Outit (MNSQ)
1 2 3 4 5
c1 6 6 22 17 49 0.28 -0.56 0.89 0.86
c2 7 10 21 18 43 0.21 -0.34 1.03 1.25
c3 11 13 34 14 29 0.65 0.17 1.10 1.13
c4 4 11 41 22 21 0.68 0 1.06 1.07
c5 9 7 38 26 20 0.69 0.30 0.84 0.85
c6 11 9 41 18 22 0.53 0.40 1.22 1.21
c7 7 12 38 17 26 0.68 0.14 0.93 0.91
when aggregate indicators of a group are intended, for example through medians, means or standard deviations. For social epidemiology, organizational psychology, and occupational health, it is an important step to have an efficient and consistent measurement method based solidly on the theory. This was evaluated using elements of classical theory, confirmatory factor analy-sis and Rasch method. The cross-cultural
adaptation of this scale integrated elements of three complementary approaches that allow greater validity of the results of the analysis of the differential functioning of items40.
In conclusion, this scale may be used in future studies with similar populations to the ones studied here taking into account the aforementioned constraints. Experience in this study allows us to point out that when
Figure 2 – Conirmatory factor analysis with three components of social capital at work.
Figura 2 – Análisis factorial conirmatorio con tres componentes del capital social en el trabajo. Table 4 – Comparison of it indexes in the diferent models assessed by conirmatory factor analysis.
Tabla 4 – Cuadro comparativo de índices de ajuste en los diferentes modelos evaluados mediante análisis factorial conirmatorio.
Indices Model 1 (single factor) Model 2 (two factors) Model 3 (three factors)
Valu p, x2 0.000 Not estimable 0.030
GFI 0.788 0.789 0.959
AGFI 0.618 0.600 0.908
NFI 0.780 0.788 0.953
RFI 0.692 0.687 0.923
IFI 0.806 0.812 0.980
TLI 0.724 0.719 0.966
CFI 0.803 0.809 0.979
RMSEA 0.198 0.201 0.070
there is a need to use an already-built-scale in a different population or population, it is insufficient to rely on classical test theory. It is advisable, and of low cost and simplic-ity, to make a more detailed explorations of the psychometric properties by incor-porating elements of other psychometric approaches. The incorporation of the Rasch model and confirmatory factor analysis for the psychometric assessment of complex constructs in public health should become a regular practice, which will result in im-proving the validity of its findings. Having a scale to measure social capital at work,
with acceptable psychometric results, will allow research in Spanish-speaking coun-tries on the subject to have greater validity of its findings.
Acknowledgements
The authors wish to thank the directors of institutions and health workers that par-ticipated in the study. This study was spon-sored by the National Council of Science and Technology - Conacyt, through Grant No. 87719 2008.
References
1. Pattussi MP, Moysés SJ, Junges JR, Sheiham A. Capital social e a agenda de pesquisa em epidemiologia. Cad Saúde Pública 2006; 22(8): 1525-46.
2. Kawachi I, Berkman L. Social cohesion, social capital, and health. En: Berkman L, Kawachi I (editores). Social epidemiology. New York: Oxford University Press; 2000: 174-190.
3. Putnam R. Making democracy work: civic traditions in modern Italy. Princeton, NJ: Princeton University Press; 1993.
4. Portes A. Social capital: its origins and applications in modern sociology. Annu Rev Sociol 1998; 24:1-24.
5. Gold R, Kennedy B, Connell F, Kawachi I. Teen births, income inequality, and social capital: developing an understanding of the causal pathway. Health Place 2002; 8(2): 77-83.
6. Coburn D. Beyond the income inequality hypothesis: class, neo-liberalism, and health inequalities. Soc Sci Med 2004; 58(1): 41-56.
7. Idrovo AJ, Ruiz-Rodríguez M, Manzano-Patiño A. Beyond the income inequality hypothesis and human health: a worldwide exploration. Rev Saúde Pública 2010; 44(4): 695-702.
8. Kripper CE, Sapag JC. Capital social y salud en América Latina y el Caribe: una revisión sistemática. Rev Panam Salud Publica 2009; 25(2): 162-70.
9. Rubio M. Perverse social capital--some evidence from Colombia. J Econ Iss 1997; 31(3): 805-16.
10. Idrovo AJ. Capital social, muertes violentas y mortalidad por cáncer en Colombia: una aproximación poblacional. Rev Salud Pública (Bogotá) 2006; 8(1): 38-51.
11. Hurtado D, Kawachi I, Sudarsky J. Social capital and self-rated health in Colombia: The good, the bad and the ugly. Soc Sci Med 2011;72(4):584-590.
12. Fernandez RM, Castilla EJ, Moore P. Social capital at work: networks and employment at a phone center. Am J Sociol 2000; 105(5): 1288-356.
13. Oksanen, T. Workplace social capital and employee health. Turku, Finland: University of Turku; 2009.
14. Kouvonen A, Kivimäki M, Vahtera J, Oksanen T, Elovainio M, Cox T, et al. Psychometric evaluation of a short measure of social capital at work. BMC Public Health 2006; 6: 251.
15. Moore S, Haines V, Hawe P, Shiell A. Lost in translation: a genealogy of the “social capital” concept in public health. J Epidemiol Community Health 2006; 60(8):729-34.
17. Moorman RH. Relationship between organizational justice and organizational citizenship behaviors: Do fairness perceptions influence employee citizenship? J Appl Psychol 1991; 76(6): 845-55.
18. Siegrist J, Starke D, Chandola T, Godin I, Marmot M, Niedhammer I, Peter R. The measurement of effort-reward imbalance at work: European comparisons. Soc Sci Med 2004; 58(8): 1483-99.
19. Karasek RA, Brisson C, Kawakami N, Houtman I, Bongers P, Amick B. The job content questionnaire (JCQ): an instrument for internationally comparative assessments of psychological job characteristics. J Occup Health Psychol 1998; 3(4): 322-55.
20. Spielberger CD, Gorsuch RL, Lushene R, Vagg PR, Jacobs GA. Manual for the State-Trait Anxiety Inventory (form Y) Palo Alto, CA: Consulting Psychologists Press Inc; 1983.
21. Kennedy BP, Kawachi I, Brainerd E. The role of social capital in the Russian mortality crisis. World Development 1998; 26(11): 2029-43.
22. Veenstra G. Social capital, SES and health: an individual-level analysis. Soc Sci Med 2000; 50(5): 619-29.
23. Lindström M, The Malmö Shoulder-Neck Study Group. Psychosocial work conditions, social participation and social capital: A causal pathway investigated in a longitudinal study. Soc Sci Med 2006; 62(2): 280-91.
24. Oksanen T, Kouvonen A, Kivimäki M, Pentti J, Virtanen M, Linna A, et al. Social capital at work as a predictor of employee health: Multilevel evidence from work units in Finland. Soc Sci Med 2008; 66(3): 637-49.
25. Liukkonen V, Virtanen P, Kivimäki M, Pentti J, Vahtera J. Social capital in working life and the health of employees. Soc Sci Med 2004; 59(12): 2447-58.
26. Suzuki E, Fujiwara T, Takao S, Subramanian SV, Yamamoto E, Kawachi I. Multi-level, cross-sectional study of workplace social capital and smoking among Japanese employees. BMC Public Health 2010; 10: 489.
27. Narayan D, Cassidy MF. A dimensional approach to measuring social capital: development and validation of a social capital inventory. Curr Sociol 2001; 49(2): 59-105.
28. Davies H. Falling public trust in health services: implications for accountability. J Health Serv Res Pol 1999; 4(4):193-4.
29. Koeck C. Time for organisational development in healthcare organisations. Br Med J 1998; 317(7168):1267-8.
30. Moss F, Garside P, Dawson S. Organisational change: the key to quality improvement. Qual Health Care 1998; 7(suppl): s1-2.
31. Brislin R. Back-translation for cross-cultural research. J Cross Cult Psychol 1970; 1(3):185-216.
32. Muñiz J. Classical test models. En: Everitt BS, Howell DC (eds.). Encyclopedia of statistics in behavioral science Vol. 1. Chichester: John Wiley and Sons; 2005: 278-82.
33. Widaman KF. Common factor analysis versus principal component analysis: Differential bias in representing model parameters? Multiv Behav Res 1993; 28(3): 263-311.
34. Cedillo L. Estudio de los factores psicosociales laborales entre trabajadoras de la industria maquiladora de exportación en Sonora México. En: Juárez-García A, Ramírez JA (editores). Estrés Psicosocial del trabajo: dónde y quiénes estamos en México. Compartiendo experiencias con investigadores norteamericanos. México: FES Iztacala UNAM; 2005.
35. Juárez-García A. Factores psicosociales y personalidad en relación a la salud laboral: desarrollo de un modelo (Tesis). México: Facultad de Psicología UNAM, 2005.
36. Bond TG, Fox CM. Applying the Rasch model: Fundamental measurement in the human sciences. Mahwah, NJ, LEA; 2001.
37. Masters GN. A Rasch model for partial credit scoring. Psychometrika 1982; 47(2): 149-74.
38. Fisher WP. Rating scale instrument quality criteria. Rasch Measure Transac 2007; 21:1095.
39. Linacre JM. WINSTEPS® Rasch measurement computer program. Beaverton, Oregon: Winsteps.com; 2009.
40. Tomás-Marco I, González-Romá V, Gómez Benito J. Teoría de respuesta al ítem y análisis factorial confirmatorio: dos métodos para analizar la equivalencia psicométrica en la traducción de cuestionarios. Psicothema 2000; 12(Supl. 2): 540-4.
41. Schumacker RE, Lomax RG. A beginner´s guide to structural equation modeling. New York: Psychology Press; 2004.
42. Hair JF, Anderson RE, Tatham RL, Black WC. Análisis multivariante. Madrid, España: Prentice Hall; 1999.
43. Arbuckle JL. AMOS (Version 4.01) Chicago: SmallWaters Corp; 1994.
44. Kaiser HF. An index of factor simplicity. Psychometrika 1974; 39(1): 31-6.
45. Kenny DA, McCoach DB. Effect of the number of variables on measures of fit in structural equation modeling. Struct Equat Model 2003; 10(3): 333-51.
46. Linacre JM. Sample size and item calibration stability. Rasch Measure Transac 1994; 7(4): 328.
47. Wright BD, Tennant A. Sample size again. Rasch Measure Transac 1996; 9(4): 468.
49. Smith AB, Rush R, Fallowfield LJ, Velikova G, Sharpe M. Rasch fit statistics and sample size considerations for polytomous data. BMC Med Res Methodol 2008; 8: 33.
50. McCallun RC, Widaman KF, Preacher KJ, Hong S. Sample size in factor analysis: The role of model error. Multiv Behav Res 2001; 36(4): 611-37.
51. Marsh HW, Balla JR, McDonald RP. Goodness-of-fit indexes in confirmatory factor analysis: the effect of sample size. Psychol Bull 1988; 103(3): 391-410.