Abstract
Brazilian basic education still lacks qualiied teachers. The Brazilian Open University System (UAB) is a branch of a public educational policy designed to address that problem. This quantitative/descriptive paper analyses UAB System statistics (2006 to June 2015), speciically regarding vacancies, enrolment and the number of students that graduate. It was revealed that 68.3% of all vacancies were allocated to teacher education courses, and within that sphere 67.5% were degree courses for basic education teachers and 32.4%, complementary courses. The enrolment percentage was around 86%, while the proportion of students graduating was around 61%. Analysis of the igures suggests that the UAB sought to achieve its main goal, as a public policy that induces teacher education for Brazilian basic education teaching staf. However, it is conjectured that problems related to the teaching profession itself discourage students from joining and from inalizing their courses, thereby weakening the potential performance of the UAB System.
Keywords: Education policy. Teacher education. Brazilian Open University System (UAB).
1 Introduction: A Renewed Problem
An increasing body of research reveals how unattractive the teaching profession is in Brazil largely due to low prestige, poor pay, the gap between qualiication and reality, violence in schools and a multitude of other factors (BARRETTO, 2015; GATTI, 2014). Research has also questioned why high enrolment levels in teaching degree courses persist alongside a shortage of teachers in schools, especially for certain teaching subjects and in certain regions: could it be that there are “too few teachers and too many with teaching degrees?” (PALAZZO; GOMES, 2017). Two refrains have been historically reiterated: devaluation of educators and lack of them.
a Universidade Católica de Brasília, Brasília, DF, Brasil.
Recebido em 10 abr. 2017 Aprovado em 13 jun. 2017
Teacher education: is it beating its
head on a brick wall?
An intelligent decision was made in 2006 to stimulate the qualiication of teachers for basic education by means of the Brazilian Open University System (UAB is the Portuguese acronym) under the administration of the Coordination for the Improvement of Higher Education Personnel (Coordenação de Aperfeiçoamento de Pessoal de Nível Superior - Capes). The underlying logic is consistent: distance education is lexible, low cost compared to physical attendance courses, public and free of charge to the students, has a notorious capillarity, can reach out to distant places and allows for the use of high quality teaching materials and staf.
Has a program with such a broad outreach as the UAB efectively met those needs? Has the money (correctly) invested been transformed into tangible contributions? This paper sets out to delineate the answers to those questions by analyzing the data from UAB. It touches on an assessment that transcends that ambit, however, and it is worthwhile keeping up the suspense as to whether we are still producing too many graduates with teaching qualiications but not enough teachers. Even the best objectives and strategies and the richest arrays of talents can encounter serious obstacles when they are incarnated in reality or try to become.
1.1
Justiication
According to the 2000 School Census data analyzed by Neder (2006), at the end of the last century, 48.8% of teachers working in Basic Education did not have a suitable higher education qualiication with a strong concentration of them (42.8%) in primary and lower secondary education; at the beginning of the present century the number of lay teachers in Brazil (those without initial or complementary teacher education suitable for their activities) was over 1.1 million.
Recent research has identiied a reduction in the deicit of teachers duly qualiied to work in basic education but the situation is still disquieting. According to Alves and Silva (2013) analyses of the 2009 School Census data show that 35.4% of teachers did not have a suitable qualiication. The Census for 2016 shows a deicit of 22.5% for a total of 2.19 million teaching posts (INEP, 2017).
The problem continues to be on the government agenda, so much so that the most recent National Education Plan 2014 – 2024, when setting out a macro-script for action in the educational context on the theme of “adequate education for basic education teachers”, dedicates two goals, 15 and 16 respectively, to initial teacher education and continuing teacher education.
careers, especially those associated to a teaching degree due to the “low value of the respective diploma in the economic goods and symbolic goods markets”. When people actively select teaching, they do so because of aspects that are intrinsic to the career, such as personal gratiication in being a teacher; on the other hand, they reject the career for extrinsic reasons, such as the low social value that is attributed to it (PALAZZO; GOMES, 2017). Teaching careers are not supported by adequate career plans that contemplate professional ascension, or by decent salaries or other beneits such as health plans (BARRETTO, 2015; GATTI, 2014).
The socioeconomic proiles of people that enroll in teaching degree courses ampliies the problem of teacher education. According to Gatti (2014) the proile of the student body consists of individuals: a) from low-income families, 39% with household incomes of up to 3 minimum salaries and 51% with from 3 to 10; b) 98%, not only study but work as well; c) their parents have low schooling levels, and d) 54% are outside the ideal age group for teacher education (18 to 24).
Students with the above profile have entered the course for economic or employability reasons. Courses in the ield of education are less expensive for the student and the mere fact of obtaining a higher education diploma can guarantee them employment in activities other than teaching (‘credentialism’) or the teaching activity may be practiced merely to bring in a little additional income, a kind of side line (PALAZZO; GOMES, 2017).
Finally, teachers are needed, not only to increase the body of persons in teaching and teaching-related activities but also to ill the posts that will become vacant in the coming years. According to the Basic Education Census of 2016, 49.4% of teaching positions are occupied by people over 40 years old and that fact is exacerbated by the predominant participation of women (82%), given that women have the right to an earlier retirement from their teaching activities.
2 Brazil’s Open University System (UAB)
access to higher education but should embrace teacher education as well, making full use of that modality’s potential.
In its National Education Plan 2001–2011 (Law 10.172/2001) and more speciically in Chapter 6 – Distance Education and Educational Technologies, the Brazilian State, pressured by the need to elaborate public policies to solve the qualiication problem, underscored the importance of distance education as a priority means for achieving the continuing education of teachers working in primary and lower secondary education (BRAZIL, 2001).
Furthermore, in 2005, in the Ministry of Education (MEC), the Open University System began to be idealized. The Decree nº 5.800/2006, which legitimized the UAB System, declares that it should set priority on initial and continuing education for basic education teachers (BRAZIL, 2006).
Since 2008, the UAB has been the responsibility of Capes and speciically, of the Distance Education Directorate (DED). The operational foundation of the UAB rests on a cooperation between Capes, participating public universities, States and Municipalities. These last two are responsible for maintaining locations of attendance in the form of spaces in buildings and administrative support personnel.
The DED is responsible for the macro-management of UAB: 1) approving the participation of the centers supporting student attendance and monitoring their infrastructure and the way they function; 2) monitoring the demand in the states for teacher education, making the course ofer feasible and accompanying it; 3) making the inancing of the universities feasible and accompanying the execution of the allocated resources. The role of the public universities is to propose the course ofers, administer the student selection process, promote the academic activities of the courses, and manage the execution of the inancial resources.
The data were obtained from the UAB System in July 2015 concerning the courses ofered by the participating institutions in the period from February 2006 to June 2015. The data regarding the date courses began are merely declaratory and inserted into the computational tool used to manage the UAB by the educational institutions themselves and, up until then, there had been no way of validating them.
3 Results
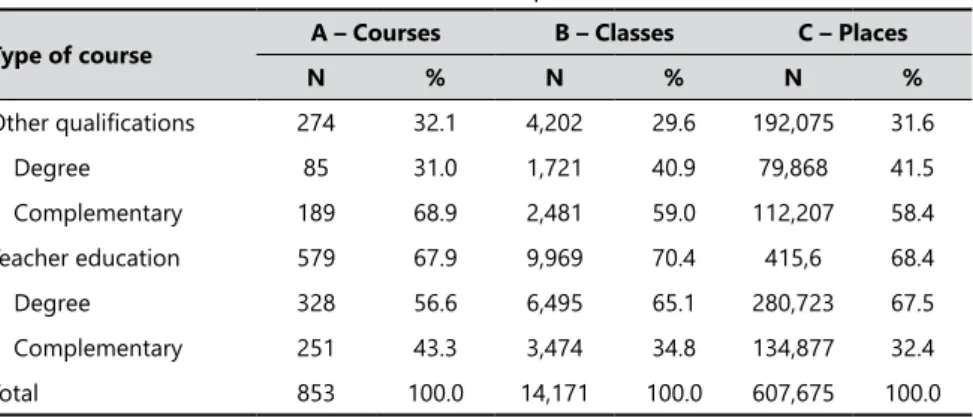
in three columns, the percentages associated to teacher education are considerably higher than those associated to “Other Qualiications”: A – 67.8%, B – 70.3% e C – 68.3%, in relation, respectively, to A – 32.1%, B - 29.6 %, e C – 31.6%; in the group “Other Qualiications”, for every degree course there are 2.2 complementary ones and in the case of classes and places the ratio is 1.4. A comparison of those numbers with the numbers associated to the group “Teacher Education” shows a diametrical behavior. In this case for each complementary course there that ratio is 1.3 degree courses and for the classes and places the numbers are 1.8 and 2, respectively.
Comparisons among different kinds of qualification show that for each bachelor/technological course there were 3.8 times more teaching degree courses and the numbers for classes and places are 3.7 and 3.5, respectively. Applying the same treatment to the Complementary courses, we found less expressive numbers but they ratify the inducement to more teacher education: 1.3 times more courses, 1.4 times more classes and 1.2 times more places.
Table 2 has been designed to permit a horizontal comparison of the numbers set out in Table 1, to present the aggregate igures for the number of classes for each course and the same logic for classes and places.
Based on the totals (highly aggregated numbers), each UAB course contemplated 16.6 classes with 42.8 students per class. These numbers grouped according to type of qualiication and purpose, are very similar. Thus, we can conjecture as to whether the UAB System’s complementary and degree courses, irrespective of whether they are directed at teacher education or not, support similar numbers of classes and student places and whether their potentials are equivalent.
Table 1. Total numbers of courses, classes and places found in the UAB.
Type of course A – Courses B – Classes C – Places
N % N % N %
Other qualiications 274 32.1 4,202 29.6 192,075 31.6
Degree 85 31.0 1,721 40.9 79,868 41.5
Complementary 189 68.9 2,481 59.0 112,207 58.4
Teacher education 579 67.9 9,969 70.4 415,6 68.4
Degree 328 56.6 6,495 65.1 280,723 67.5
Complementary 251 43.3 3,474 34.8 134,877 32.4
Total 853 100.0 14,171 100.0 607,675 100.0
The comparisons commented in the preceding paragraphs have revealed two inducement tendencies. The UAB has functioned in educating new teachers and, albeit residually, in qualifying teachers already in activity in new areas of knowledge; in the aspect of other qualiications it focused on aggregating complementary knowledge. In other words, the UAB has sought to induce the education of teachers thereby fulilling its primordial objective.
Considering these observations, can the percentage relations in Table 1 be considered ideal? Could they be improved? Supposing that the courses have similar qualifying potential, if the UAB were to redirect the institutional eforts, it would dedicate to Other Qualiications to teacher education instead, could the achievement of the primordial objective be expanded? We do not have the answers for now, but such questions suggest further studies.
Scrutiny of the data showed that only 3 courses were registered as having been cancelled. Apart from the numbers being statistically insigniicant, the current inactivity of those courses does not mean they were not active at some time or another. Oppositely, 1,588 classes (11.2% of the total) were cancelled or never actually started. The failure to start of the activities of a class in any given attendance support center triggers efects on the number of places whose reduction implies there will also be reductions in enrolment and undergraduate igures.
Table 3 presents a diferent level of des-aggregation according to the number of places available or occupied, by regions where the classes were organized.
Table 2. Ratios of numbers of courses, classes and places.
Type of course B/A C/B
N N
Other qualiications 15.3 45.7
Degree 20.2 46.4
Complementary 13.1 45.2
Teacher education 17.2 41.6
Degree 19.8 43.2
Complementary 13.8 38.8
Total 16.6 42.8
A: courses; B: classes; C: places.
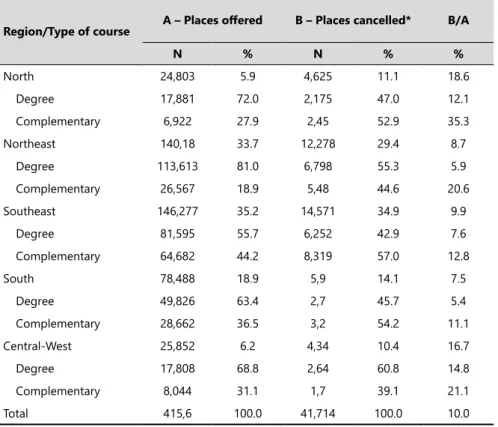
A vertical analysis of column A shows that the installed capacity of the place ofer is consistent with what has already been observed, namely, that the system has favored teaching degrees to the detriment of complementary courses. In the Southeast macro region, the numbers are closer to one another which may indicate that the demand for new teachers is lower than in other regions. In macro regions North and Northeast, however, the place ofer for teaching degree courses is expressive, which suggests a possibly serious shortage of new teachers. Although we cannot distinctly airm causality, these last two regions present the lowest mean values (according to recent surveys) for the Basic Education Development Index (Índice de Desenvolvimento da Educação - IDEB). Northeast and Southeast account for 69.5% and 67.6% of the places, respectively (total of degree courses and complementary courses). Those igures are inluenced by the numbers of universities located in the two regions. Together they account for 63% of the total number of institutions participating in the UAB.
Table 3. Patterns of the UAB place ofer by regions.
Region/Type of course A – Places ofered B – Places cancelled* B/A
N % N % %
North 24,803 5.9 4,625 11.1 18.6
Degree 17,881 72.0 2,175 47.0 12.1
Complementary 6,922 27.9 2,45 52.9 35.3
Northeast 140,18 33.7 12,278 29.4 8.7
Degree 113,613 81.0 6,798 55.3 5.9
Complementary 26,567 18.9 5,48 44.6 20.6
Southeast 146,277 35.2 14,571 34.9 9.9
Degree 81,595 55.7 6,252 42.9 7.6
Complementary 64,682 44.2 8,319 57.0 12.8
South 78,488 18.9 5,9 14.1 7.5
Degree 49,826 63.4 2,7 45.7 5.4
Complementary 28,662 36.5 3,2 54.2 11.1
Central-West 25,852 6.2 4,34 10.4 16.7
Degree 17,808 68.8 2,64 60.8 14.8
Complementary 8,044 31.1 1,7 39.1 21.1
Total 415,6 100.0 41,714 100.0 10.0
*Cancelled/no-started classes.
On analyzing the composition of the total number of places (47,714) in cancelled or no started classes shown in column B, we can conclude that the numbers for degree courses (49.3%) and complementary courses (50.7%) are similar. In the light of that vertical analysis Northeast (29.4%) and Southeast (34.9%) contributed substantially to the composition of the total, albeit the proiles of their cancelled classes were diferent. Former cancelling refers predominantly complementary courses, whereas the later degree course classes were cancelled more than the others. The two regions’ high igures for this item are due to the fact that they ofered much higher numbers of places in the irst place. It should be mentioned that in the Central-Western region, most cancelled classes were of degree courses.
A complementary horizontal analysis of the same Table 3 – column B/A shows that, in principle, 10% of the places were lost. All regions cancelled places in complementary courses proportionally, 2.3 times more on average. North and Central-West presented the highest percentages of places not implemented, 18.6% and 16.7%, respectively. That fact difers from the conclusions of the horizontal analyses. In other words, those regions, with the lowest ofer, were the ones that made least eicient use of their potential occupation. They did not even get to the point of setting in motion the selection process to occupy them.
It is not exactly a case of supply and demand: the classes/places that were cancelled or not started never had a chance of being occupied. Accordingly, certain questions arise from the information in Table 3. A loss of up to 10% might be an acceptable igure, but, in fact, it represents 20,565 potential new teachers that will never come to be and 21,149 others that could have had their knowledge enhanced, but did not. Why were those classes/places cancelled or why did they fail to start? Were the quantities involved not properly dimensioned beforehand? Did the actors and processes involved fail to perform as expected? Was there any lack of resources that made it impossible to start the classes?
One of the variables for establishing funds for a new class was the number of available places, in 2006-14. Considering the context portrayed above we can conjecture that there was a considerable volume of inancial resources that went unused.
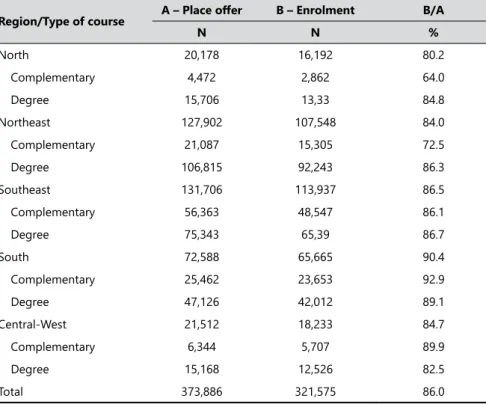
Table 4 portrays the occupation of places efectively occupied in the selection process from 2006 to June 2015.
may indicate that those two regions had a greater need of new teachers. It is worth noting that macro region North failed to implement 35.3% of the places in complementary courses, which means that 58.5% of the planned places were lost. Macro region South heads the list with the best percentages taken up, 90.46%.
The ideal of 100.0% occupation may be hard to achieve but it should be aimed at. None of the percentages detected was above 95% and the mean percentage of places efectively occupied was 83.5%. In that light, we propose the following conjectures: was the level of occupation less than excellent because of the lack of demand, in other words because there was less than one candidate per place? Or, did the selection processes approve a suicient number of candidates but some of the latter decided not to matriculate? The idea of those speculations is to evoke the phantom of the lack of attractiveness of the teaching career indicated by the studies that have been cited in the text above (BARRETTO, 2015; GATTI, 2014; PALAZZO, GOMES, 2017; PEIXOTO, 2012).
Table 4. Relationship between place ofers and enrolments, by regions and by type
of course.
Region/Type of course A – Place ofer B – Enrolment B/A
N N %
North 20,178 16,192 80.2
Complementary 4,472 2,862 64.0
Degree 15,706 13,33 84.8
Northeast 127,902 107,548 84.0
Complementary 21,087 15,305 72.5
Degree 106,815 92,243 86.3
Southeast 131,706 113,937 86.5
Complementary 56,363 48,547 86.1
Degree 75,343 65,39 86.7
South 72,588 65,665 90.4
Complementary 25,462 23,653 92.9
Degree 47,126 42,012 89.1
Central-West 21,512 18,233 84.7
Complementary 6,344 5,707 89.9
Degree 15,168 12,526 82.5
Total 373,886 321,575 86.0
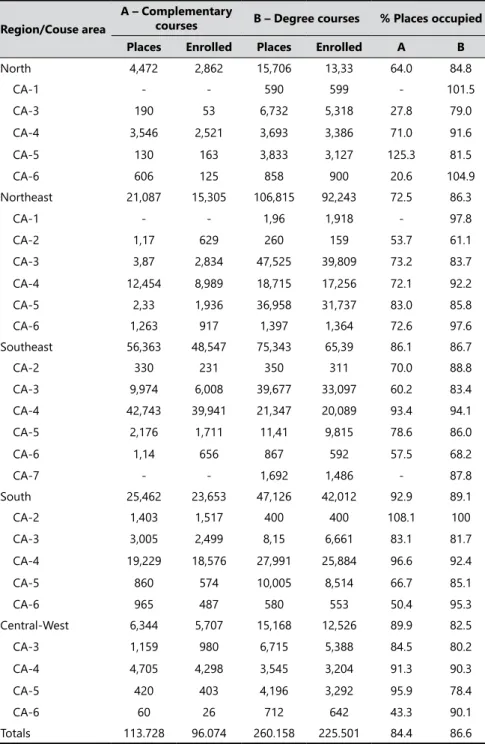
In an endeavor to make a more in-depth analysis of places’ occupation of the places ofered, the igures in Table 4 have been des-aggregated by areas of knowledge and qualiication to which the respective courses were associated using the Organisation for Economic Co-operation and Development (OECD) classiication adopted by the UAB, and they are presented accordingly in Table 5. For a best reading, we aggregated the areas in categories, Courses Areas (CA):
a) CA-1 – Agriculture and Veterinary Science;
b) CA-2 – Social Sciences, Business and Law;
c) CA-3 – Sciences, Mathematics and Computing;
d) CA-4 – Education;
e) CA-5 – Humanities and Arts;
f) CA-6 – Health and Social Wellbeing;
g) CA-7 – Services.
Vertical analysis of the Complementary Courses column reveals large allocation to Education, which accounted for 72.7% of the total number of places. The same is true for most of the regions with the lowest percentage being for the Northeast, 59%. Notably, the South and Central-Western regions respectively ofered 2 and 1.3 times more complementary courses available than teaching degree courses. Thus, we can suppose, about complementary qualiication, that the UAB channeled its eforts to ofering opportunities for educators and professionals with other qualiications to acquire and improve their knowledge in the education ield.
Table 5. Relationship between quantity of places and efective enrolment, by course areas.
Region/Couse area
A – Complementary
courses B – Degree courses % Places occupied Places Enrolled Places Enrolled A B
North 4,472 2,862 15,706 13,33 64.0 84.8
CA-1 - - 590 599 - 101.5
CA-3 190 53 6,732 5,318 27.8 79.0
CA-4 3,546 2,521 3,693 3,386 71.0 91.6
CA-5 130 163 3,833 3,127 125.3 81.5
CA-6 606 125 858 900 20.6 104.9
Northeast 21,087 15,305 106,815 92,243 72.5 86.3
CA-1 - - 1,96 1,918 - 97.8
CA-2 1,17 629 260 159 53.7 61.1
CA-3 3,87 2,834 47,525 39,809 73.2 83.7
CA-4 12,454 8,989 18,715 17,256 72.1 92.2
CA-5 2,33 1,936 36,958 31,737 83.0 85.8
CA-6 1,263 917 1,397 1,364 72.6 97.6
Southeast 56,363 48,547 75,343 65,39 86.1 86.7
CA-2 330 231 350 311 70.0 88.8
CA-3 9,974 6,008 39,677 33,097 60.2 83.4
CA-4 42,743 39,941 21,347 20,089 93.4 94.1
CA-5 2,176 1,711 11,41 9,815 78.6 86.0
CA-6 1,14 656 867 592 57.5 68.2
CA-7 - - 1,692 1,486 - 87.8
South 25,462 23,653 47,126 42,012 92.9 89.1
CA-2 1,403 1,517 400 400 108.1 100
CA-3 3,005 2,499 8,15 6,661 83.1 81.7
CA-4 19,229 18,576 27,991 25,884 96.6 92.4
CA-5 860 574 10,005 8,514 66.7 85.1
CA-6 965 487 580 553 50.4 95.3
Central-West 6,344 5,707 15,168 12,526 89.9 82.5
CA-3 1,159 980 6,715 5,388 84.5 80.2
CA-4 4,705 4,298 3,545 3,204 91.3 90.3
CA-5 420 403 4,196 3,292 95.9 78.4
CA-6 60 26 712 642 43.3 90.1
Totals 113.728 96.074 260.158 225.501 84.4 86.6
The column headed “Percentage of Places Occupied” allows to see the occupation rates. Figures above 100.0% result from some courses managed to enroll more students than the number of places originally made available. These are residual cases that call for more detailed studies.
When we analyze the rate of occupation of places in the complementary courses, we ind that regions Southeast, South and Central-West have high rates, around an average of 93.7%. For the regions North and Northeast, however, the mean rate of occupation is just 71.6%. This means that almost 30% of the initial efort was dissipated before the classes even began and that was unfortunately in the two regions with the lowest average IDEB ratings.
Focusing on the degree courses, only two regions registered occupation rates could be considered merely regular (below 70%), namely, the Northeast in the area of Social Sciences, Business and Law with 61.1% and the Southeast in the area of Health and Social Wellbeing with 68.2%. To gain an understanding of the disparities in the place occupation igures the data need to be des-aggregated even further because sporadic facts in isolated institutions or courses may very well afect the overall igures. The other rates were close to a high average igure of 89.5%, especially in the three regions that make the greatest numbers of places available, as has been shown.
Furthermore, the analysis of enrollments shows that 30.9% of them were in the Pedagogy courses. That percentage may represent progress in the number of enrollments in public courses in Pedagogy in the distance education mode identiied by Barretto (2015) based on the 2011 Higher Education Census, whereby they represented 12.2% of all the teaching degree courses being ofered by that means.
In general, places in the teaching degree classes are occupied satisfactorily despite the initial loss at the moment of implementation of the places of a potential 10% of those that could have eventually become qualiied. For an appreciation of the broader scenario, the data collected after the implementation of the places must be analyzed to verify the numbers after the classes have concluded their course and ind out how much of the original potential qualiication is eventually fulilled at the end of all the stages of this public policy.
the reality as closely as possible, the igures were based on those for classes declared as having concluded the course, so the number of matriculations in this case difers from those in the previous tables.
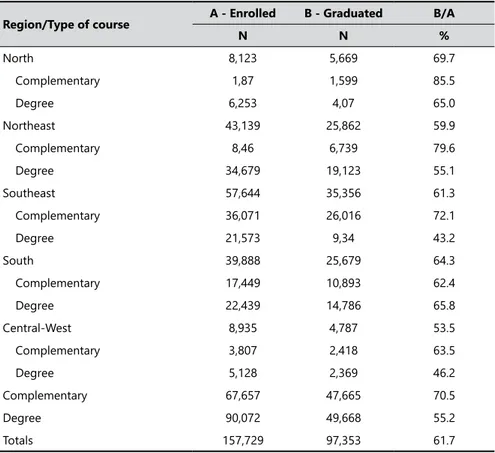
Table 6 shows that the UAB qualified 49,688 (51%) new teachers and complemented the qualiications of an additional 47,665 (48.9%) professionals. Those are considerable amounts, but as the courses unfolded a considerable number dropped out. 70.4% of those enrolled in complementary courses inished them, but in teaching degree courses only 55.1% completed all the academic activities. Thus, almost half of the efort to educate new teachers was dissipated during the process. Here again there is a convergence with the results reported by Palazzo and Gomes (2017) regarding the eicient use made of the teaching
Table 6. Ratios between numbers enrolled and numbers graduated by regions and by type of course based on concluded classes.
Region/Type of course A - Enrolled B - Graduated B/A
N N %
North 8,123 5,669 69.7
Complementary 1,87 1,599 85.5
Degree 6,253 4,07 65.0
Northeast 43,139 25,862 59.9
Complementary 8,46 6,739 79.6
Degree 34,679 19,123 55.1
Southeast 57,644 35,356 61.3
Complementary 36,071 26,016 72.1
Degree 21,573 9,34 43.2
South 39,888 25,679 64.3
Complementary 17,449 10,893 62.4
Degree 22,439 14,786 65.8
Central-West 8,935 4,787 53.5
Complementary 3,807 2,418 63.5
Degree 5,128 2,369 46.2
Complementary 67,657 47,665 70.5
Degree 90,072 49,668 55.2
Totals 157,729 97,353 61.7
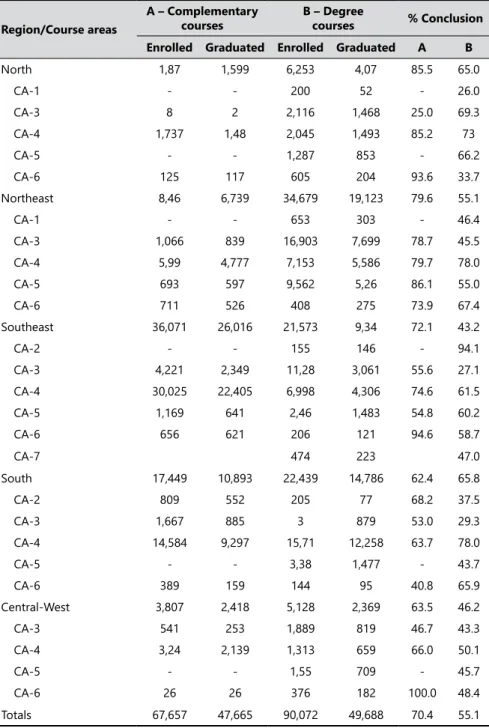
degree opportunities: students tend to leave their courses not between selection and enrollment, but during the course itself, which is the opposite of the situation of traditional teaching degree courses where the student attends all classes in person. Table 7 des-aggregates the data by areas of knowledge.
The analysis by area of qualification does not present a more encouraging scenario The course conclusion rates are modest and most negative among them are those for Sciences Mathematics and Computing where the mean percentage was 57.6% but for region North it was only 25%. The area of education shows a regular result of 72.1% and the highest absolute number of qualiied graduates, 40,098 (84.1%). The Northeast also showed a regular result for graduation rate with none of the areas being lower than 70%.
In regard to the teaching degree courses, the results discriminated by areas of knowledge repeat the pattern for the other courses. The areas of Sciences, Mathematics and Computing returned the lowest rate with an overall result of just 35.9% of enrolled students actually concluding their course. Other low percentages were for the Southeast (27.1%) and South (29.3%). The overall rate for the area of Education was higher, 73.1%, with an outstanding 78% obtained by regions Northeast and South. On the whole the area of Humanities and Arts showed fair results with an average rate of graduation of 54.2%.
The numbers displayed above reveal the existence of a serious problem. UAB System, especially in the teaching degree courses, has not managed to keep the enrolled students from dropping out of their classes as almost half of them fail to inalize their courses and there is an orverriding physics, chemistry, biology computing and geography teachers. The total enrollment numbers for Sciences, Mathematics and Computing, on the one hand, and Eduction on the other are similar 35,188 (39.8%) and 33,219 (36.8%), but their course conclusion rates are very diferent. In other words, the system is potentially educating and further qualifying students in Education more than any other area.
Table 7. Relation between enrollment igures and course conclusion in courses
declared as concluded.
Region/Course areas
A – Complementary courses
B – Degree
courses % Conclusion
Enrolled Graduated Enrolled Graduated A B
North 1,87 1,599 6,253 4,07 85.5 65.0
CA-1 - - 200 52 - 26.0
CA-3 8 2 2,116 1,468 25.0 69.3
CA-4 1,737 1,48 2,045 1,493 85.2 73
CA-5 - - 1,287 853 - 66.2
CA-6 125 117 605 204 93.6 33.7
Northeast 8,46 6,739 34,679 19,123 79.6 55.1
CA-1 - - 653 303 - 46.4
CA-3 1,066 839 16,903 7,699 78.7 45.5
CA-4 5,99 4,777 7,153 5,586 79.7 78.0
CA-5 693 597 9,562 5,26 86.1 55.0
CA-6 711 526 408 275 73.9 67.4
Southeast 36,071 26,016 21,573 9,34 72.1 43.2
CA-2 - - 155 146 - 94.1
CA-3 4,221 2,349 11,28 3,061 55.6 27.1
CA-4 30,025 22,405 6,998 4,306 74.6 61.5
CA-5 1,169 641 2,46 1,483 54.8 60.2
CA-6 656 621 206 121 94.6 58.7
CA-7 474 223 47.0
South 17,449 10,893 22,439 14,786 62.4 65.8
CA-2 809 552 205 77 68.2 37.5
CA-3 1,667 885 3 879 53.0 29.3
CA-4 14,584 9,297 15,71 12,258 63.7 78.0
CA-5 - - 3,38 1,477 - 43.7
CA-6 389 159 144 95 40.8 65.9
Central-West 3,807 2,418 5,128 2,369 63.5 46.2
CA-3 541 253 1,889 819 46.7 43.3
CA-4 3,24 2,139 1,313 659 66.0 50.1
CA-5 - - 1,55 709 - 45.7
CA-6 26 26 376 182 100.0 48.4
Totals 67,657 47,665 90,072 49,688 70.4 55.1
On the other hand, there are serious implications for the financial aspect. Lira and Lima (2014) report that in the period 2006 to 2013 the UAB received budget allocations to the tune of 2.46 billion reals. Reports published by the Coordinating Body for Supervision and Promotion (Coordenação de Supervisão e Fomento - CGFO) of Capes show that the amount made available to the UAB in 2014 was 394.67 million reals (Brazilian currency). Adding that to the amount cited by Lira and Lima (2014), we obtain the igure of 2.86 billion reals. Two aspects of those igures need to be made clear: they are nominal igures that have not been subjected to any kind of correction or adjustment, and they are based on budget data which may be diferent to the amounts that were efectively used.
In the light of all those inancial igures and the data displayed in Table 1 we can derive certain inferences, however primary they may be. We know that at least 60% of the UAB System’s efort was directed at the initial and continuing education of teachers, given that 1.71 billion reals were allocated for that purpose. If we divide that igure by the number of course places actually implemented (Table 4), we obtain the value of a single implemented course place of 4.58 thousand reals. In those classes declared as concluded, 176,980 places were made available. We also know that the number that graduated was 97,353 (Table 6) thus 79,279 places were wasted either because the student decided not to enroll or because he or she did not conclude the course. That means we identify a possible resource waste around 363.10 million reals or USD 201.7 million (OECD, 2017). If igures were available for uninished classes, the total amount could be considerably greater.
Thus it can be estimated that a large part of the UAB System’s efort to induce teacher education goes to waste during the educational process. Obviously a 100% return on the investment is unlikely, but if 80% of the actual enrollments (Table 4) were fully taken advantage of (with students graduating at the end of their courses) then by the end of 2015 we could have 180,401 new teachers available for various teaching roles and another 76,859 having acquired a set of complementary knowledge. If, as the 2016 Basic Education Census indicates, 22.5% (494,107) of those in educational functions lack a proper qualiication, the UAB would be able to reduce the problem by half in a few years. That estimate may be limited but it is designed to underscore the potential of the UAB.
4 Final Conclusion
integral attendance, the amount is highly signiicant in a program with national outreach. New questions that arise are: do the qualiied educators actually work? If so, do they work in areas that need them most? Does their education and training result in learning on the part of the students they teach?
Those are profound questions but for some time now, international experiences have shown that distance education needs to address complex internal and external conditions associated to the students’ realities. While the cost tends to be lower, drop out rates tend to be high so the latter annuls the efect of the former (GOMES, 1994). That was an aspect that Darcy Ribeiro ordered to be investigated before proposing the Law that bears his name and set distance education in motion in Brazil. Outstanding among the usual remedies applied and improved on, are acquiring good knowledge of the real and potential students, accompanying them constantly requiring their actual presence or presence at a distance in the so-called “learning communities”, quality in all spheres, including accompaniment by tutors in suitable centers. There is an obstacle that stands in the way of quality; the student needs to have a set of prior knowledge as to how to study, how to study in groups, about communication codes and technology, in addition to organizational routines and habits that are supposed to be developed by the primary school. If that school sets priority on the students acquisition of subject content alone, instead of getting the student to learn how to learn, then the student emanating from such a situation may well lack basic conditions. It is not by chance that the literature has tested and evaluated many alternatives (FIUZA; CASTELLÁ SARRIERA, 2013; HART, 2012; SIMPSON, 2012).
Formação de professores qualiicados: enxugando gelo?
ResumoA necessidade por professores para atuarem na educação básica brasileira, com a devida
qualiicação, ainda é alta. Procurando contribuir para a solução do problema, encontramos o Sistema Universidade Aberta do Brasil (UAB). Este estudo, quantitativo/descritivo,
debruçou-se sobre dados oriundos do Sistema UAB - números de cursos, vagas,
matrículas e formados, entre 2006 a junho de 2015. Veriicou-se que a maioria das
vagas disponibilizadas, 68,3%, foram direcionadas à formação de professores, destas,
especiicamente 67,5% para formação inicial e 32,4% para complementar. A taxa de matrícula orbitou os 86%, enquanto que a de formados, foi cerca de 61%. Com base nos
números foi possível concluir que o Sistema UAB procurou alcançar seu objetivo principal
como política pública indutora da formação dos professores para a educação básica. Porém, conjectura-se que problemas ligados à carreira docente desestimulem os alunos a ingressarem e inalizarem os cursos, debilitando o potencial de atuação do Sistema.
Palavras-chave: Política educacional. Formação de professores. Sistema Universidade
Aberta do Brasil.
Formación de profesores cualiicados: ¿acción inútil?
ResumenLa educación básica brasileña todavía carece de maestros calificados. El Sistema
Universitario Abierto de Brasil (UAB) es una rama de una política educativa pública
diseñada para abordar este problema. Este artículo cuantitativo / descriptivo analiza las estadísticas del Sistema UAB (2006 a junio de 2015), especíicamente en lo que respecta a vacantes, inscripción y número de alumnos que se gradúan. Se encontró que el 68,3% de
todas las vacantes se asignaron a cursos de formación de profesores, y en ese ámbito el
67,5% correspondía a titulaciones de docentes de educación básica y el 32,4% a cursos complementarios. El porcentaje de matrícula fue de alrededor del 86%, mientras que la proporción de estudiantes que se graduaron fue de alrededor del 61%. El análisis de
las cifras sugiere que el Sistema UAB buscó alcanzar su objetivo principal, como una política pública que induce la formación docente para el personal docente brasileño
de educación básica. Sin embargo, se conjetura que los problemas relacionados con la profesión docente en sí desalientan a los estudiantes de unirse y de inalizar sus cursos, debilitando así el potencial desempeño del Sistema UAB.
Palabras clave: Política educativa. Formación de profesores. Sistema Universidad Abierta
References
ALMEIDA, M. P.; COSTA, M. L. F. Políticas públicas para o ensino superior a distância e a legislação educacional vigente. In: COSTA, M. L. F. (Org.). Introdução à educação a distância. Maringá: Eduem, 2009. p. 11-22.
ALVES, T.; SILVA, R. M. Estratiicação das oportunidades educacionais o Brasil: contextos e desaios para a oferta de ensino em condições de qualidade para todos. Educação e Sociedade, v. 34, n. 124, p. 851-79, jul./set. 2013. https://doi.org/10.1590/S0101-73302013000300011
BARRETTO, E. S. S. Políticas de formação docente para a educação básica no Brasil: embates contemporâneos. Revista Brasileira de Educação, v. 20, n. 62, p. 679-701, jul./set. 2015. https://doi.org/10.1590/S1413-24782015206207 BRASIL. Decreto nº 5.800. de 8 de junho de 2006. Dispões sobre o Sistema Universidade Aberta do Brasil – UAB. Diário Oicial da União, 9 jun. 2006 ______. Lei Nº 9.394, de 20 de dezembro de1996. Estabelece as diretrizes e bases da educação nacional. Diário Oicial da União, 23 dez. 1996.
______. Lei Nº 10.172, de 09 de janeiro de 2001. Aprova o Plano Nacional de Educação e dá outras providências. Diário Oicial da União, 10 jan. 2001. FIUZA, P. J.; CASTELLÁ SARRIERA, J. Motivos para adesão e permanência discente na educação superior a distância. Psicologia: Ciência e Proissão, v. 33, n. 4, p. 884-901, 2013. https://doi.org/10.1590/S1414-98932013000400009. GATTI, B. A. Formação inicial de professores para a educação básica: pesquisas e políticas educacionais. Estudos em Avaliação Educacional, v. 25, n. 57, p. 24-54, jan./abr. 2014. https://doi.org/10.18222/eae255720142823. GOMES, C. A. Ensino superior a distância: lições de três experiências. In: Universidade do Terceiro Milênio. Plano Orientador da UENF. Campos dos Goytacazes, 1994. V. 3, p. 58-67.
_____________. A legislação que trata da EAD. In: LITTO, F. M.; FORMIGA, M. C. M. (Orgs.). Educação a distância: o estado da arte. São Paulo: Pearson Education do Brasil, 2009. p. 21-7.
INSTITUTO BRASILEIRO DE GEOGRAFIA E ESTATÍSTICA – IBGE.
Projeção da população por sexo e idade: Brasil 2000-2060. Rio de Janeiro, 2013. Available from: <http://www.ibge.gov.br/home/presidencia/noticias/imprensa/ppts /00000014425608112013563329137649.pdf >. Access: 2016 Dec. 10.
INSTITUTO NACIONAL DE ESTUDOS E PESQUISAS EDUCACIONAIS ANÍSIO TEIXEIRA – INEP. Sinopse estatística da educação básica de 2016. Brasília, DF, 2017. Available from: <http://download.inep.gov.br/ informacoes_estatisticas/sinopses_estatisticas/sinopses_educacao_basica/ sinopse_estatistica_educacao_basica_2016.zip>. Access: 2017 June 13. LIRA, L. A. R.; LIMA, B. F. Z. Desaios da gestão de políticas públicas educacionais para formação de professores no âmbito do Sistema Universidade Aberta do Brasil. Em Rede Revista de Educação a Distância, v. 1, n. 1, p. 138-151, 2014.
NEDER, M. L. C. Educação a Distância e sua contribuição na mudança de paradigmas educacionais na formação de professores. In: BRASIL. Ministério da Educação. Desaios da educação a distância na formação de professores. Brasília, DF, 2006. p. 79-85.
ORGANISATION FOR ECONOMIC CO-OPERATION AND DEVELOPMENT – OECD. Purchasing power parities (PPP). Paris, 2017. Available from: <https:// data.oecd.org/conversion/purchasing-power-parities-ppp.htm>. Access: 2017 Apr. 7. PALAZZO, J.; GOMES, C. A. Teaching career’s attraction and rejection factors: analysis of students and graduates perceptions in teacher education programs. Ensaio: Avaliação e Políticas Públicas em Educação, v. 25, n. 94, p. 90-113, jan./mar., 2017. https://doi.org/10.1590/s0104-40362017000100004.
PEIXOTO, M. C. L. Plano Nacional de Educação 2011-2020: desaios para a educação superior. In: CUNHA, C; SOUSA, J. V.; SILVA, M. A. (Orgs.). Universidade e educação básica: políticas e articulações possíveis. Brasília, DF: Liber, 2012. p. 67-91.
SIMPSON, O. Supporting students for success in online and distance education. New York: Routledge, 2012.
Author information
Bruno Teles Nunes: Doutorando do Programa de Pós-Graduação Stricto Sensu em