Before the discovery of the
pre-salt layer resources:
Greenhouse gas emissions
from the oil and gas
indus-try in Brazil
1
T
hiago
de
a
raújo
M
endes
and
s
aulo
r
odrigues
F
ilho
Introduction
a
monG the various interactions between development andenviron-ment, the climate change-energy binomial is one of the most challeng-ing issues of our time, for both science and policy. the nature of the global warming issue is different from that of any other political issue, because of either its future-oriented dimension or its scale (Giddens, 2009). accord-ing to the Intergovernmental Panel on Climate Change (IPCC, 1990, 1995, 2001a, 2007a), greenhouse gas (GhG) emissions from the use of fossil fuels is the primary anthropogenic source that contributes to global warming. solu-tions to mitigate climate change will entail both the systematic reduction of GhG emissions from the production and use of fossil fuels and the increasing use of renewable energy to generate a low-carbon economy (stern, 2006; de Gouvello, 2010).
the total energy matrix, followed by natural gas with 10.3 percent and coal with 6.2 percent (53.2 percent come from fossil fuels), while 82 percent of the global energy matrix depends on fossil fuels (Iea, 2009). according to Brazil’s sec-ond national Communication to the united nations Framework Convention on Climate Change (Brazil, 2010), in 2005 domestic GhG emissions reached about 2,192 million tons of Co2 equivalent. the land use, land use and change and forestry sector was responsible for about 61 percent of domestic Co2 emis-sions in 2005, while the energy sector accounted for about 15 percent of this total (Brazil, 2010).
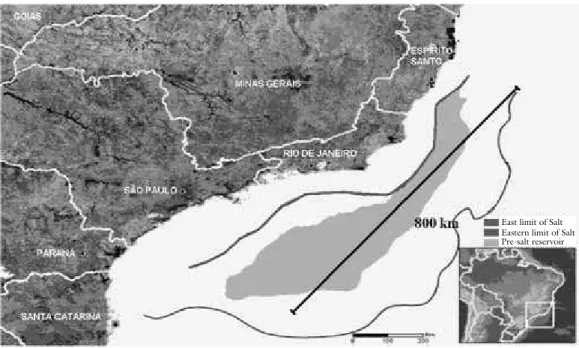
however, due to the discovery of oil fields in the pre-salt layer and recent reductions in emissions from land use change in the Brazilian amazon, the question is whether this proportion will change significantly and come, in the medium term, closer to the patterns of the economies of developed countries. Figure 1 illustrates the area where pre-salt reserves are located (in light gray). the oil province covering the pre-salt layer area is about 149,000 km2 long, stretching from the coast of espírito santo to the coast of santa Catarina, and about 800 km long and 200 km wide in some areas (Lima, 2010; azevedo, 2009; Lima, 2008). according to azevedo (2009), about 28 percent of the province area – or 41,700 km2 - have already gone through the concession process.
eastern limit of salt east limit of salt Pre-salt reservoir
Source: Prepared from nepomuceno (2008).
Figure 1 – Location of pre-salt reserves
reserves. Comparatively, the national agency of Petroleum and Biofuels (anP) announced in 2006 that Brazil had about 11 billion barrels in proven reserves. If these reserves are confirmed, the country would move up from its current 15th place on the list of countries with the largest proven reserves in the world (CIa, 2012) and would more consistently join the group of ten countries with the largest number of proven reserves in the world, ahead of major producers such as Libya, nigeria, Qatar and the united states.
although many companies in the industry have technical capacity to ex-plore oil in deep waters, no one deny the challenge facing Brazil to access, through Petrobras, these reserves, which lie more than 4,500 meters deep in the ocean. the “challenges facing this project [...] may come to play the role of ca-talysis of science, technology and innovation in Brazil, somewhat similar to the role the apollo program – whose goal was to send humans to the moon - played in the united states” (Becker et al., 2010, p. 50). the investment required for its operation would be about us$400 billion, to be invested by 2020 (ibid, p.48-9). this investment will bring major implications for the socioeconomic conditions of Brazil (Lima, 2008) and will certainly draw international attention to the impact of these activities on the Brazilian energy matrix and on the GhG emission pattern.
the management and mitigation of GhG emissions arising from in-creased oil and natural gas production in Brazil, especially pre-salt layer reserves, because of their scale, can be considered one of the most challenging issues for the debate on sustainable development in Brazil between government, private sector, scientific institutions and civil society. Building a scientific foundation for the subject is relevant to assist in making present and future decisions about emission and mitigation management policies in this context.
this article seeks to contribute to debates about the sustainability analysis of the oil and gas industry in Brazil, aiming to identify the historical dynamics of fugitive emissions of greenhouse gases in the oil and natural gas industry in Brazil between 1990 and 2008. this limited time span is justified by the aim to systematize scientific data from the oil and gas industry in Brazil before the process of exploration, production and refining of hydrocarbons located under the pre-salt layer of Brazil’s continental seabed. this systematization could serve as a basis for future assessments of the impacts of GhG emissions from pre-salt and define mitigation options for this sector in Brazil.
thus, under the methodological scope adopted, this article does not aim to clarify issues related to the distinction between exploration and production models in their terrestrial and oceanic context (offshore exploration). It is clear that the Brazilian production is significantly higher in the off-shore environ-ment (about 89 percent of total national e&P activities occur in the marine environment). Likewise, it is not the focus of this article to analyze emissions relating to the use of products from oil and gas production in other sectors (e.g., the use of products in the transport sector) or to assess the trend of sustainability indicators and fugitive GhG emissions in the oil and gas industry for the com-ing years. however, the historical analysis of the indicators (the focus of this article) led to the construction of an interesting basis for prospective studies of future activities in the pre-salt region.
Period and scope of analysis, factors and metrics applied
the period under analysis - 1990 to 2008 - includes the first year of of-ficial monitoring by the Brazilian government of greenhouse gas emissions (1990) until the year prior to the actual beginning of prospecting procedures for the exploration of pre-salt resources. the scope of the analysis adopted lim-its fugitive emissions only to those linked to the three main greenhouse gases controlled by the united nations Framework Convention on Climate Change (unFCCC) namely Co2 (carbon dioxide), Ch4 (methane) and n2o (nitrous oxide). data on GhG emissions at the stages of oil and gas exploration and production (e&P), refining and transportation in Brazil were identified and analyzed. the data on total fugitive emissions apply the existing rules agreed under the Convention on Climate Change, thus adopting the global warming potential (GWP) approach.
therefore, the following ratios were used for data on total fugitive emis-sions to be aggregated to the metric equivalent carbon dioxide (Co2e). For n2o, the value used was 310; for Ch4, 21; and for Co2, 01. the methodol-ogy that generated the data on emissions follows the parameters and require-ments for calculating emissions set forth in the “Revised 1996 IPCC Guidelines for national Greenhouse Gas Inventories (Guidelines 1996)” and the “Good Practice Guidance and uncertainty management in national Greenhouse Gas Inventories (Good Practice Guidance 2000)” (Brazil, 2010, p.10). examples of the fugitive emissions profile adopted using similar methods for the industry have been available in specialized publications since the early 1990s, in detailed emission inventories (Picard et al., 1992, uK offshore operators association, 1993; u.s. ePa, 1993; oLF, 1993).
It is noteworthy that the concept of fugitive emissions associated with fuels,
not support a productive activity (e.g., combustion of natural gas at oil produc-tion facilities) (IPCC, 1996 p.1.6).
more specifically, in terms of fugitive emissions associated with the oil and gas industry (IPCC 1996), these emissions can be derived from disturbances and setbacks at any point in the production chain, exhaust leaks as well as equip-ment (non-combustion). note, also, that combustion emissions are included when considered as a non-productive activity. Fugitive emissions from oil explo-ration; crude oil production; production, processing, collection and separation of natural gas systems; oil refining; storage; distribution of products; shipping and forwarding; loading and unloading of oil tankers; emissions from methane pipelines and local transportation; compressors and maintenance of facilities; ventilation; release and/or combustion of excess gases are also considered as fugitive emissions from this industry (IPCC, 1996 p.1.7) and will be addressed and grouped in this article into three major segments of the production chain:
exploration & production, transportation, and reining.
Likewise, the focus of the analysis for fugitive emissions from the oil and gas industry (the use of fuels in Brazil is not covered in this analysis) follows a consistent approach, so as to enable comparing dimensions and avoiding distor-tions in further analysis using the same database. according to the mme & ePe (2010), due to future potential availability, it is estimated that in 2019 domestic daily consumption will be half the expected production for the industry, which is about 5.1 million barrels of oil per day.
the analysis of the relationship between total energy consumption and production in the oil and gas industry will adopt the ton of oil equivalent (toe) metric as a comparative energy unit. analyses of the above mentioned indica-tors to Gross domestic Product (GdP) and industry revenues are converted according to the 2007 annual average exchange rate of the u.s. dollar against the Brazilian real.
Analysis of oil and gas industry indicators in Brazil
table 1 – evolution of domestic supply, imports, domestic production, exports, domestic consumption and percentage of domestic consumption met by domestic oil and gas production in Brazil
Year Domestic Supply (Oil, Natural Gas and Prod-ucts) 103 toe Total industry Imports (Oil, Natural Gas and Prod-ucts) 103 toe Total domes-tic produc-tion of Oil, Natural Gas and Products
(Domestic Industry)
103 toe
Total Indus-try Exports (Oil, Natural Gas and Products) 103 toe Aggregate Domestic Consumption (Oil, Natural Gas and Products) 103 toe Percentage of Aggregate Domestic Consumption (Oil, Natural Gas
and Products) met by domestic
production (%)
1990 62,085 31,510 30,575 4,075 51,014 59.93
1991 62,252 30,767 31,485 3,788 51,799 60.78
1992 64,201 31,827 32,374 4,070 53,283 60.76
1993 66,632 35,711 30,921 3,383 55,637 55.58
1994 70,387 34,948 35,439 2,737 58,162 60.93
1995 76,210 33,958 42,252 1,359 63,151 66.91
1996 81,796 38,958 42,838 724 68,714 62.34
1997 87,228 41,124 46,104 2,328 73,353 62.85
1998 91,263 40,982 50,281 5,042 75,608 66.50
1999 93,229 36,455 56,774 5,232 75,811 74.89
2000 96,999 33,716 63,283 6,849 77,835 81.30
2001 100,523 32,553 67,970 9,352 79,421 85.58
2002 100,176 23,469 76,707 10,044 80,695 95.06
2003 96,580 18,141 78,439 11,008 79,233 99.00
2004 102,708 26,434 76,274 12,082 82,624 92.31
2005 105,079 19,301 85,779 11,108 84,390 101.65
2006 107,261 17,760 89,500 13,223 86,331 103.67
2007 111,438 19,603 91,834 11,790 91,084 100.82
2008 118,344 22,031 96,313 13,297 95,184 101.19
Source: Prepared by the authors from raw data provided by ePe (2009).
however, the national Gross domestic Product (GdP) of the energy sec-tor during the same period analyzed (1990-2008) also experienced a significant increase from about 45 billion to about 85 billion dollars. this significant GdP growth occurred especially from the turn of the millennium, after a downward trend throughout most of the 1990s. another important datum to be exam-ined is the relationship between the domestic supply of oil and oil products and GdP. In 1990, the ratio was 0.067 toe/$1000 of GdP. an assessment of the historical series for the period shows that the highest level was achieved in 1998 (0.081 toe/$1000 of GdP) followed by a steady downward trend that reached the lowest level in 2008 (0.059 toe / 1000 us $ of GdP).
In terms of productive organization, it can be said that the oil and gas industry has an oligopolistic production profile. however, in comparative terms transport and distribution can be considered as more decentralized. In the oil sector, Petrobras has a captive and isolated role in some parts of the chain, but international giants (e.g. Chevron-texaco and shell) are also present in Brazil, as well as domestic companies such as oGX. the gas industry counts on the par-ticipation of state enterprises besides Petrobras (e.g., Gasmig, in minas Gerais), thus enabling a slightly more decentralized regional distribution in relation to the oil sector. moreover, the gas industry has an extensive retail network in terms of distribution for household use.
In terms of jobs created, Petrobras (2008) had approximately 67,000 em-ployees. according to onIP (2000), in 2000 the sector provided about 95,000 direct jobs, while the Federation of oil Workers (FuP, 2010) indicated that it had over 150,000 members in 2010. the comparison of data (FuP, 2010; ePe, 2009; Brazil, 2010) enables inferring a ratio of about 1.3 jobs per 1,000 tons of oil equivalent,2 based on a primary oil and gas production of about 115 mtoe in 2008.
the analysis of greenhouse gas emissions shows that e&P activities gener-ated some 2.5 million tons of Co2 in 1990, against more than 7 million tons in 2008. this rise in GhG emissions represents an increase of about 191 percent in 2008 compared to 1990. these figures exceed the increase in the total do-mestic production of oil and natural gas, which over the same period rose about 215 percent (from 30.5 mtoe in 1990 to 96.3 mtoe in 2008).
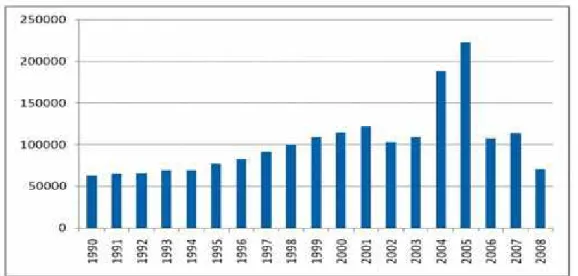
Figure 1 – evolution of fugitive emissions of greenhouse gases (tCo2e) related to oil and Gas transportation in Brazil from 1990 to 2008
the refining stage is the part of the supply chain that currently generates the largest amount of fugitive emissions of greenhouse gases. the volume of oil refined in Brazil increased considerably over the study period – 53 percent3
(ePe, 2009). nevertheless, fugitive emissions of greenhouse gases in this part of the production chain were found to have risen above this level, showing an increase of 76 percent compared to 1990 (Brazil, 2010). Likewise, the compari-son of data (ePe, 2009; Brazil, 2010) showed an increase of about 15 percent in fugitive emissions of GhG per unit of refined oil (tCo2e/toe).
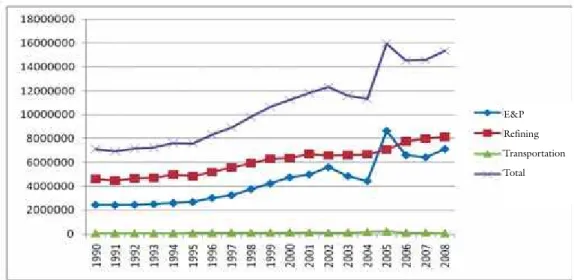
anyway, in a consolidated manner fugitive emissions of GhG from the oil and gas industry in Brazil correspond to about 15.3 mtCo2e (Brazil, 2010), accounting for about 0.7 percent of Brazil’s total emissions in 2005 (Brazil, 2010). Figure 2 shows that despite the peak of fugitive emissions of GhG dur-ing the e&P phase in 2005, the refindur-ing stage is still responsible the highest absolute emission of GhG from the industry.
E&P Refining Transportation Total
Source: developed from the mCt database (Brazil, 2010).
Figure 2 – evolution of total fugitive emissions of greenhouse gases in the oil and gas industry (tCo2e) in Brazil (1990-2008).
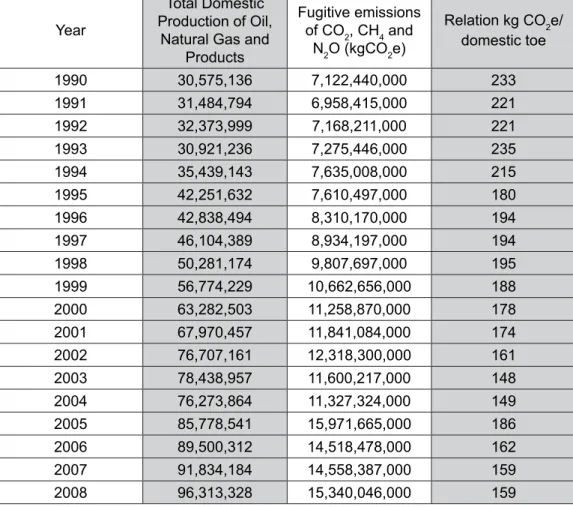
table 2 enables comparing the evolution of GhG emissions from the domestic production of oil, oil products and natural gas. When considering the fugitive emissions from the three stages of the production process, a reduction was found in the relation of kg Co2e per primary toe produced over the study period, although absolute emissions almost doubled from 1990 to 2008. While in 2008 the relation was about 159 kg Co2e/toe domestically produced, in 1990 this figure was about 233 kg Co2e/toe. When this ratio is analyzed in percentage terms, a reduction of about 32 percent is found in the intensity of fugitive emissions from 1990 to 2008 per toe produced domestically.
table 2 – evolution of domestic production, total fugitive emissions and ratio of kg Co2e/domestic toe from the oil and gas industry in Brazil
Year
Total Domestic Production of Oil,
Natural Gas and Products
Fugitive emissions of CO2, CH4 and
N2O (kgCO2e)
Relation kg CO2e/ domestic toe 1990 30,575,136 7,122,440,000 233 1991 31,484,794 6,958,415,000 221 1992 32,373,999 7,168,211,000 221 1993 30,921,236 7,275,446,000 235 1994 35,439,143 7,635,008,000 215 1995 42,251,632 7,610,497,000 180 1996 42,838,494 8,310,170,000 194 1997 46,104,389 8,934,197,000 194 1998 50,281,174 9,807,697,000 195 1999 56,774,229 10,662,656,000 188 2000 63,282,503 11,258,870,000 178 2001 67,970,457 11,841,084,000 174 2002 76,707,161 12,318,300,000 161 2003 78,438,957 11,600,217,000 148 2004 76,273,864 11,327,324,000 149 2005 85,778,541 15,971,665,000 186 2006 89,500,312 14,518,478,000 162 2007 91,834,184 14,558,387,000 159 2008 96,313,328 15,340,046,000 159
Source: Prepared by the authors from raw data provided by ePe (2009) and Brazil (2010).
Final Remarks
energy consumption, production and supply, as well as GhG emissions can be considered relevant indicators for the analysis of sustainable develop-ment. the results found show a growth dynamics of fugitive emissions from the oil and natural gas industry in Brazil of about 115 percent in 1990 against an-nual emissions in 2008. In absolute terms, this increase in anan-nual fugitive emis-sions from the industry was around 8.2 million tons of Co2e when compared to 1990 and 2008. although this increase is significant per se, when compared to the country’s total emissions these emissions are still relatively low - less than 0.073 percent of domestic GhG emissions in 2005.
analysis is relatively short for the purpose of statistical analysis (18 years), there were positive developments in the period in terms of relative reduction of total GhG fugitive emissions in the sector per unit of domestic production. there was also a reduction from 233 kg Co2e/toe supplied in 1990 to 159 kg Co2e / toe supplied in 2008. this interpretation indicates that although the relative growth of absolute fugitive emissions occurred at a much slower pace than the domestic production of oil, oil products and natural gas, it is undeniable that the results clearly show that there is a growing relationship between the expansion of exploration and production activities and the increase in absolute emissions of greenhouse gases from the industry.
therefore, it is still necessary to reflect on processes, policies and mecha-nisms that would propel the industry towards technological innovation, with the aim of addressing the challenge of reducing its GhG fugitive emissions in absolute terms. In this regard, mention should be made of the importance of conducting further prospective studies on employment indicators, energy con-sumption, as well as an analysis of the life cycle of GhG emissions from e&P ac-tivities, refining and transportation of hydrocarbons from the pre-salt layer, as a contribution to the design of public policies and the development of preventive technologies. these reflections could help in the design of measures to reduce the environmental impact of the oil and gas industry, thus contributing to the realization of the sustainable development agenda in Brazil.
notes
1 the authors thank mr. José domingos Gonzalez miguez for his critical remarks during the drafting of this article.
2 data from FuB (2010) were used, as they are considered conservative to represent the sector, since no precise data on occupation in the distribution sector within the production chain were found.
3 In 1990, Brazil refined 60,709,096 toes, while in 2008 this figure increased to 92,968,857 toes.
References
anP – natIonaL PetRoLeum aGenCY. anuário estatístico da Indústria do Pe-tróleo 1990-1999. Rio de Janeiro: a agência, 2000. Anuário Estatístico 2006. available at: <http://www.anp.gov.br/conheca/anuario_2006.asp>. access on 21 June 2007. austIn, d. et al. History of the offshore oil and gas industry in southern Louisiana: Interim report; volume I: Papers on the evolving offshore industry. u.s. dept. of the Interior, minerals management service, Gulf of mexico oCs Region, new orleans, La. oCs study mms 2004.
aZevedo, R. L. m. o Pré-sal: oportunidades para o Brasil. In: sImPÓsIo de Ge-oLoGIa do sudeste. estância de são Pedro, 17 october 2009.
de Petróleo e Gás natural. Relatórios de referência - versão para consulta pública. se-gundo inventário nacional de gases de efeito estufa (Gee). Brasília: mCt, 2010. BRaZIL. First national Communication under the united nations Framework Con-vention on Climate Change. Brasília: mRe/mCt/mma/mme and mdIC, 2006. _______. A contribuição do Brasil para evitar a mudança do clima. Brasília: mRe/ mCt/mma/mme and mdIC, 2007.
_______. ministry of science and technology. General Coordination of Global Climate Change. Second national Communication under the united nations Framework Con-vention on Climate Change. Brasília: mCt, 2010.
BeCKeR, B. et al. Livro azul da 4ª Conferência Nacional de Ciência e Tecnologia e inovação para o Desenvolvimento Sustentável. Brasília: ministry of science and techno-logy/management and strategic studies Center, 2010.
BeRman, a. three super-giant fields discovered in Brazil’s santos Basin. World Oil, v.229, n.2, fev. 2008.
CastRo, I. e. de. Geograia e política. Rio de Janeiro: Bertrand Brasil, 2006.
CIa. the World Fact Book - Country Comparison: Oil - proved reserves. available at: <ht- tps://www.cia.gov/library/publications/the-world-factbook/rankorder/2178rank. html>. access on: 7 Feb. 2012.
de GouveLLo, C. et al. Brazil Low-carbon Country Case study. Washington: the World Bank Group, 2010.
ePe – eneRGY ReseaRCh ComPanY. Balanço energético nacional 2009 - Ano Base 2008. Rio de Janeiro: ePe, 2009.
FuP – GeneRaL unIon oF oIL WoRKeRs. História da FuP. available at:
<http://www.fup.org.br/historia.php>. access on: 5 sept. 2010.
GIddens, a. The politics of climate change. Cambridge: Polity Press, 2009. Iea. World Energy Outlook. International energy agency, 2009.
IPCC – InteRGoveRnmentaL PaneL on CLImate ChanGe. First
Asses-sment Report 1990. (FaR) Wmo/uneP, 1990.
IPCC. Second Assessment Report – Climate Change 1995: a report of the Intergover-nmental Panel on Climate Change. Geneva: Wmo/uneP, 1995.
_______. IPCC Guidelines for National Greenhouse Gas Inventories. Geneva: Wmo/ unep, 1996.
_______. Third Assessment Report – Climate Change 2001 – and the synthesis Report. Geneva: IPCC, 2001a.
IPCC – InteRGoveRnmentaL PaneL on CLImate ChanGe. Revised Good Practice Guidance and uncertainty management in national Greenhouse Gas Inventories. Good Practice Guidance 2000. Geneva: IPCC, 2001b.
_______. Fourth Assessment Report of the Intergovernmental Panel on Climate Change
IPCC. Geneva: Wmo/uneP, 2007a.
_______. Deinitions and Methodological Options to Inventory Emissions from Direct Hu -man-induced Degradation of Forests and Devegetation of Other Vegetation Types. IGes for the IPCC. s. d.
LenZen, m.; deY, C. truncation error in embodied energy analyses of basic iron and steel products. Energy, v.25, Pergamon, 2000.
LIma, J. a. m. a energia que vem do mar: a herança energética do mar brasileiro. Cienc. Cult. [online], v.62, n.3, p.25-8, 2010.
LIma, P. C. R. Os desaios, os impactos e a gestão da exploração do pré-sal. estudo. Bra-sília: Consultoria Legislativa, nov. 2008.
LuhnoW, d. méxico criou o nacionalismo do petróleo e agora paga caro por isso. O estado de S. Paulo/Wall Street Journal. 15 June 2005.
meXICo. Tercera Comunicación Nacional ante la Convención Marco de las Naciones
unidas sobre el Cambio Climático. Ciudad de méxico: Ine, 2006.
mme & ePe, ministry of mines and energy, energy Research Company. Plano dece-nal de expansão de energia 2019 / ministry of mines and energy. energy Research Company. Brasília: mme/ePe, 2010.
naKamuRa, s.; Kondo, Y. Input-output analysis of Waste management. Journal of Industrial Ecology, massachusetts Institute of technology and Yale university, v.6, n.1, 2002.
nasaI, K. et al. Compilation and application of Japanese Inventories for energy Consumption and air Pollutant emissions using Input-output tables. Environmental Science and Technology, v.37, n.9, 2003.
nePomuCeno, F. experiências da Petrobras no caminho do pré-sal. In: RIo oIL & Gas ConFeRenCe. Rio de Janeiro. september 2008.
oLF – norwegian oil Industry association. Report from oLF environmental Pro-gramme – Phase 2. oslo: 1993
onIP – natIonaL oRGanIZatIon oF the oIL IndustRY. Impacto
econô-mico da expansão da indústria do petróleo – Final Report. december 2000.
PetRoBRas. Balanço social e ambiental 2008 - efetivo aumenta 52,1% em cinco anos. available at: <http://www.hotsitespetrobras.com.br/rao2008/i18n/pt/balanco-so-cial-e-ambiental/trabalho/trabalhadores.aspx>. access on 4 sept. 2010.
PICaRd, d. et al. a detailed Inventory of Ch4 and voC emissions from upstre-am oil and Gas operations in alberta. Clearstone engineering Ltd., for the Canadian Petroleum association, march 1992.
PICaRd, d. et al. Fugitive emissions from oil and natural Gas activities: Back-ground paper. In: IPCC, Energy Sector - Good Practice Guidance and Uuncertainty
Management in National Greenhouse Gas Inventories. Revised Good Practice Guidance and uncertainty management in national Greenhouse Gas Inventories (Good Practi-ce GuidanPracti-ce 2000). Geneva: IPCC, 2001.
PReste, P. Le. Ecopolítica internacional. são Paulo: senac, 1997. 518p.
steRn, n. et al. Stern Review on the Economics of Climate Change. London: hm treasury, 2006.
uK offshore operators association Ltd. methane emissions From offshore oil & Gas exploration & Production activities 1992. Submitted to The Watt Committee on Energy, 1993.
unFCCC. sixth compilation and synthesis of initial national communications from Parties not included in annex I to the Convention. montreal, sBI twenty-ninth session. 1-10 december 2008.
us ePa. anthropogenic methane emissions in the united states: estimates for 1990, Report to the US Congress, us environmental Protection agency, office of air and Ra-diation, Washington, dC, usa, 1993.
usa. us Climate action Report - Fourth national Communication of the united states of america under the united nations Framework Convention on Climate Change. Washington: usa, 2007.
WCed – WoRLd CommIssIon on envIRonment and deveLoPemnt. Nosso futuro comum. 2.ed. Rio de Janeiro: editora da Fundação Getulio vargas, 1991.
absTracT – the Brazilian energy matrix is known to be one of the most renewable in
the world. due to the size of the oil reserves found in the Pre-salt fields, doubts have been raised as to the maintenance of this energy and greenhouse gas (GhG) emis-sion pattern. the scientific goal of this article is to identify the historical profile of the sector’s fugitive GhG emissions due to the oil & gas production, refining and transpor-tation in Brazil from 1990 to 2008, prior to the Pre-salt layer hydrocarbon resources exploration. the study shows that total GhG emissions increased around 115 percent from 1990 to 2008 – an annual emission increase of 8.2 million tCo2. however, GhG intensity per ton of oil equivalent produced was reduced by 32percent.
Keywords: Climate change, oil and natural gas, Fugitive emissions of greenhouse
Thiago de Araújo Mendes is a Phd candidate in sustainable development (Csd-unB) and a professor in the Graduate Program in management of environmental Projects at PuC minas IeC-course Graduate management environmental Projects. @ – [email protected]
Saulo Rodrigues Filho holds a Phd in environmental sciences from the universi-tat heidelberg, Germany (1999, magna Cum Laude) and is an associate professor and director of the Center for sustainable development (Cds) at the university of Brasilia (unB). deputy editor of the Journal of Soils and Sediments - Springer. @ – [email protected]