1 Programa de Pós-Graduação em Ciências da Motricidade, Faculdade de Ciências e Tecnologia, Universidade Estadual Paulista, Presidente Prudente, SP, Brazil. 2 Faculdade Maurício de Nassau, Natal, RN, Brazil.
3 Universidade Tecnológica Federal do Paraná, Apucarana, PR, Brazil.
Corresponding author: Luis Alberto Gobbo − Rua Roberto Simonsen, 305 − Zip code: 19060-900 − Presidente Prudente, SP, Brazil − Phone: (55 18) 3229-5720 – E-mail: luisgobbo@fct.unesp.br Received on: Mar 16, 2017 − Accepted on: Aug 31, 2017
Conflict of interest: none. DOI: 10.1590/S1679-45082017AO4058 ABSTRACT
Objective: To analyze which abnormalities in body composition (obesity, sarcopenia or sarcopenic obesity) are related to reduced mobility in older people aged 80 years and older. Methods: The sample included 116 subjects aged 80 years and older. The body composition was measured using dual-energy X-ray absorptiometry (DXA) and mobility was assessed by motor tests. The χ2 test was used to analyze the proportion of older people with sarcopenia, obesity and sarcopenic obesity based on sex as well as to indicate an association between obesity, sarcopenia, sarcopenic obesity and mobility. Binary logistic regression, adjusted for the variables (sex and osteoarticular diseases), was used to express the magnitude of these associations. One-way analysis of variance was used to compare the mobility of four groups (Normal, Obesity, Sarcopenia and Sarcopenic Obesity). Results: The Sarcopenia Group had lower performance in the lower limbs strength test and in sum of two tests compared with Obesity and Normal Groups. Older people with sarcopenia had higher chance of reduced mobility (OR: 3.44; 95%CI: 1.12-10.52). Conclusion: Older people aged 80 years and older with sarcopenia have more chance for reduction in mobility.
Keywords: Aging; Body composition; Gait; Densitometry; Aged, 80 and over; Aged; Sarcopenia; Obesity; Mobility limitation
RESUMO
Objetivo: Analisar quais agravos na composição corporal (obesidade, sarcopenia ou obesidade sarcopênica) estão relacionados à redução
da mobilidade em idosos com 80 anos ou mais. Métodos: A
amostra foi constituída por 116 sujeitos com idade igual ou superior a 80 anos. A composição corporal foi mensurada pela técnica de
absorciometria de raios X de dupla energia (DXA), e a mobilidade foi avaliada por testes motores. O teste χ2 foi utilizado para analisar a proporção de idosos com sarcopenia, obesidade e obesidade sarcopênica, de acordo com o sexo, bem como para indicar a associação entre obesidade, sarcopenia, obesidade sarcopênica e mobilidade. A análise de regressão logística binária, ajustada pelas variáveis (sexo e doenças osteoarticulares), foi utilizada para expressar a magnitude das associações. A análise de variância foi usada para comparar a mobilidade entre os quatro grupos (Normal, Obesidade, Sarcopenia e Obesidade Sarcopênica). Resultados: O Grupo Sarcopenia apresentou menor desempenho no teste de força de membros inferiores e na soma dos dois testes, comparado aos Grupos Obesidade e Normal. Idosos com sarcopenia apresentaram maior chance de redução da mobilidade (OR: 3,44; IC95%: 1,12-10,52). Conclusão: Idosos com idade igual ou superior a 80 anos com sarcopenia têm mais chance de redução da mobilidade.
Descritores: Envelhecimento; Composição corporal; Marcha; Densitometria; Idoso de 80 anos ou mais; Idoso; Sarcopenia; Obesidade; Limitação da mobilidade
INTRODUCTION
Advanced age is a risk factor for reduced mobility, and when age is associated with changes in body composition, such as the relative increase in body fat in
relation to lean mass,(1) the deleterious effects may be
potentiated.(2) A marked decrease in muscle mass that
occurs with aging, associated with low muscle strength
or low physical performance, is defined as sarcopenia.(3)
Obesity, sarcopenia, sarcopenic obesity and reduced mobility
in Brazilian older people aged 80 years and over
Obesidade, sarcopenia, obesidade sarcopênica e mobilidade reduzida
em idosos brasileiros com 80 anos ou mais
Vanessa Ribeiro dos Santos1, Igor Conterato Gomes2, Denise Rodrigues Bueno3,
When this condition coexists with excess of body fat, it
is defined as sarcopenic obesity.(4)
Reduction in mobility can be considered as an indicator of health because it affects quality of life in aging process by causing difficult in some daily life activities and the use of public transport, therefore, directly affecting the independence of older people. Another serious consequences of the development of physical impairment are the increased need for
hospitalization and the use of the health services,(5)
which result in a negative impact on the public health system.
Evidence indicates that sarcopenia,(6,7) obesity(8,9)
and sarcopenic obesity(10,11) are predictors of reduced
mobility, however, it has become necessary to investigate which of these conditions is more related to reduced mobility in older people aged 80 years or older, particularly because subjects belonging to this age
group are more predisposed to disability.(12)
OBJECTIVE
To determine which abnormalies in body composition (obesity, sarcopenia or sarcopenic obesity) are related to reduced mobility in older people aged 80 years and older.
METHODS
This was a cross-sectional study with a non-randomized convenience sample conducted between October 2009 and May 2010 in the city of Presidente Prudente (SP) Brazil, with 210,000 habitants approximately located
in the Southeastern Region of Brazil.(13)
Older people, aged 80 years and older of both sexes were invited to participate in the study. The Presidente Prudente municipalilty health department provided the names, addresses and telephone numbers of individuals who used the public health service of the city. The invitation was made via telephone and, in addition, the research was also disclosed in the local media. A total of 135 subjects responded the invitation. We excluded those who were unable to walk, bedridden, residents of rural areas, institutionalized, with pacemakers and had incomplete data in the database. The final sample consisted of 116 individuals.
Objectives and methods used for data collection were explained and individuals were informed that they could leave the study at any time. Only those who signed the Informed Consent were included in the sample. All protocols were reviewed and approved by
the Research Ethics Committee of the Universidade
Estadual Paulista (case number 26/2009).
Body composition
For body composition analysis we used the 3-compartment model dual energy X-ray absorptiometry (DXA), Lunar brand°, model DPX-MD, software 4.7 equipment. This technique allows to estimate whole and segmented body composition (lean mass, fat mass and body mineral density of trunk, upper and lower limbs). Data were transmitted to a device connected to a computer on which results of lean mass, body fat and bone mineral density were recorded.
Gait speed
A 3-meter walking test was used to assess the gait speed. Subjects were instructed to walk naturally, and the lower time (in seconds) obtained between two walks was recorded.
Definition of groups
The sample was divided into four groups: Normal Group (NG), with subjects who were not obese or sarcopenic; Obesity Group (OG), with subjects who had a fat percentage above the 60th percentile (34.1 and 44.2%, for men and women, respectively), according
to the recommendations of Baumgartner et al.,(14)
Sarcopenia Group (SG), with subjects with low muscle mass and low gait speed were classified as sarcopenic; and Sarcopenic Obesity Group (SOG), with subjects who had both these unfavorable conditions (obesity and sarcopenia).
For muscle mass classification, the appendicular lean mass (ALM) index was used (upper limb + lower
limb lean mass [kg]/stature [m]2), the individuals with
ALM index below 7.59kg/m2 and 5.57kg/m2 for men
and women, respectively, were considered with low muscle mass. The adoption of these cutoff points was based on two standard deviations below the mean of a reference group of Brazilian young adults (n=60; 25
men and 35 women) aged between 20 and 30 years.(15)
Subjects with gait speed below 0.8m/s in the 3-meters
walking test, were considered with low gait speed.(3)
Mobility
Mobility was defined by performance achieved in static balance test; and sit-to-stand test, from the Short Physical
Performance modified Battery.(16)
Each measurement was considered successful when the individual could remain for 10 seconds in the mentioned position. The possible scores for this test were: zero if disability, unable to perform any action for the stipulated time; 1 if individual could hold a side-by-side stand position but was unable to hold a semi-tandem stand position; 2 if individual could hold a semi-tandem stand position but was unable to stand on one foot; 3 if individual could stand on one foot but was unable to hold a tandem stand position; 4 if individual could held the full tandem stand position.
To measure the strength of the lower limbs the sit-to-stand test was applied, in which subjects kept their arms crossed over chest, and, at a signal from the evaluator, stood up and sat down in the chair as quickly as possible, five times without pause. Those who failed to perform this task in less than 60 seconds were disqualified from the test. Scores attributed to this test were: zero if not able to perform the test; 1 if time greater than or equal to 16.70 seconds; 2 if time taken between 13.70 and 16.69 seconds; 3 if time taken between 11.20 and 13.69 seconds; 4 if time taken less than or equal to 11.19 seconds.
For mobility classification we considered performance by sum of two tests (zero to 8 points), with those with a total score below 25 percentile (3 points), whom were considered as lower mobility individuals.
Osteoarticular diseases
Osteopenia and osteoporosisWe used the DXA to identify osteopenia and osteoporosis. Bone mineral density of the total proximal femur was analyzed based on manufacturer protocol by an experienced technician. Individuals were classified as osteopenia or osteoporosis according to the criteria
established by the World Health Organization.(17)
Other osteoarticular diseases
The prevalence of arthritis, osteoarthritis, herniated disc, back pain and scoliosis in the study population was verified by the reported morbidities questionnaire, taken from the Standard Health Questionnaire for
Washington State.(18) This is a closed survey to identify
the presence/absence of chronic diseases, distributed into three groups: cardiovascular, metabolic, and osteoarticular.
Statistical analysis
The χ2 test was used to analyze the proportion
of older people in groups (NG, OG, SG and SOG)
according to sex as well as to indicate associations between the dependent (mobility) and independent (sarcopenia, obesity and sarcopenic obesity) variables.
The independent variables with p<0.20 in the χ2 test
were included in the multivariate model built by binary logistic regression analysis, adjusted for the control variables (sex and osteoarticular diseases), which expresses the magnitude of associations in values of odds ratio (OR) and their 95% confidence intervals. One-way analysis of variance (ANOVA) was used to compare the mobility of the four groups analyzed followed by the post-hoc Tukey test. Statistical analysis was performed using Statistical Package of Social Science (SPSS) software, version 17.0, and significance level was set at 5%.
RESULTS
The sample of study consisted of 116 older individuals aged between 80 and 95 years, mean 83.3 (2.7) years. Of these, 69 (60%) were women, mean 83.8 (2.9) years, and 47 (40%) were men, mean 83.3 (2.5) years.
There was no significant difference between groups (NG, OG, SG and SOG) in proportion for osteoarticular diseases (p=0.748).
Figure 1shows the distribution of the sample according
to obesity, sarcopenia and sarcopenic obesity and comparison analysis between sexes. Men had higher proportion of sarcopenic obesity (8.6%) and women had a higher proportion of obesity (23.3%).
Figure 1. Frequency distribution of the Normal, Obesity, Sarcopenia and Sarcopenic Obesity Groups according to sex
people aged 80 years and over. It was observed that older people with sarcopenia had more limited mobility compared with NG, OG, or SOG.
Reduction in lean mass is one of the most frequently
used variable for indicative losses in mobility.(7) Men
have larger amounts of lean mass and a higher incidence
of sarcopenia compared to women.(19) Our findings
corroborate with previously studies in which the proportion of older people aged 80 years and older with sarcopenia was higher in men (10.3%) than in women (7.8%) and, consequently, sarcopenic obesity − 8.6% and 1.7%, respectively.
Sarcopenia is related to mobility and functional
impairment in older people older than 60 years.(20) Also
sarcopenia influences mobility, however, the amount of fat and body size should also be considered for such
analysis.(6) In our study, sarcopenia alone was associated
with reduced the mobility, and increased the chances of an older people aged 80 years and older to present reduced mobility by 3.44 times, regardless of the sex and presence of osteoarticular diseases.
Women had higher proportions of body fat.(21)
Gomes et al.,(22) also observed this evidence in women
aged 80 years and older, similar to results found in this study, in which 23.3% of the women were identified with obesity compared with 7.8% of men.
A higher quantity of fat mass or higher proportion of body fat can increase the body overload, limit movements and impose additional stress on joints and
muscles, thereby accentuating the risk of disability.(23)
In our study, obesity was not a limiting factor for mobility. Similar to our results, Sallinen et al.,(24) also
found no association between body fat and mobility in older people aged 80 years and older. These results may indicate that body fat does not interfere in the mobility of the elderly aged 80 years and older, since it
tends to redistribute and reduce with aging.(25)
Sarcopenic obesity represents a challenge for health professionals who need to apply appropriate interventions in elderly population in order to reduce the risk that excess fat can cause to their health whilst
preserving lean mass.(26) Due to these factors, sarcopenic
obesity is considered as one of the most damaging morphological conditions to both mobility and the
general health of older people.(27)
This association was observed by Stenholm et al.,(11)
who found that sarcopenic obesity increased the risk of reduction in walking speed and mobility impairments in the elderly over 65 years. Our findings differ from those found in the study mentioned because older people aged 80 years and older with sarcopenic obesity showed no low mobility compared with other groups.
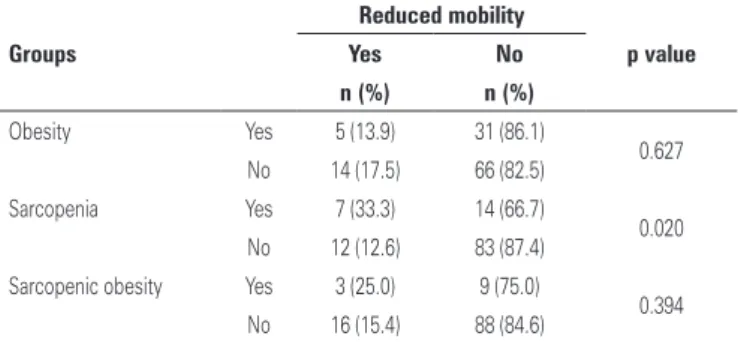
Table 2. Association between obesity, sarcopenia, sarcopenic obesity and mobility of older individuals aged 80 years and older
Groups
Reduced mobility
p value
Yes No
n (%) n (%)
Obesity Yes 5 (13.9) 31 (86.1)
0.627
No 14 (17.5) 66 (82.5)
Sarcopenia Yes 7 (33.3) 14 (66.7)
0.020
No 12 (12.6) 83 (87.4)
Sarcopenic obesity Yes 3 (25.0) 9 (75.0)
0.394
No 16 (15.4) 88 (84.6)
Table 3. Multiple analysis between sarcopenia and reduced mobility of older
individuals aged 80 years and older
Sarcopenia Reduced mobility p value
OR* (95%CI95)
Yes 3.44 (1.12-10.52)
0.031
No 1.00
* Model adjustment by sex and osteoarticuar diseases. Hosmer and Lemeshow test 0.84. OR: odds ratio; 95%CI: 95% confidence interval.
Table 1. Comparison of mobility between the Normal, Obesity, Sarcopenia and
Sarcopenic Obesity Groups
Tests
Normal Obesity Sarcopenia Sarcopenic
obesity
f p value
(n=47) (n=36) (n=21) (n=12)
Mean (SD) Mean (SD) Mean (SD) Mean (SD)
Balance 3.0 (1.2)* 2.9 (1.3)* 2.6 (1.6)† 2.7 (1.6)*† 0.420 0.739
Strength 2.0 (1.4)* 1.9 (1.2)* 0.9 (1.3)† 1.1 (0.9)*† 5.030 0.003
Two tests 5.0 (2.1)* 4.8 (2.1)* 3.6 (2.5)† 3.8 (2.2)*† 2.705 0.049
*† Different letters mean difference between groups.
SD: standard deviation.
The association between obesity, sarcopenia and sarcopenic obesity and mobility is shown in table 2. There was association between sarcopenia and reduced mobility.
In table 3 includes the multiple analysis between sarcopenia and reduced mobility. Older people with sarcopenia had 3.44 times more chances of reduced mobility regardless of sex and presence of osteoarticular diseases, compared with those without sarcopenia.
DISCUSSION
Level of physical activity affected the components of lean mass and body fat. Over time, the elderly tend to become increasingly sedentary which leads to a vicious cycle of reduced mobility, and with the reduction in mobility the levels of physical activity become even more
low.(28) Carmo et al.,(29) demonstrated the influence of
physical activity when they showed that mobility for activities such as walking, sitting and rising from a chair and getting up it from the prone position was more preserved in elderly women who were physically active. Therefore, physical activity should be viewed as a
solution to the loss of mobility by preserving physical(29)
and body(30) components.
Despite the relevance of the results found in our study, some limitations were: no use of control variables as physical activity, energy intake and socioeconomic status, analogue scale of pain; no use of ADL questionnaires; the cross-sectional design of the study limited the ability of establishes causal relationships. However, it must be mention that studies to verify such aspects in older people aged 80 years and older are still scarce.
CONCLUSION
Older people aged 80 years and older with sarcopenia have more chance for reduction in mobility. Preventive measures such as the practice of physical activity, especially in the course of life, can avoid the occurrence of sarcopenia and attenuate mobility reduction in the older people. Further longitudinal surveys are need to observe the causal relationships.
ACKNOWLEDGEMENTS
This work was supported by a studentship (VRS) from the Conselho Nacional de Desenvolvimento Científico e Tecnológico (CNPq), Brazil.
REFERENCES
1. Strugnell C, Dunstan DW, Magliano DJ, Zimmet PZ, Shaw JE, Daly RM. Influence of age and gender on fat mass, fat-free mass and skeletal muscle mass among Australian adults: the Australian diabetes, obesity and lifestyle study (AusDiab). J Nutr Health Aging. 2014;18(5):540-6.
2. Vincent HK, Vincent KR, Lamb KM. Obesity and mobility disability in the older adult. Obes Rev. 2010;11(8):568-79. Review.
3. Cruz-Jentoft AJ, Baeyens JP, Bauer JM, Boirie Y, Cederholm T, Landi F, Martin FC, Michel JP, Rolland Y, Schneider SM, Topinková E, Vandewoude M, Zamboni M; European Working Group on Sarcopenia in Older People. Sarcopenia: European consensus on definition and diagnosis: Report of the European Working Group on Sarcopenia in Older People. Age Ageing. 2010; 39(4):412-23.
4. Zamboni M, Mazzali G, Fantin F, Rossi A, Di Francesco V. Sarcopenic obesity: a new category of obesity in the elderly. Nutr Metab Cardiovasc Dis. 2008; 18(5):388-95. Review.
5. Lubitz J, Cai L, Kramarow E, Lentzner H. Health, life expetancy, and health care spending among the elderly. N Engl J Med. 2003;349(11):1048-55. 6. Dufour AB, Hannan MT, Murabito JM, Kiel DP, McLean RR. Sarcopenia
definitions considering body size and fat mass are associated with mobility limitations: the Framingham Study. J Gerontol A Biol Sci Med Sci. 2013; 68(2):168-74.
7. da Silva Alexandre T, de Oliveira Duarte YA, Ferreira Santos JL, Wong R, Lebrão ML. Sarcopenia according to the european working group on sarcopenia in older people (EWGSOP) versus dynapenia as a risk factor for disability in the elderly. J Nutr Health Aging. 2014;18(5):547-53.
8. Hergenroeder AL, Wert DM, Hile ES, Studenski SA, Brach JS. Association of body mass index with self-report and performance-based measures of balance and mobility. Phys Ther. 2011;91(8):1223-34.
9. Murphy RA, Reinders I, Register TC, Ayonayon HN, Newman AB, Satterfield S, et al. Associations of BMI and adipose tissue area and density with incident mobility limitation and poor performance in older adults. Am J Clin Nutr. 2014; 99(5):1059-65.
10. Rolland Y, Lauwers-Cances V, Cristini C, Abellan van Kan G, Janssen I, Morley JE, et al. Difficulties with physical function associated with obesity, sarcopenia, and sarcopenic-obesity in community-dwelling elderly women: the EPIDOS (EPIDemiologie de l’OSteoporose) Study. Am J Clin Nutr. 2009; 89(6):1895-900.
11. Stenholm S, Alley D, Bandinelli S, Griswold ME, Koskinen S, Rantanen T, et al. The effect of obesity combined with low muscle strength on decline in mobility in older persons: results from the InCHIANTI study. Int J Obes (Lond). 2009;33(6):635-44.
12. Cardoso JH, da Costa JS. [Epidemiological characteristics, functional capacity and factors associated with elders in a private health insurance]. Cien Saude Colet. 2010;15(6):2871-8. Portuguese.
13. Instituto Brasileiro de Geografia e Estatística (IBGE). Censos demográficos [Internet]. Rio de Janeiro: IBGE; 2010 [citado 2012 Jan 12]. Disponível em: http://www. ibge.gov.br/home/estatistica/populacao/censo2010/caracteristicas_da_ populacao/caracteristicas_da_populacao_tab_brasil_zip.shtm
14. Baumgartner RN, Wayne SJ, Waters DL, Janssen I, Gallagher D, Morley JE. Sarcopenic obesity predicts instrumental activities of daily living disability in the elderly. Obes Res. 2004;12(12):1995-2004.
15. Baumgartner RN, Koehler KM, Gallagher D, Romero L, Heymsfield SB, Ross RR, et al. Epidemiology of sarcopenia among the elderly in New Mexico. Am J Epidemiol. 1998;147(8):755-63. Erratum in: Am J Epidemol. 1999;149(12):1161. 16. Guralnik JM, Simonsick EM, Ferrucci L, Glynn RJ, Berkman LF, Blazer DG, et
al. A short physical performance battery assessing lower extremity function: association with self-reported disability and prediction of mortality and nursing home admission. J Gerontol. 1994;49(2):M85-94.
17. World Health Organization (WHO). Prevention and management of osteoporosis: Report of a WHO scientific group. Geneva: WHO; 2003. [WHOtechnical report series; 921].
18. Washington State Health Insurance Pool. Standard Health Questionnaire for Washington State. Washington [Internet]. 2005 [cited 2009 Jun 9]. Available from: http://www.wship.org/Docs/SHQ_Recert2005_REV_4-11-2005.pdf 19. Abe T, Thiebaud RS, Loenneke JP, Loftin M, Fukunaga T. Prevalence of
site-specific thigh sarcopenia in Japanese men and women. Age (Dordr). 2014; 36(1):417-26.
20. Janssen I, Heymsfield SB, Ross R. Low relative skeletal muscle mass (sarcopenia) in older persons is associated with functional impairment and physical disability. J Am Geriatr Soc. 2002;50(5):889-96.
21. Farooq A, Knez WL, Knez K, Al-Noaimi A, Grantham J, Mohamed-Ali V. Gender differences in fat distribution and inflammatory markers among Arabs. Mediators Inflamm. 2013;2013:497324.
23. Bouchard DR, Choquette S, Dionne IJ, Brochu M. Is fat mass distribution related to impaired mobility in older men and women? Nutrition as a determinant of successful aging: the Quebec longitudinal study. Exp Aging Res. 2011;37(3):346-57.
24. Sallinen J, Stenholm S, Rantanen T, Heliöaara M, Sainio P, Koskinen, S. Effect of age on the association between body fat percentage and maximal walking speed. J Nutr Health Aging. 2011;15(6):427-32.
25. Buffa R, Floris GU, Putzu PF, Marini E. Body composition variations in ageing. Coll Antropol. 2011;35(1):259-65. Review.
26. Weinheimer EM, Sands LP, Campbell WW. A systematic review of the separate and combined effects of energy restriction and exercise on fat-free mass in middle-aged and older adults: implications for sarcopenic obesity. Nutr Rev. 2010;68(7):375-88. Review.
27. Benton MJ, Whyte MD, Dyal BW. Sarcopenic obesity: strategies for management. Am J Nurs. 2011;111(12):38-44; quiz 45-6.
28. Hunter GR, McCarthy JP, Bamman MM. Effects of resistance training on older adults. Sports Med. 2004;34(5):329-48. Review.
29. Carmo NM, Mendes EL, Brito CJ. Influência da atividade física nas atividades da vida diária de idosas. Rev Bras Cien Env Hum. 2008;5(2):16-23.