Development of Social Media GIS for Information
Exchange between Regions
Syuji YAMADA
Graduate School Student, Graduate School of Information Systems,University of Electro-Communications Tokyo, Japan
Kayoko YAMAMOTO
Associate Professor,Graduate School of Information Systems, University of Electro-Communications
Tokyo, Japan
Abstract—This study aims to develop a social media GIS (Geographic Information Systems) specially tailored to information exchange between regions. The conclusions of this study are summarized in the following three points.(1) Social media GIS is a geographic information system which integratesWeb-GIS, SNS and Twitter into a single system. A social media GIS was conducted for the collection of regional information in the eastern part of Yamanashi Prefecture. The social media GIS uses a design which displays its usefulness in multi-directional information transmission and in easing the limitations of space, time and continuity, making it possible to redesign systems in accordance with target cases.(2) During the operation of the social media GIS for about two months, most of the users were in their20s. Users exchanged regional information using the comment and button functions.(3)The system was evaluated based on the results of a questionnaire to users and an access analysis oflog data during operationin order to identify measures for improvement of the system. Because of users’ high evaluations of its original functions, the overall operability of the system was highly evaluated. Most of the contributed information was only known to local residents, and it was evident that the system fulfilled its intended role.
Keywords—Information Exchange;Web-GIS; Social Media; SNS; Twitter
I. INTRODUCTION
In recent years in Japan, where the formation of a highly information-oriented society is being achieved, the amount of information about urban areas is on the increase, and a diverse range of information can easily be obtained by various means anywhere, anytime.However, in regions outside urban areas, although the amount of information is increasing, compared with urban areas, it can by no means be termed sufficient.Further, it is difficult for people other than those who reside, commute to work, or attend schools in the regions outside urban areas to obtain and utilize detailed regional information.For example, considering the case of tourism in regions outside urban areas, local governments, tourist associations and other organizations use websites to transmit regional information, but this information alone cannot be termed sufficient in either amount or content.Further, other than for famous tourist spots, not much detailed regional information is published in guidebooks or on websites related to tourist information.Therefore, when tourists visit a region for the first time, they often feel inconvenience in regard to obtaining regional information.
Accordingly, in regions outside urban areas, it is necessary
to focus on the importance of “regional knowledge”, which is
information, knowledge and wisdom created when highly
specialized “expert knowledge”, based on scientific knowledge, and “experience-based knowledge”, produced by the experiences of local residents in those regions, are combined, and to utilize this regional knowledge (Science Council of Japan, 2008)[1].However, concerning experience-based knowledge, which is the part of regional knowledge that is possessed by local residents, in many cases the knowledge is possessed by individuals and not communicated to others.Therefore, it is essential to change experience-based
knowledge, which exists as “implicit knowledge”, remaining
untold to others and not visualized, to “explicit knowledge”, which is knowledge in a form that can be accumulated, arranged, utilized, and made available to the public.Further, it is essential for the knowledge to be accumulated and shared among people in the region, and for information to be exchanged with people in other regions.
Meanwhile, in modern Japan, the transition from narrowband (ISDN) to broadband (ADSL, FTTH) has been made, and a stable internet environment has been rapidly provided.Further,Web-GIS, which enables more effective use of geographic information systems (GIS) information provision and sharing functions, is starting to attract attention.In order to provide GIS as systems which many people can use over the long term, combinations withWeb-GIS, which can visualize the actual region on the website and enable editing of information if necessary, and systems which include the distinctive functions of SNS, which allow target users to be narrowed down in advance, can be proposed.Further, the aim of this study is not just accumulation and sharing of regional information, but also exchange of information between regions; therefore, the development of a social media GIS which enables operation together with other social media in addition toWeb-GIS and SNS is necessary.Taking these background factors into account, this study aims to develop a social media GIS which enables accumulation and sharing of regional information and exchange of information between regions, in order to supplement the scarcity of information in regions outside urban areas.
aim of this study were independently conducted. Moreover, two patterns of users aged 18 years and over - those inside and those outside the region targeted for operation – were anticipated, and operation testing and operation of the social media GIS (Section V), as well as evaluation of the system and identification of measures for improvement (Section VI) were conducted. Here, it was anticipated that each user would use the system for approximately one month, and the operation test and evaluation of the operation test were conducted; following that, actual operation was conducted. Further, web questionnaires targeting the users and access analysis using log data were conducted, and based on the results of those, evaluation of the system was conducted, and measures for improvement were identified.
II. RELATED WORKS
Preceding studies concerning regional information which employs GIS and web applications that are in fields related to this study can be broadly divided into three groups: (1) Studies concerning accumulation and sharing of regional information which employ information systems; (2) Studies concerning the design and development of Web-GIS; and (3) Studies concerning regional information contributed to microblogs.
In group (1), Itou et al.(2005)[2], Tsuboi et al.(2008)[3], Nuojua et al.(2008)[4], Shimizu et al.(2008)[5] and Yu et al.(2009)[6] demonstrate the possibility of accumulating and sharing information using GIS for the purposes of regional stimulation and public participation. Umeda et al.(2006)[7], Hara et al.(2008)[8],Kitahara et al. (2009)[9] and Chow et al.(2010)[10] share information using SNS.In group (2), Kirimura et al.(2008)[11], Soga et al.(2008)[12], Nuojua(2010)[13], Hosoya et al.(2011a, 2011b)[14,15]and Kubota et al.(2012)[16] demonstrate the necessity of system design which takes into account convenience, usefulness and operability, and the necessity of effective use ofWeb-GIS suited to their intended themes.Further, Yanagisawa et al.(2012)[17] aims at accumulating and sharing regional information, and Nakahara et al. (2012)[18] aims at supporting communication between users.In these studies, systems which integrateSNS,Web-GISand Wiki were designed and developed, the systems were actually operated in regional communities, and the operations were evaluated.In group (3), through acquisition and analysis of information contributed to Twitter, Fujisaka et al. (2010)[19]and Lee(2012)[20] estimate the extent of the influence of regional events, Fueda et al. (2012)[21] investigate tourist information, and Sagawa et al.(2012)[22]propose a website which assists in providing information about daily life.Further, Lee et al.(2010)[23],Lee et al.(2011)[24] and Hashimoto et al. (2012)[25]detect geo-tagged tweets, and Cheng et al. (2010)[26] and Hiruta et al.(2013)[27] detect “location-triggered” geo-tagged tweets.
Further, in addition to what has been conducted in studies, some regional SNS accumulate and share information using digital maps.A representative example is that the websites
“HYOCOM” of Hyogo Prefecture and “Hamatch!” of
Yokohama City in Kanagawa Prefecture started internet comment maps which employ Google Maps in 2006 and 2007 respectively, and are accumulating and sharing information concerning recommended shops and places that is contributed
by local residents.Further, in 2003, the website
“gorottoyacchiro” of Yatsushiro City in Kumamoto Prefecture
also began accumulating and sharing regional information and information about daily life contributed by local residents on a digital map.However, in these examples from regional SNS, the focus is information contribution and browsing functions, and there are few functions for users, such as functions for photo contribution and publication, and for information exchange between users.Further, there is a problem relating to interface, in that the digital map on the screen of the user is small, so it is difficult to read map information.
In groups (1) and (2) of the above-mentioned preceding studies, the aim of the studies is accumulation and sharing of information, and communication between users.Web-GIS alone or systems developed by integrating web applications such asWeb-GIS, SNS and Wiki into a single system are used.In group (3), study in which Twitter, which is being used as a method for acquiring regional information, is integrated withWeb-GIS or other web applications has not been carried out up to the present.Therefore, compared with the results of the preceding studies listed above, this study is unique in that it accomplishes both relief of user stress and accumulation of information, which tends to be given no importance in microblogs, by enabling the following: the ease of contributing information using microblogs; accumulation and sharing of information within communities and exchange of information between regions, conducted using a self-developed SNS; and function and interface design which takes into account problem areas related to examples of the use of digital maps in regional SNS.Further, the value of this study lies in the fact that after the system was developed, an interview survey which targeted subjects of an operation test was conducted, and detailed system configuration which anticipated the everyday use of local residents was conducted; and following that, in order to verify the effectiveness of the system, the system was actually operated and evaluated in the region for operation.
III. DESIGN OF THE SYSTEM A. Characteristics of the system
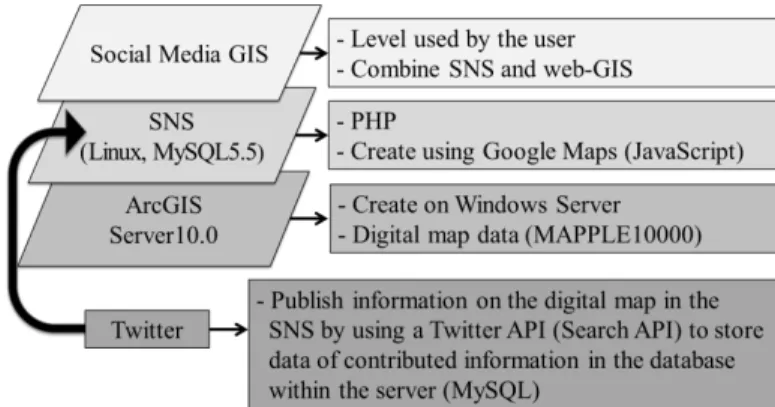
Fig. 1. System design
outdoors.Based on the above, the usefulness of the system, which was outlined in Section II, is described in detail below.
1) Interactivity of information transmission
Many local government websites transmit various types of information relating to administrative services and the region.However, in many cases, one-sided transmission of information from the administrators is the prevailing pattern, and there are few situations where the voices of local residents are reflected.Therefore, in this system, all users possess an account, and thereby each user has responsibility for information transmission, and interactive information transmission is enabled.
Further, because information transmission is conducted using digital maps as a base, knowledge and wisdom possessed only by local residents of the region for operation can be accumulated and shared as contributed information, with location information attached, in addition to photos.Based on this, interactive communication between users inside and outside the operation region can be conducted; therefore, exchange of information between regions is made possible.Accordingly, it can be anticipated that even when users are not residents of the region for operation, acquiring regional information published on the digital map will enable them to make appropriate selections concerning activities when they visit the region for operation.Further, it can be anticipated that accumulation and sharing of regional information between all users will be promoted.
2) Relief of spatial and temporal limitations
As a situation in which these limitations may arise, a situation in which a user is outside and cannot connect to the internet from a computer may be imagined.In order to ease such restrictions, a mashup was performed with a web service which enables use from a portable information terminal as well, and therefore, information contributions can be made from portable information terminals, and the system can be used anytime, regardless of whether the user is indoors or outdoors.In particular, thanks to the mashup with Twitter, in cases where users have made a new discovery or have information they wish to share with other users, because location information is automatically acquired from a GPS via the portable information terminal, simply by tweeting on Twitter, users can contribute regional information to the system
independent of spatial and temporal limitations, without having to check location information themselves.
3) Ease of restrictions concerning continuing operation In order to accomplish long-term maintenance of an environment in which interactive transmission of information unlimited by place and time is enabled by carrying out the steps outlined above in parts (1) and (2), it is necessary to design a system which can manage information which gathers piece by piece.Further, in the case where an open platform is employed, if a structure which can manage contributed information thoroughly does not exist, when inappropriate posts or items of information based on biased evaluations are contributed, it becomes difficult to conduct operation suited to the purpose of the system.Therefore, in this system, continuous operation is enabled by conducting centralized control of contributed information using MySQL, and checking and identifying inappropriate users via account management which employs the SNS.
B. System operating environment
In the design and development of this system, a leading method for web system building called XAMPP was used.Further, in this study, because the burden of processing in theWeb-GIS is very large, the web server and the GIS server were set up separately and split up, in order to speed up processing.Fedora Core 3 from the Fedora Project was used for the web server operating system.The SNS used in this system was developed independently using JavaScript and PHP, and for the database, MySQL 5.5 was used.For the development of the server for theWeb-GIS, Microsoft Corporation’s Windows
Server 2008 and Esri, Inc.’s ArcGIS Server 10.0 were used.For
theWeb-GIS, there are two main types of users; that is, computer users and portable information terminal users.For each type of user, JavaScript receives an action from a user, and following that, it starts applications.In the browser compatibility test, the Spoon web service was used.
Further, recent portable information terminals are shifting from a style such as that of traditional portable phones, in which websites developed especially for portable terminals are browsed, to a style such as that of smart phones, in which websites edited especially for computers can also be browsed.When operating a system which handles digital maps, if the portable information terminal used has a touch panel, it is easier to perform pointing operations on the map than it is when limited operations such as those of arrow keys are used.Further, the larger the screen on which the digital map is depicted, the easier it is to view the digital map.In addition, Impress R&D (2012)[28] pointed out that about 40% of internet users aged thirteen years and over were smart phone users in 2012 in Japan, and if that trend continues, it is possible that in 2014 the majority will be smart phone users.Impress R&D also indicated that smart phone use is becoming widespread among people of middle age and advanced age as well.Taking the above-mentioned factors into consideration, this study focuses on both conventional mobile phones and smart phones as portable information terminals.
C. Outline of system design
specialized for the purpose of this study, which is exchange of information between regions based on accumulation and sharing of regional information, a social media GIS can be suitably operated in the region intended for operation.
1) Web-GIS
In this study, for theWeb-GIS, Esri, Inc.’s ArcGIS Server 10.0 was used, and for theWeb-GIS digital map data, the
SHAPE version (Rel.8) of Shobunsha Publications, Inc.’s
MAPPLE10000, which is part of their MAPPLE digital map data and includes detailed road system data, was used.As the map that was combined with this map data, the user interface(UI) of Google Maps was used.Among the options provided by Esri, Inc. that are ArcGIS Server 10.0 API targets, the Google Maps UI was the one used the most in preceding studies in fields related to this study.Concerning the combination of MAPPLE10000 (SHAPE version) and Google Maps, Google Maps uses the new geodetic system coordinates, while MAPPLE10000 conforms to the former geodetic system coordinates; therefore, ArcTKY2JGD, which is provided by Esri, Inc. as product support, was used to convert the MAPPLE10000 geodetic system coordinates to the new ones.Furthermore, editing was performed such that information peculiar to each location could be added using ArcMap 10.0.By using theWeb-GIS, users can refer to detailed road systems which also include minor roads output from MAPPLE10000, and thereby can accurately check the location related to information contributed.
2) SNS
In this system, it was desirable that exchange of information between regions should be conducted voluntarily by many users; therefore, community features were not provided.Further, user personal data registration/profile publication, contribution and browsing of information and photographs, methods for exchanging information between regions, functions relating to classifying the importance of contributed information and so forth were designed independently to suit the aim of this study.
Concerning a method for exchanging information between regions, the system was designed such that text information and a digital map were within the same page, in order to enable efficient digital map-based exchange of information between users.Further, in this study, when there has been some sort of exchange between users inside and outside the region for operation, an exchange of information between regions is said to have been conducted.Specifically, in the case where a user outside the region for operation posts a comment in response to information that a user inside the region for operation has contributed, and the case where a button for classifying the importance of contributed information is clicked, it is considered that an exchange of information has been conducted.Further, the number of times that users inside and outside the region for operation click the button for classifying the importance of contributed information is converted into points, and used in the points ranking of contributed information.
3) Twitter
In this study, in order to realize long-term operation by preventing a decrease in the number of active users, and to
design the system such that users inside and outside the region for operation could light-heartedly contribute information anytime using a portable information terminal, regardless of whether they were indoors or outdoors, Twitter was selected from among the different types of social media, and a mashup was performed with a self-developed SNS.Of the various types of social media, Twitter allows the easiest contribution of information, and many tweets per day can be anticipated; therefore, Twitter is indispensable to long-term operation.Further, as mentioned in Section III-B, in this study, taking into consideration the present situation, which is that smart phones are moving out of their introductory period and into their transition period, a system which can be used from both conventional portable phones and smart phones was developed.In order to do this, rather than separately developing one information contribution system for conventional portable phones and another for smart phones, the system was designed such that a mashup with the self-made SNS and Twitter was performed, so Twitter could be used from both the two types of portable information terminals.
IV. SYSTEM DEVELOPMENT A. System front end
In this study, multiple functions have been designed independently as described below, and users can select methods suited to their preferences for each situation; therefore, it can be anticipated that accumulation and sharing of information and exchange of information between regions will be stimulated.
1) Functions for users
a)Personal data registration/profile publication functions
The first time a user makes access to the system, they use the initial registration screen to register personal data such as
their “User ID”, “Password”, “Age group”, “Sex”, “Region” and “Greeting”.This is because it is desirable that the system
should be designed such that when users conduct interactive communication with each other, they can be identified to a certain extent.Further, because users who do not wish to make their personal data public have been taken into consideration,
the “User ID” is designed such that the user’s real name and
account name are not specified, and the user can freely select and enter a user ID.Further, when a user logs in after performing the initial registration, they can perform operations on the browsing/information contribution screens and so forth.
b)Information contribution/browsing functions
Two types of methods were provided for when a user contributes regional information – the method of contributing information from a computer, and the method of contributing information from a portable information terminal using
Twitter.In the former method, first, the user clicks “Post” on
the home page of the website on their computer screen, to go to the posting page.On the posting page there is a form in which
the user can enter the “Title” and “Main text”.After the user
has entered the content into the form, location information relating to the posted content can be added simply by clicking the posting location on the digital map.The “location
performed, posting is complete.In the latter method, data of information posted using Twitter from a portable information terminal is acquired, and displayed on the digital map on the posting page of the user which is set up in the system.In both methods, at the time of posting, if necessary, a photo image file can also be attached.All contributed information is shared within the SNS.From the home page, the following three sections can be browsed: The ten most recently contributed items of information, a list of contributed information, and the points ranking of contributed information.
Further, contributed information can also be viewed by
clicking “View” on the home page.On the viewing page,
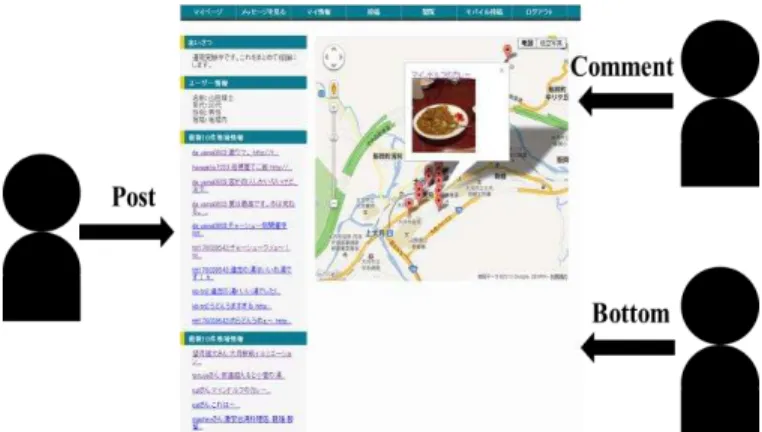
information shared on the digital map is displayed as a marker.When the marker is clicked, a balloon is displayed, and a more detailed page is moved to.Further, as shown in Fig. 2, a comment function and a mention-later button function can be used.
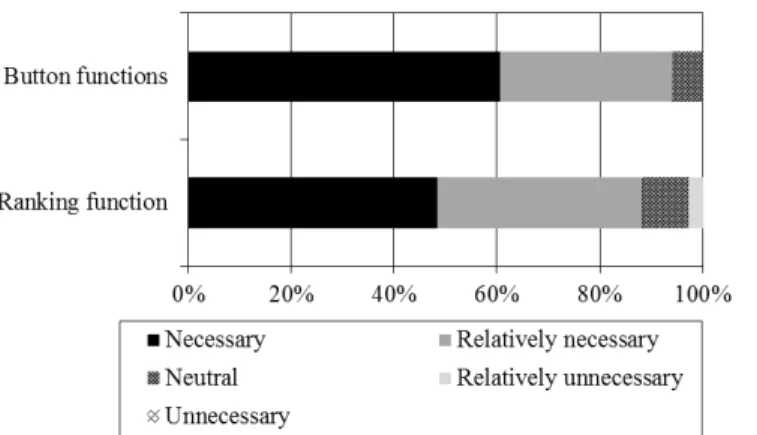
c)Button functions/ranking function
Button functions are used for classifying the importance of contributed information. Two types of buttons were provided -
“I didn’t know” for users within the region of operation, and “I
want to go there” for users outside the region of operation. Thus, the provision of button functions in this system enables users to easily express their intention in regard to information they have viewed. In this study, when a user outside the region of operation uses the above-mentioned comment function and
the “I want to go there” button function in response to
information posted by a user in the region of operation, it is defined as an exchange of information between regions. Further, for each item of contributed information, one point is added each time users inside and outside the region of operation click either of the two above-mentioned buttons, and each piece of contributed information is evaluated. Moreover, by including a ranking function which displays contributed information in descending order of total points gained, the system avoids losing contributed information which users are strongly interested in amongst other information.
Fig. 2. Exchange of information between regions which employs functions for users
2) Functions for administrators
Administrators log in from a login page exclusively for administrators, and a screen exclusively for administrators is provided.Using the administrator screen, administrators manage users, and in cases where there has been an inappropriate statement or inappropriate behavior, they manage the matter by taking action, such as closing user accounts.Further, administrators can view all contributed information, contributor names, and dates and times of contributions on a screen which lists them; therefore, if by any chance an appropriate posting is made, they can delete it with just one click. Thanks to these aspects of the system, the burden of administrators can be reduced, because there is no need for them to search to check whether there are inappropriate items of contributed information in the system. Further, the case where local residents actually perform the role of administrators in the regional community is anticipated. The system is designed such that MySQL is managed using graphical user interface (GUI) and administrators who do not have a very high level of IT literacy can also manage and administer; therefore, the burden on administrators can be reduced as much as possible.
B. System back end
1) Management system for contributed information that is run by administrators
Information, photos image files, comments and so forth contributed by all the users are all stored in the database of the system as data.Further, administrators can view these items of contributed information on a screen which lists them, so if by any chance an inappropriate contribution is made, it can easily be deleted.
2) Mashup system with Twitter
In this study, when a mashup is performed with Twitter, the Search API with Basic authentication protocol is used, and thereby the effort involved in information contribution is minimized and user stress is reduced.Conventionally, when a Twitter mashup system is developed, the OAuth authentication protocol is often used.However, in this study, upload from the main part of the system to Twitter of information for contribution and so forth is not conducted; therefore, the Search API with Basic authentication protocol, which allows acquisition by searching Twitter data, was employed.
The data for reflection in the system (main text, location information, account names, dates and times) is obtained by making a query specification.In the process for acquiring data of information contributed using Twitter from a portable information terminal, users simply register a Twitter account name in the blank at the time of initial registration.The rest is performed by the back end.Data of information contributed using Twitter of registered users is obtained by applying all
account names saved in the database to the “user” portion of “from:<user>” of tags.
C. System interface
administrator.Using the administrator screen, inappropriate contributed
Fig. 3. Illustration of user computer screen and functions
TABLE I. OPERATION PROCESS FOR THE SYSTEM
Process Aim Period Specific description
1. Survey of present situation
To fully understand efforts concerning the accumulation and sharing of regional information in Otsuki City and Tsuru City
December 2011 to March 2012
- Survey of administrative measures and internet services
- Interview targeting municipal employees and officials of residents’ councils
2. System construction
To construct the system in detail to suit the region for operation
March to August 2012 - Define system requirements
- Construct system
- Developoperation system 3. Operation test To conduct an operation test of the
system
July 2012 - Creation and distribution of pamphlets and instructions for use
- System operation test 4.Operation test
evaluation
To reconstruct the system based on the results of interview of those who participated in the operation test
August to September
2012 - Evaluation through interview - System reconstruction
- Revision of pamphlets and instructions for use 5. Operation Conduct actual operation of the
system
November to December
2012 - Appeal for use of the system
- Distribution of pamphlets and instructions for use
- System operation management 6. Operation
evaluation
Evaluate the system based on the results of surveys by questionnaire and access analysis
December 2012 - Evaluation using web questionnaires and access analysis
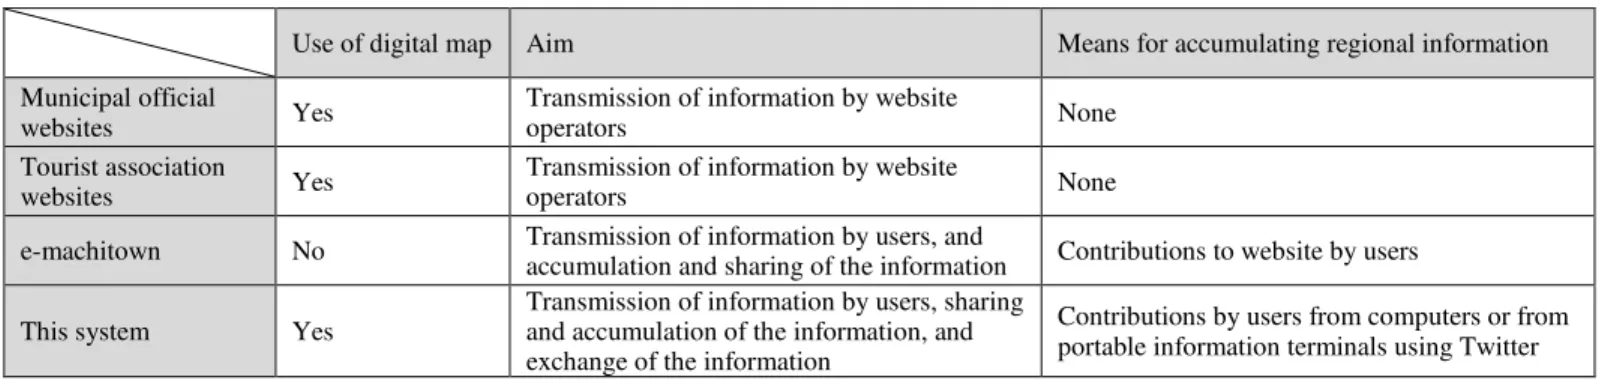
TABLE II. COMPARISON OF CHARACTERISTICS OF EXISTING WEB SERVICES IN THE REGION FOR OPERATION WITH CHARACTERISTICS OF THE SYSTEM OF THIS
STUDY
Use of digital map Aim Means for accumulating regional information
Municipal official
websites Yes
Transmission of information by website
operators None
Tourist association
websites Yes
Transmission of information by website
operators None
e-machitown No Transmission of information by users, and
accumulation and sharing of the information Contributions to website by users
This system Yes
Transmission of information by users, sharing and accumulation of the information, and exchange of the information
Contributions by users from computers or from portable information terminals using Twitter
information can be promptly deleted, and any user can also make an amendment using either of the two types of user screen, by making a comment in response to erroneous contributed information. Thus, this system has been developed keeping in mind the goals of reducing administrator burden as much as possible and developing a system which regular local residents in regional communities can also operate and manage.
V. OPERATION TEST AND OPERATION
According to the operation process in TABLEI, after the operation test and evaluation of the operation test of the social media GIS designed and developed in this study were conducted, actual operation was conducted.
A. Selection of the region for operation and anticipated users The eastern part of Yamanashi Prefecture (Otsuki City andTsuru City) was selected as the region for operation of the system.This region adjoins the Tama region of the Tokyo Metropolis, and is dotted with tourist spots; therefore, it has many visitors from neighboring prefectures such as the Tokyo Metropolis.However, it has few web services which accumulate regional information.In order to examine the role and usefulness of the system in the region for operation, TABLEII compares the characteristics of three types of web service in the region for operation with characteristics of the system of this study.Even in cases where municipal and tourist association official websites use digital maps, the former are limited to just introducing facilities related to everyday life, various public facilities, and so forth, and the latter are limited to just presenting location information concerning tourist spots.The aim of both types of website is one-sided transmission of information by the operators; therefore, their aim differs from that of the system.Further, part of the aim of the website e-machitown is similar to the aim of the system; however, digital maps are not used in e-machitown.Based on the above, in terms of the fact that the system is oriented to transmission of information by users, and further, enables exchange of information between regions based on the accumulation and sharing of information, the roles of the system and existing web services in the region for operation can mutually complement each other.Further, the system demonstrates even more usefulness, in that since it is based on a digital map, it can provide a means for people inside and
outside the region for operation to exchange information that relates more closely to the region.
Two types of user were anticipated as users in this study - users inside the region for operation, and users outside the region for operation.Users inside the region for operation use the system as a tool for accumulating and sharing information inside the region, and exchanging information with people outside the region for operation.Further, users outside the region for operation are mainly residents of the Tokyo Metropolis, and use the system as a tool for gathering information concerning the region for operation, and exchanging information with people inside the region for operation.
B. Operation test and operation test evaluation
As participants in the operation test, six people aged 18 years or older residing in the eastern part of Yamanashi Prefecture and two people aged 18 years or older residing in the Tama region of the Tokyo Metropolis were selected.The operation test was conducted for one week.It was observed that exchanges of information between regions were conducted during the operation test.In the interview held after the operation test, the following two areas for improvement were identified, so redevelopment of the system was carried out in regards to these two areas only.
1) Contributed information list pages and ranking pages were added so that the contributed information could be viewed on the pages other than the digital map page.
2) In the case where contributed information centers on information closely related to the everyday lives of local residents, and there are no contributions of information that is necessary to visitors from outside the region for operation, such as information concerning tourist information centers and transportation facilities, it is possible that the usefulness of the system will decrease.Therefore, with reference to official municipal and tourist association websites, regional information for visitors from outside the region for operation was inserted onto the digital map in advance.
on the model of portable information terminal used, errors sometimes occur in the location information.Therefore, in this study, the use of twicca was recommended in both the operation test and the actual operation.Concerning twicca, after location information has been received from a GPS, it can be freely edited on the digital map; therefore, it is possible for the user to amend errors themselves.Further, even in the case where the information cannot be contributed immediately, if the user remembers the related location, they can add location information and contribute information afterwards.
C. Operation
In the eastern part of Yamanashi Prefecture, the region for operation, the motor vehicle is the main means for moving from place to place.Therefore, in the actual operation, those
aged eighteen years and over, who are able to obtain a driver’s
license, were encouraged to use the system.TABLEIII is a breakdown of users during the operation period, which was approximately two months long.There were 20 users inside and 25 users outside the region for operation, giving a ratio of 4:5.Further, approximately 93% of users were university students or postgraduate students in their 20s; due to the nature of this system, the majority of users were of a generation that is considered proficient in the use of computers and portable information terminals.Further, users outside the region for operation were residents, workers or students in the Tama region of the Tokyo Metropolis.
Using the system, regional information can be contributed and viewed using various patterns from both computers and portable information terminals regardless of place andtime, and users outside the region for operation can make exchanges of information between regions using multiple methods, concerning information contributed by users inside the region for operation.Thus, encouraging use of the system suited to the everyday lives and preferences of each user enabled the effects of the system to be demonstrated to the fullest.
VI. OPERATION EVALUATION AND IDENTIFICATION OF MEASURES FOR IMPROVEMENT
In accordance with the operation process in TABLE I, the system was evaluated using the results of the questionnaire to the users described in the outline in TABLE III. Further, using analysis of access which employedlog data, exchange of information between regions, which was theaim of the system, was evaluated. Moreover, based on the results of the two evaluations, measures for improvement of the system were identified. As mentioned in Section V-C, due to the nature of the system, approximately 93% of the users were in their 20s, and the evaluation results are not based on users from a variety of generations; in this respect, the evaluation results lack generality to some degree.
TABLE III. OUTLINE OF USERS AND QUESTIONNAIRE RESPONDENTS
Male Female Total Questionnaire respondents Inside the region
for operation (Number of people)
12 8 20 18
Outside the region for operation (Number of people)
21 4 25 15
Total
(Number of people) 33 12 45 33
Percentage (%) 73.3 26.7 - 73.3
A. Evaluation of use of the system
1) Evaluation of operability of the system
In order to operate the system over the long term, operability is important; therefore, as shown in Fig. 4, the operability of the system was evaluated.Concerning operationof the system, the percentage of respondents who
answered “Easy” or “Fairly easy” was very high, at
approximately 97%, a result which demonstrates the high level of operability of the system.This result is due to the fact that the design of the system was standardized with the design used in common SNS, and the fact that the system was designed such that it was easy to visually browse information, because rather than arranging a lot of information on one screen, contributed information was displayed on the digital map.
Concerning the operation of contributing from a portable information terminal using Twitter, a function that existing regional SNS do not have, evaluation responses diverged somewhat, with approximately 67% of respondents answering
“Easy” or “Fairly easy”, and approximately 27% answering “Average”.Concerning this, the results reflect the fact that although the majority of users of the system were in their 20s and therefore considered to be proficient in using portable information terminals, some use Twitter routinely, while some do not.However in the section of the questionnaire where respondents could write their opinions freely, multiple responses mentioned that it was convenient that when users from outside the region for operation visited the region for operation, even if they did not have a grasp of the region geographically, a portable information terminal could be used to obtain location information from a GPS and contribute information using Twitter.Therefore, it can be said that for users who use Twitter routinely, Twitter was an effective means of contributing information to the system.
2) Evaluation of functions unique to the system
The button functions and the ranking function for evaluating contributed information which were described in Section IV-A were included in the system as unique features.Fig. 5 shows the results of evaluation of these unique functions of the system.For both functions, the percentage of
high evaluation of the overall operability of the system mentioned above.
3) Frequency of use of the system
Fig. 6 compares the frequency of everyday internet use as a means of obtaining regional information to the frequency of use of the system as a means of obtaining regional information during the operation period.For the former, approximately 70%
of respondents answered “Hardly used it at all” or “Did not use it”; however, for the latter, approximately 30% of respondents answered “Several times a week” and approximately 49%
answered “Several times a month”, so it is clear that the system
was used more frequently than the internet as a means of obtaining regional information.The evaluation was based on a limited operation period of approximately two months, and the reasons why the system was used in the manner described above are that during the operation period users mutually
acknowledged each other and became interested in each other’s
contributed information, and that particularly for users inside the region for operation, information contributed to the system
was more closely related to local residents’ everyday lives and
easier to take an interest in, compared to information on official municipal and tourist association websites.
4) Effects of use of the system
A high percentage of users inside the region for operation,
approximately 80%, responded “I think so” or “I tend to think so” when asked whether viewing contributed information
caused them to want to visit the place related to that information.Further, there were many cases where users employed the comment function to report actually visiting places which were the subject of contributed information, or to ask questions regarding a place indicated by contributed information.Meanwhile, among users outside the region for operation, the percentage who answered “I think so” or “I tend
to think so” when asked whether viewing contributed
information had provoked their interest in the region for operation was very high, at approximately 94%.There were cases where users outside the region for operation used the comment function to ask users inside the region for operation questions regarding details of information contributed.
B. Evaluation of exchange of information between regions 1) Outline of access analysis
In this study, log data collected during the operation period was used to perform access analysis.Thereby, inspection of whether or not information was exchanged between regions was performed, and as well, trends regarding the content of contributed information and users who made many contributions were clarified.This led to improvement of usability of the system and an increase in the access count.A Google Analytics API was included in the program developed in this study, and used to conduct access analysis.Google Analytics is free application software provided by Google, and is widely used as a tool for analyzing log data of websites.Google Analytics can be used just by writing the API
in the program of the homepage of a website, and enables acquisition of users’ access log.
2) Access analysis results
TABLE IV shows the access analysis results, and TABLE V shows the results for classification of contributed information. From TABLE IV it can be seen that the access count from computers to the system of this study accounts for about 88% of the total access count, and the average number of page views and the average time spent viewing was as much as approximately twice the averages for access from portable information terminals, so it is clear that users mainly used the system via computers. However, in contrast to the fact that the access count from portable information terminals to the system was only about 12% of the total, the contribution count fromportable information terminals using Twitter was about 41%, only about 18% less than the contribution count fromcomputers. This difference is less than that of the difference between access counts for portable information terminals and computers. Based on this, it can be surmised that users felt little stress when contributing information from portableinformation terminals using Twitter, and therefore, although the access count from portable information terminals was low, the contribution count was high.Therefore, it can be said that the ease of contributing information using Twitter and the usefulness of having mashed up Twitter with the system were demonstrated.
Fig. 4. Evaluation of the operability of the system (%)
Fig. 6. Comparison of the frequency of using the internet to obtain regional information with the frequency of using the system to obtain regional information during the operation period (%)
TABLE IV. ACCESS ANALYSIS RESULTS
Access count Average number of page views Average time spent viewing
Access from computers 338 (88.3%) 6.32 7 minutes, 34 seconds
Access from portable information terminals 45 (11.7%) 3.29 3 minutes, 36 seconds
Total access count 383 7.97 5 minutes, 5 seconds
TABLE V. RESULTS OF CLASSIFICATION OF CONTRIBUTED INFORMATION
Classification of contributed information Places to eat and drink Scenery Other Total
Number of contributions from computers (%) 15 (17.6) 25 (29.4) 10 (11.8) 50 (58.8) Number of contributions from portable information terminals
using Twitter (%) 20 (23.5) 7 (8.3) 8 (9.4) 35 (41.2)
Total number of contributions (%) 35 (41.1) 32 (37.7) 18 (21.2) 85 (100.0)
Moreover, as TABLE V shows, of the contributed information, about 41% concerned places to eat and drink, about 38% concerned scenery, and the remaining approximately 11% concerned various public facilities such as city halls and hospitals, and was information that is also published on official municipal websites. Investigating the content of each item of information contributed to the system in further detail, the information concerning places to eat and drink and scenery in particular noted small changes in central parts and in business patterns of places to eat and drink, and beautiful scenery in mountainous regions distant from urban districtsrespectively. Thus, it is clear that users within the region for operation contributed information that only local residents knew.
Further, the results of the evaluation of information contributed using button functions shows that the total number of points concerning all contributed information was 182 points, which is an average of 4.1 clicks per user.The breakdown is 150 points contributed using computers and 32 points contributed using portable information terminals, so there was a clear difference in the number of times button functions were used from computers and from portable information terminals.A cause of this is that photos were attached to the majority of information contributed from computers; therefore, it was easier to view the photos when using a computer, and the state of things related to contributed
information, such as places to eat and drink and scenery, was conveyed to users in a more visual way.Further, it became clear that in the case of information contributed from portable information terminals using Twitter, a photo could not be viewed unless the user accessed the link, and therefore the button functions were not used as much as they were in the case of information contributed from computers.
3) Evaluation of exchange of information between regions, based on access analysis results
The case where the comment function was used as a means of exchanging information between regions occurred twelve times. An example of this kind of information exchange is exchanges of comments between users within and outside the region for operation in which users outside the region for operation who viewed photos attached to contributed information posted comments saying that they had actually visited the places after viewing them in the photos, and added new related information.Such exchanges took place several times.Similarly, the breakdown for cases where the button
functions were used is that the “I didn’t know” button function
was used 145 times (116 times from computers and 29 times from portable information terminals), and the “I want to go
there” button function was used 37 times (34 times from
button functions was significantly greater from computers.However, it was confirmed that exchanges of information in which users outside the region for operation took interest in information contributed by users within the region for operation and used the“I want to go there” button function took place.Based on the above, it can be said that the system of this study functioned in accordance with its aims; as indicated in the previous section, the majority of information contributed was information known only to local residents of the region for operation; and the system fulfilled its purposes of changing the experience-based knowledge of local residents from implicit knowledge to explicit knowledge, accumulating and sharing the knowledge between people within the region,and exchanging the information with people from other regions.
C. Identification of measures for improvement
Based on the results of the questionnaires given to the users and the access analysis, measures for improvement of this system can be summarized into the following two areas:
1) Information classification and notification
Include a form which allows selection of categories showing interests and preferencesof users at the time of initial registration, and have users select categories.Similarly, when users contribute information, having them select categories in the manner described above would enable viewing of contributed information divided by categories.Further, the convenience of the system can be improved by including a contributed information notification function which notifies a user when information in a category of interest to the user has been contributed, or when there has been a comment in response to information contributed by the user.
2) Optimization of interface for smart phones
Since there were many contributions to the system from portable information terminals, the usefulness of the system can be improved by optimizing the interface for smart phones, which are becoming popular across a wide range of ages, so that the system can easily be used from smart phones when users are outdoors and cannot use a computer - for example, when they have gone out of the home or office for a while.
VII. CONCLUSIONS AND FUTURE SCOPES
The conclusions of this study can be summarized into the following three areas:
1) Three web applications, that is, aWeb-GIS, an SNS, and Twitter, were integrated, and a social media GIS which enabled exchange of information between regions was designed and developed.The usefulness of the social media GIS was demonstrated in the three areas of interactivity of information transmission,easing of spatial and temporal limitations, and easing of limitations concerning continuing operation.Further, the eastern part of Yamanashi Prefecture was selected as the region for operation of the system, a survey of the existing situation was conducted, and then the system was developed in detail.Further, prior to actual operation being conducted, an operation test and an evaluation of the operation
test were conducted, areas for improvement were identified, and the system was redeveloped.
2) Actual operation was conducted over approximately two months, with users aged eighteen or over from both inside and outside the region for operation, and due to the nature of the system, approximately 93% of the forty-five users were in their 20s.During the operation period information was contributed and viewed from both computers and portable information terminals, and exchanges of information between regions, in which the comment function and button functions were used in relation to contributed information, were conducted.
3) The system was evaluated based on the results of questionnaires given to the users and access analysis of log data.The questionnaire results showed the high level of operability of the system, the high frequency of use of the system during the operation period, and the large extent of the effects of use of the system, and it was clear that the high evaluation of the unique functions of the system also contributed to the high evaluation of the operability of the system.The access analysis results showed that while the access count from portable information terminals was no more than about 12%, the contribution count from portable information terminals was about 41%, accounting for slightly less than half of the total contribution count.Further, the results revealed that the majority of contributed information was information known only to local residents of the region for operation, and the system performed a role which was in accordance with its aims.
Future works are to add functions which support the measures for improvement identified in the previous section to the system, to design and develop a system such that people from various age groups can use it, and to operate and evaluate that system.A further future research task is to increase the usage track record of the system by operating it in other regions as well, and further increase the significance of usage of the social media GIS developed in this study.
ACKNOWLEDGMENT
In the operation of the social media GIS and the questionnaires of this study, enormous cooperation was received from those in the eastern region of Yamanashi Prefecture and the Tama region of the Tokyo Metropolis. We would like to take this opportunity to gratefully acknowledge them.
REFERENCES
[1] Science Council of Japan:Regional Research Committee,“Toward to accumulate and applicate regional knowledge”, Tokyo, 2008.
[2] H. Itou, andK. Fukuyama,“A buisness-academia collaboration for regional developments on the basis of GIS”, Papers and Proceedings of the Geographic Information Systems Association of Japan,Vol.14, pp.551-554, 2005.
[3] S. Tsuboi, T. Sakai and S. Goto, “Research on the local rivitalization by application of GIS and its related factor -A case study of Kumagaya-uchiwa festival-.”,Gobal Environmental Studies,Vol.10, pp.41-47, 2008. [4] J. Nuojua and K. Kuutti, “Communication based web mapping: A new
Proceedings of the 12th International Conference on Entertainment and Media in the Ubiquitous Era, pp.136-140, 2008.
[5] Y. Shimizu, A. Kodama, A. Watanabe and R. Miyake, “A studyon sharing of reginal information as tacit knowledge in high-density commercial area: A trial of reginal informatization by demonstration mobile experiment in Akihabara”, Journal of Architecture and Planning, Vol.73, No.632, pp.2275-2280, 2008.
[6] B. Yu and G. Cai, “Facilitating participatory decision-making in local communities through map-based online discussion”, Proceedings of the Fourth International Conference on Communities and Technologies, pp.215-224, 2009.
[7] T. Umeta and M. Tomisawa, “Regional-oriented social network service”, Information Processing Society of Japan, Information Systems and the Social Environment -Research Reports,Vol.27, pp.69-76, 2006. [8] Y. Hara, Y. Inaba, Y. Yoshiyuk, Natsuki, S. Motoseko and W. Yan,
“Support for machizukuri on local collaboration and maintenance of local information by residential workshop”, Papers and Proceedings of the Geographic Information Systems Association of Japan,Vol.17, pp.497-500, 2008.
[9] K. Kitahara, H. Kanai, S. Urushibara and S. Kunifuji, “Communication-support system based on shared cooking ingredients for people living nearby”, Information Processing Society of Japan -Research Reports, GN:Groupware and Network Services, Vol.33, pp.13-18, 2009. [10] C. Y. Chow, J. Bao and M. F. Mokbel, “Towards location-based social
networking services”, Proceedings of the 2nd ACM SIGSPATIAL International Workshop on Location Based Social Networks, pp.31-38, 2010.
[11] T. Kirimura, K. Matsuoka andK. Yano, “Monitoring system of modern arcitectures and industrial heritages in Kyoto city usingWeb-GIS”, Papers and Proceedings of the Geographic Information Systems Association of Japan, Vol.17, pp.193-198, 2008.
[12] K. Soga, H. Fukada, H. Ichikawa and A. Abe, “Proposal of regional SNS cooperation map considering user behavior support”, Papers and Proceedings of the 70th Annual Conference of the Information Processing Society of Japan,pp.393-394, 2008.
[13] J. Nuojua, “Web map media: A map-based web application for facilitating participation in spatial planning”, Multimedia Systems, Vol.16, No.1, pp.3-21, 2010.
[14] N. Hosoya and K. Yamamoto, “Web-GIS based outdoor education program for elementaryschools”, Journal of Scio-Informatics, Vol.4, No.1, pp.49-62, 2011a.
[15] N. Hosoya and K. Yamamoto, “Web-GIS based outdoor education program for junior high schools”, World Academy of Science, Engineering and Technology, Vol.60, pp.316-322, 2011b.
[16] S. Kubota, K. Soga, Y. Sasaki, T. Miura, H.Takisawa, S.Takashi and A. Abe, “Development and operational evaluation of regional social
networking service as public participation GIS”, Theory and Applications of GIS,Vol.20, No.2, pp.125-136, 2012.
[17] T. Yanagisawa and K. Yamamoto, “A study on information sharing GIS to accumulate local knowledge in local communities”,Theory and Applications of GIS, Vol.20, No.2, pp.61-70, 2012.
[18] H.Nakahara, T. Yanagisawa andK. Yamamoto, “Study on aWeb-GIS to support the communication of regional knowledge in regional communities : Focusing on regional residents' experiential knowledge”,Socio-Informatices, Vol.1, No.2, pp.77-92,2012.
[19] T. Fujisaka, R. Lee, and K. Sumiya, “Estimating influence regions of social events by geo-tagged micro-blogs analysis”, Institute of Electronics, Information and Communication Engineers, Proceedings of theSecond Forum on Data Engineering and Information Management, D7-4, 2010.
[20] C. H. Lee, “Mining spatio-temporal information on microblogging streams using a density-based online clustering method”, Expert Systems with Applications, Vol.39, No.10, pp.9623-9641, 2012. [21] K. Fueda, andY. Kameda, “Search of the sightseeing information using
Twitter”, Papers of the Conference of the Japanese Society of Computational Statistics, No.26, pp. 67-70, 2012.
[22] K. Sagawa, A. Hattori and H. Hayami, “An on-line map system for life Information at the time of the disaster”, Information Processing Society of Japan -Research Reports, GN:Groupware and Network Services, Vol.83, No.8, pp.1-7, 2012.
[23] R. Lee and K. Sumiya, “Measuring geographical regularities of crowd behaviors for Twitter-based geo-social event detection”, Proceedings of the 2nd ACM SIGSPATIAL International Workshop on Location Based Social Networks, pp.1-0, 2010.
[24] R. Lee, S. Wakayama and K. Sumiya, “Discovery of unusual regional social activities using geo-tagged microblogs”, World Wide Web, Vo.14, No.4, pp.321-349, 2011.
[25] Y. Hashimoto and M. Oka, “Statistics of geo-tagged tweets in urban area”, Journal of the Japanese Society for Artificial Intelligence, Vol. 27, No.4, pp.424-431, 2012.
[26] Z. Cheng, J. Caverlee and K. Lee, “You are where you tweet: A content-based approach to geo-locating twitter users”, Proceedings of the 19th ACM International Conference on Information and Knowledge Management, pp.759-768, 2010.
[27] S. Hiruta, T. Yonezawa and H. Tokuda, “Detection and visualization of place-triggered geotagged tweets”, Journal of the Information Processing Society of Japan, Vol.54, No.2, pp.710-720, 2013.