The Effect of FRAX on the Prediction of Osteoporotic
Fractures in Urban Middle-aged and Elderly Healthy
Chinese Adults
Jun Wang,IXuejun Wang,IIZhen Fang,IINanjia Lu,III Liyuan HanIII,*
IDirector
’s Office, Minglou Street Community Health Service Center, Jiangdong District, Ningbo, China.IIDirector
’s Office, Dongliu Street Community Health Service Center, Jiangdong District, Ningbo, China.IIIDepartment of Preventive Medicine, Zhejiang Provincial Key Laboratory of Pathophysiology, School of Medicine, Ningbo University, Ningbo, China.
OBJECTIVE: We aimed to analyze the applicability of a fracture risk assessment tool for the prediction of osteoporotic fractures in middle-aged and elderly healthy Chinese adults.
METHODS:A standard questionnaire was administered, and bone mineral density was measured in residents visiting the Dongliu Street Community Health Service Center. Paired t-tests were used to compare the FRAX-based probabilities of fractures estimated with and without consideration of bone mineral density. Risk stratification and partial correlation analyses were applied to analyze the associations between FRAX-based probabilities and body mass index or bone mineral density at different sites.
RESULTS:A total of 444 subjects were included in this study. Of these subjects, 175 (39.59%) were diagnosed as osteoporotic, and 208 (47.06%) were diagnosed as osteopenic. The Kappa value for the detection of osteoporosis at the L1-L4 lumbar spine and femoral neck was 0.314. The FRAX-based 10-year major osteoporotic fracture probability and hip osteoporotic fracture probability estimated without considering bone mineral density were 4.93% and 1.64%, respectively; when estimated while considering bone mineral density, these probabilities were 4.97% and 1.54%, respectively. A significant positive association was observed between the FRAX-based fracture probabilities estimated with and without consideration of bone mineral density, while significant negative associations between body mass index and the estimated FRAX-based fracture probabilities after adjustment for age and the estimated FRAX-based fracture probabilities and femoral neck bone mineral density were identified. These results remained the same after controlling for lumbar spine bone mineral density.
CONCLUSIONS:The Chinese FRAX model could predict osteoporotic fracture risk regardless of whether bone mineral density was considered and was especially appropriate for predicting osteoporotic fractures of the femoral neck.
KEYWORDS: FRAX; Osteoporotic Fracture; Bone Mineral Density.
Wang J, Wang X, Fang Z, Lu N, Han L. The Effect of FRAX on the Prediction of Osteoporotic Fractures in Urban Middle-aged and Elderly Healthy Chinese Adults. Clinics. 2017;72(5):289-293
Received for publication onOctober 8, 2016;First review completed onFebruary 9, 2017;Accepted for publication onFebruary 24, 2017
*Corresponding author. E-mail: [email protected]
’ INTRODUCTION
Osteoporotic fractures are important causes of morbidity and place a heavy burden on China’s healthcare system (1). Bone mineral density (BMD), as detected by dual-energy X-ray absorptiometry (DXA), is an accepted diagnostic index for osteoporosis; however, DXA is very expensive and has not been widely applied in primary health care settings in
China. A fracture risk assessment tool (FRAX) has been deve-loped by the World Health Organization (WHO) (2). By considering age, gender, BMD, body mass index (BMI), and other easily obtainable risk factors, the FRAX model can assess a patient’s 10-year major osteoporotic fracture ability (MOFP) and 10-year hip osteoporotic fracture prob-ability (HOFP) (2). FRAX has been successfully used in the UK (3), the USA(4) and Poland (5). A French study found that the estimated FRAX-based 10-year osteoporotic fracture probability was lower than the actual observed fracture rate in women with low BMD who were over 65 years of age (6); similar results were also observed in a prospective cohort study performed in Spain (7).
Due to contextual differences between countries, the FRAX model should be calibrated based on each country’s own epi-demiologic data (8,9). The thresholds for therapeutic intervention
DOI:10.6061/clinics/2017(05)06
Copyright&2017CLINICS–This is an Open Access article distributed under the terms of the Creative Commons License (http://creativecommons.org/licenses/by/ 4.0/) which permits unrestricted use, distribution, and reproduction in any medium or format, provided the original work is properly cited.
in postmenopausal women in South-central China (10) are lower than those in the UK (3), Hong Kong (11), and Sri Lanka (8). Therefore, we applied the FRAX model in a population of middle-aged and elderly healthy (without current serious diseases) community residents to evaluate the fracture probabilities at different sites and assess the applicability of FRAX in Ningbo, China. The prevalence rate of osteoporosis in Ningbo, which is a coastal city in Eastern China with frequent rainstorms and typhoons, observed in those below the age of 60 years is higher than the prevalence rates reported in other regions in China (1,14), and data suggest that the peak BMD is lower and osteoporosis occurs earlier in residents of Ningbo than in residents of other areas in China (12,13).
’ METHODS
Study subjects
Subjects were consecutively enrolled between July 2013 and June 2015 from the Dongliu Street Community Health Service Center in Ningbo, China. We applied a simple random procedure according to a sequence of computer-generated random numbers to recruit eligible subjects. The inclusion criteria were as follows: healthy subjects aged between 40 and 89 years, healthy local permanent residents who had lived in Ningbo since birth, healthy subjects without a diagnosis of osteoporosis and not taking some certain related drugs, and subjects who could participate in the study independently. All study subjects provided written informed consent, and the study was approved by the Medical Ethics Committee of Jiangdong District. A questionnaire including sociodemo-graphic factors, chronic disease history, menstruation and reproductive history, lifestyle factors, dietary habits and other osteoporosis-related factors was completed by all subjects with the help of trained assistants. A comprehensive physical examination (including BMD, height, weight, electrocardio-graphy and routine blood tests) was also performed.
FRAX calculation
The 10-year MOFP (hip, clinical spine, humerus or wrist fracture) and the 10-year HOFP were computed using the FRAX model (http://www.shef.ac.uk/FRAX) (15). Fracture risk was calculated based on age, BMI and dichotomized risk factors (comprising prior fragility fractures, parental history of hip fractures, smoking, alcohol consumption, history of steroid use, rheumatoid arthritis and other causes of secondary osteoporo-sis). In addition, we entered the femoral neck (FN) BMD into the model to enhance its ability to predict fracture risk (16).
BMD evaluation
BMD was detected at the L1-L4 lumbar spine (LS), FN, and total hip using DXA (Lunar Prodigy, GE, USA). The DXA results were adjusted for age and weight, and Chinese adults aged 20-40 years were used as the reference group. All BMD measurements were performed by a trained licensed techno-logist. A T scorep-2.5 indicated osteoporosis, a T score4-2.5 and p-1.0 indicated osteopenia, and a T score4-1.0
indi-cated normal BMD(1).
Statistical analysis
Quantitative data are presented as the mean±standard deviation (SD) and were analyzed using Student’s t-tests or one-way ANOVA. Qualitative data are expressed as num-bers (percentages) and were analyzed using chi-squared
tests. Paired t-tests were used to compare the probabilities of fracture estimated with and without consideration of BMD. Risk stratification and partial correlation analyses were used to analyze the associations between FRAX-based probabil-ities and BMI or BMD at different sites. P-valueso0.05 were
considered statistically significant. All statistical analyses were performed using SPSS version 13.0 (SPSS, Chicago, IL).
’ RESULTS
Basic characteristics and FRAX-based osteoporotic fracture probability
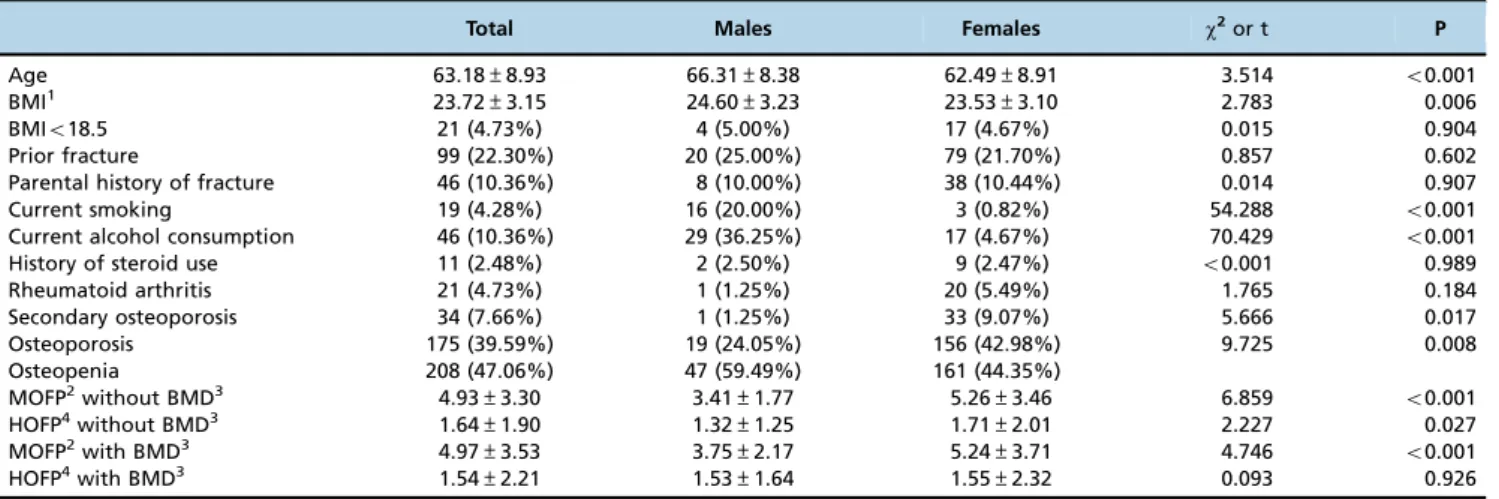
A total of 444 (80 males/364 females) subjects were inclu-ded in this study, and 98% of female subjects were post-menopausal women. Statistically significant differences were found for age, current smoking, current alcohol consumption and secondary osteoporosis between male and female sub-jects (Table 1). Of the subsub-jects, 175 (39.59%) were diagnosed as osteoporotic, and 208 (47.06%) were diagnosed as osteo-penic (Table 1). The rate of osteoporosis was significantly higher among females than males. The Kappa value for the detection of osteoporosis at the LS and FN was 0.314. Sta-tistically significant differences were observed between males and females for the FRAX-based 10-year MOFP and HOFP estimated without consideration of BMD and the 10-year MOFP estimated with consideration of BMD (Table 1). The MOFP and HOFP estimated with and without the considera-tion of BMD increased with age (Table 2). Significant positive associations were observed between the HOFPs estimated with and without consideration of BMD (r=0.761, Po0.001)
and the MOFPs estimated with and without consideration of BMD (r=0.804, Po0.001); however, no significant differences
were observed subjects with and subjects without BMD mea-surement.
The association between FRAX-based fracture probability and BMI
Significant negative associations were observed between BMI and FRAX-based fracture probabilities after adjusting for age among the overall subjects, and this difference was especially significant in males and in females when FRAX-based probabilities were calculated without consideration of BMD. While FRAX-based probabilities were calculated with consideration of BMD, a significant association between fracture probability and BMI was only identified in females (Table 3).
FRAX-based fracture probabilities among subjects with different BMD levels
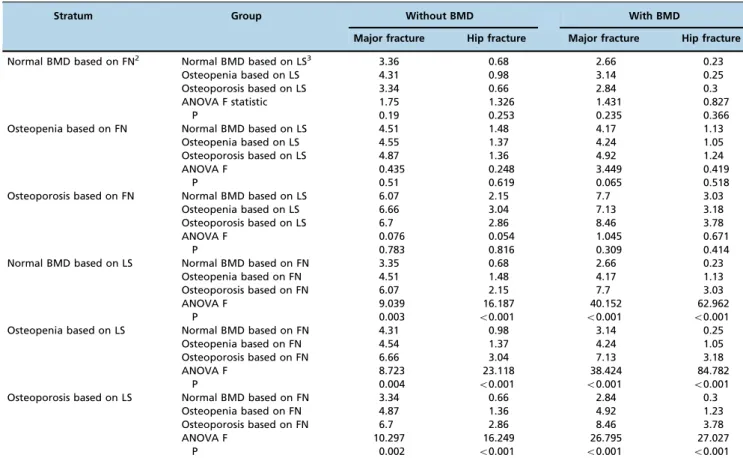
groups within each stratum (Table 4). Moreover, significant negative associations were found between the estimated FRAX-based fracture probabilities and FN BMD, even after controlling for LS BMD. Significant negative associations were also observed between the estimated FRAX-based fracture probabilities and LS BMD; however, these significant associa-tions did not remain after controlling for FN BMD (Table 5).
’ DISCUSSION
In this study, 39.59% of middle-aged and elderly healthy subjects in Ningbo (24.05% males and 42.80% females) were
diagnosed as osteoporotic, and these detection rates were higher than the rates previously detected among residents aged over 50 years in China (14.4% males and 20.7% females) (1). The FRAX-based fracture probabilities (MOFP 4.93%, HOFP 1.64%) identified in this study were higher than the fracture probabilities previously reported in China, such as the probabilities reported in postmenopausal women in Beijing (MOFP of 2% to 4%, HOFP of 0.2% to 1.6%) (17). Additionally, the fracture probabilities identified in this study were much lower than those previously reported in Taiwanese postmenopausal women (MOFP 13.8%, HOFP 2.2%) (18), postmenopausal women in Hong Kong (MOFP 6.9%, HOFP 2.3%) (11), healthy subjects in the US (3), and women agedX50 years in Canada (9).
In this study, the major fracture rate was 2.48% after 1 year of follow-up. Ba et al. found that when the FRAX-based 10-year MOFP was greater than 3% or the HOFP was greater than 1%, the fracture rates at any site were 13.04% among subjects who had received treatment and 31.58% among subjects who had not received any treatment after 2 years of follow-up (19). Furthermore, consistent with the review conducted by Zhang et al. (20) and the research performed by Min et al. (21), we believe the FRAX model may under-estimate the actual fracture probability in China.
Consistent with the study conducted by Fujiwara et al. (22), the FRAX-based fracture probability identified in females was significantly higher than that identified in males in this study, and these results remained stable in different age groups. We found a significant positive association
Table 1-Basic characteristics and FRAX-based 10-year osteoporotic fracture probabilities.
Total Males Females w2or t P
Age 63.18±8.93 66.31±8.38 62.49±8.91 3.514 o0.001
BMI1 23.72±3.15 24.60±3.23 23.53±3.10 2.783 0.006
BMIo18.5 21 (4.73%) 4 (5.00%) 17 (4.67%) 0.015 0.904
Prior fracture 99 (22.30%) 20 (25.00%) 79 (21.70%) 0.857 0.602
Parental history of fracture 46 (10.36%) 8 (10.00%) 38 (10.44%) 0.014 0.907
Current smoking 19 (4.28%) 16 (20.00%) 3 (0.82%) 54.288 o0.001
Current alcohol consumption 46 (10.36%) 29 (36.25%) 17 (4.67%) 70.429 o0.001
History of steroid use 11 (2.48%) 2 (2.50%) 9 (2.47%) o0.001 0.989
Rheumatoid arthritis 21 (4.73%) 1 (1.25%) 20 (5.49%) 1.765 0.184
Secondary osteoporosis 34 (7.66%) 1 (1.25%) 33 (9.07%) 5.666 0.017
Osteoporosis 175 (39.59%) 19 (24.05%) 156 (42.98%) 9.725 0.008
Osteopenia 208 (47.06%) 47 (59.49%) 161 (44.35%)
MOFP2without BMD3 4.93±3.30 3.41±1.77 5.26±3.46 6.859 o0.001
HOFP4without BMD3 1.64±1.90 1.32±1.25 1.71±2.01 2.227 0.027
MOFP2with BMD3 4.97±3.53 3.75±2.17 5.24±3.71 4.746 o0.001
HOFP4with BMD3 1.54±2.21 1.53±1.64 1.55±2.32 0.093 0.926
1BMI: body mass index;2MOFP: the FRAX-based 10-year major osteoporotic fracture probability; 3BMD: bone mineral density;4HOFP: the FRAX-based 10-year hip osteoporotic fracture probability.
Table 2-FRAX-based 10-year osteoporotic fracture probabilities among subjects in different age groups.
Age (years) N Without BMD1 With BMD
Major fracture Hip fracture Major fracture Hip fracture
o50 22 1.78±0.74 0.20±0.18 1.90±0.48 0.28±0.26
50-59 133 3.37±2.13 0.58±0.60 3.59±2.12 0.67±0.79
60-69 191 5.32±3.20 1.61±1.69 5.44±3.80 1.55±2.44
70-79 79 6.40±3.41 3.08±2.18 6.31±3.84 2.89±2.66
X80 19 9.34±3.92 4.96±2.02 7.41±3.73 3.28±1.72
Variance test F 31.439 58.676 16.496 19.555
P o0.001 o0.001 o0.001 o0.001
1BMD: bone mineral density.
Table 3-Associations between BMI1and FRAX-based 10-year osteoporotic fracture probabilities.
Without BMD2 With BMD
MOFP3 HOFP4 MOFP HOFP
All subjects r -0.237 -0.339 -0.113 -0.139
P o0.001 o0.001 0.018 0.004
Males r -0.238 -0.316 -0.016 -0.042
P 0.036 0.005 0.887 0.717
Females r -0.223 -0.338 -0.105 -0.150
P o0.001 o0.001 0.047 0.005
Note: The result was derived based on partial correlation analysis after controlling for age;
between the FRAX-based osteoporotic fracture probabilities estimated with and without the consideration of BMD, which were both significantly associated with BMD. Similar results were reported in studies conducted in Korea (23) and Beijing (17), and the authors of these studies suggested that the FRAX-based osteoporotic fracture probabilities with-out and with consideration of BMD could predict the risk of fracture.
Interestingly, we found that the estimated FRAX-based osteoporotic fracture probabilities were strongly associated with FN BMD, especially when BMD was not considered. Risk stratification and partial correlation analyses did not indicate significant associations between the estimated FRAX-based osteoporotic fracture probabilities and LS BMD. Based on these results, it may be inferred that the FRAX tool is more appropriate for the prediction of the osteoporotic fracture of the FN than for osteoporotic frac-tures of the LS.
Notably, we identified significant negative associations between BMI and FRAX-based fracture probabilities esti-mated without consideration of BMD. This association was especially significant in subjects with a BMI less than 19, who have an obviously higher fracture risk; however, for subjects with a BMI greater than 19, the fracture risk remained rela-tively stable. This result was similar to those reported by other studies (24,25), suggesting that the relationship between BMI and FRAX-based fracture probability is nonlinear and that a low BMI (o19) might be a risk factor for fracture.
Our study has limitations. The sample size was relatively small; therefore, the extrapolation of our results to the whole population should be performed with caution. The FRAX-based fracture probabilities identified in our study could not be well-verified based on actual fracture rates because the follow-up period of our study was not sufficiently long to obtain sufficient fracture data. Therefore, our results require further confirmation, which we intend to perform in a future study. Nevertheless, our study validates the applicability of
Table 4-FRAX-based 10-year fracture probabilities among groups with different BMD1levels in the risk stratification analysis.
Stratum Group Without BMD With BMD
Major fracture Hip fracture Major fracture Hip fracture
Normal BMD based on FN2 Normal BMD based on LS3 3.36 0.68 2.66 0.23
Osteopenia based on LS 4.31 0.98 3.14 0.25
Osteoporosis based on LS 3.34 0.66 2.84 0.3
ANOVA F statistic 1.75 1.326 1.431 0.827
P 0.19 0.253 0.235 0.366
Osteopenia based on FN Normal BMD based on LS 4.51 1.48 4.17 1.13
Osteopenia based on LS 4.55 1.37 4.24 1.05
Osteoporosis based on LS 4.87 1.36 4.92 1.24
ANOVA F 0.435 0.248 3.449 0.419
P 0.51 0.619 0.065 0.518
Osteoporosis based on FN Normal BMD based on LS 6.07 2.15 7.7 3.03
Osteopenia based on LS 6.66 3.04 7.13 3.18
Osteoporosis based on LS 6.7 2.86 8.46 3.78
ANOVA F 0.076 0.054 1.045 0.671
P 0.783 0.816 0.309 0.414
Normal BMD based on LS Normal BMD based on FN 3.35 0.68 2.66 0.23
Osteopenia based on FN 4.51 1.48 4.17 1.13
Osteoporosis based on FN 6.07 2.15 7.7 3.03
ANOVA F 9.039 16.187 40.152 62.962
P 0.003 o0.001 o0.001 o0.001
Osteopenia based on LS Normal BMD based on FN 4.31 0.98 3.14 0.25
Osteopenia based on FN 4.54 1.37 4.24 1.05
Osteoporosis based on FN 6.66 3.04 7.13 3.18
ANOVA F 8.723 23.118 38.424 84.782
P 0.004 o0.001 o0.001 o0.001
Osteoporosis based on LS Normal BMD based on FN 3.34 0.66 2.84 0.3
Osteopenia based on FN 4.87 1.36 4.92 1.23
Osteoporosis based on FN 6.7 2.86 8.46 3.78
ANOVA F 10.297 16.249 26.795 27.027
P 0.002 o0.001 o0.001 o0.001
1BMD: bone mineral density;2FN: femoral neck;3LS: lumbar spine.
Table 5-Associations between FRAX-based 10-year fracture probabilities and BMD1at different sites.
Without BMD With BMD
MOFP2 HOFP3 MOFP HOFP
FN BMD r -0.60 -0.60 -0.34 -0.39
P o0.001 o0.001 o0.001 o0.001
r4 -0.52 -0.54 -0.27 -0.34
P o0.001 o0.001 o0.001 o0.001
LS BMD r -0.21 -0.21 -0.34 -0.30
P o0.001 o0.001 o0.001 o0.001
r5 -0.02 0.02 -0.01 0.05
P 0.615 0.663 0.897 0.265
1BMD: bone mineral density;
2MOFP: FRAX-based 10-year major osteoporotic fracture probability; 3HOFP: FRAX-based 10-year hip osteoporotic fracture probability; 4: the relative coefficient derived based on a partial correlation analysis controlling for LS BMD;
the FRAX model in Ningbo, a coastal city in Eastern China with a high prevalence of osteoporosis.
In conclusion, osteoporosis imposes a heavy burden on the population in Ningbo. The Chinese FRAX model could predict osteoporotic fracture risk regardless of whether BMD was considered. This model may be useful to predict oste-oporotic fractures of the FN but has a limited ability to predict osteoporotic fractures of the LS. As the Chinese FRAX model may underestimate osteoporotic fracture risk, larger cohort studies that determine actual fracture rates are needed to validate and adjust the Chinese FRAX model. However, the FRAX model may have substantial value for screening and identifying those with a higher risk of osteoporotic fractures in China, especially in many primary medical facilities where BMD cannot be tested due to a lack of DXA equipment.
’ ACKNOWLEDGMENTS
This work was supported by the Municipal Science and Technology Bureau of Ningbo, China (No. 2014C50061).
’ AUTHOR CONTRIBUTIONS
Wang J assisted with the data collection, protocol development and manu-script preparation. Wang X, Fang Z and Lu N contributed to the protocol development and manuscript preparation. Han L contributed to the data collection, protocol development, statistical analysis and manuscript prepara-tion. All authors read and approved thefinal version of the manuscript.
’ REFERENCES
1. Osteoporosis & Bone Miner Research Branch of Chinese Medical Asso-ciation. Guidance of diagnosis and treatment of primary osteoporosis. Chin J Osteoporosis & Bone Miner Res. 2011;4(1):2-17.
2. Kanis JA, Oden A, Johansson H, Borgstrom F, Strom O, McCloskey E. FRAX and its applications to clinical practice. Bone. 2009;44(5):734-43, http://dx.doi.org/10.1016/j.bone.2009.01.373.
3. Kanis JA, McCloskey EV, Johansson H, Strom O, Borgstrom F, Oden A. Case finding for the management of osteoporosis with FRAX--assessment and intervention thresholds for the UK. Osteoporos Int. 2008;19(10): 1395-408, http://dx.doi.org/10.1007/s00198-008-0712-1.
4. Gadam RK, Schlauch K, Izuora KE. Frax Prediction without BMD for Assessment of Osteoporotic Fracture Risk. Endocr Pract. 2013;19(5):780-4, http://dx.doi.org/10.4158/EP12416.OR.
5. Strugala C, Sobala W, Szubert Z, Hanke W. Evaluation of osteoporotic fractures in the group of woman over 50 years of age-comparison of tools FRAX BMD versus FRAX BMI. Med Pr. 2013;64(3):327-33.
6. Sornay-Rendu E, Munoz F, Delmas PD, Chapurlat RD. The FRAX tool in French women: how well does it describe the real incidence of fracture in the OFELY cohort? J Bone Miner Res. 2010;25(10):2101-7. http://dx.doi. org/10.1002/jbmr.106.
7. Gonzalez-Macias J, Marin F, Vila J, Diez-Perez A. Probability of fractures predicted by FRAXs
and observed incidence in the Spanish ECOSAP Study cohort. Bone. 2012;50(1):373-7, http://dx.doi.org/10.1016/j.bone. 2011.11.006.
8. Lekamwasam S. Sri Lankan FRAX model and country-specific interven-tion thresholds. Arch Osteoporos. 2013;8:148, http://dx.doi.org/10.1007/ s11657-013-0148-x.
9. Leslie WD, Brennan SL, Lix LM, Johansson H, Oden A, McCloskey E, et al. Direct comparison of eight national FRAXs
tools for fracture pre-diction and treatment qualification in Canadian women. Arch Osteo-poros. 2013;8:145, http://dx.doi.org/10.1007/s11657-013-0145-0. 10. Zhang Z, Ou Y, Sheng Z, Liao E. How to decide intervention
thres-holds based on FRAX in central south Chinese postmenopausal women. Endocrine. 2014;45(2):195-7, http://dx.doi.org/10.1007/s12020-013-0076-y. 11. Cheung E, Cheung CL, Kung AW, Tan KC. Possible FRAX-based inter-vention thresholds for a cohort of Chinese postmenopausal women. Osteoporos Int. 2014;25(3):1017-23, http://dx.doi.org/10.1007/s00198-013-2553-9.
12. Mao BY, Wang DS, Ying ZZ. Measurement of bone mineral density by dual-energy X-ray absorptiometry in 2088 Ningbo residents. Orthop J Chin. 2004;12(11):858-60.
13. Piao JH, Pang LP, Liu ZH, Xiang Q, Su N, Pan ZA, et al. Chinese popu-lation, the diagnostic criteria of primary osteoporosis and the incidence of osteoporosis in China. Chin J Osteoporos. 2002;8(1):1-7.
14. Cheng XG, Yang DZ, Zhou Q, Zhuo TJ, Zhang HC, Xiang J, et al. Age-related bone mineral density, bone loss rate, prevalence of osteo-porosis, and reference database of women at multiple centers in China. J Clin Densitom. 2007;10(3):276-84, http://dx.doi.org/10.1016/j.jocd.2007. 05.004.
15. Kanis JA, on behalf of the World Health Organization Scientific Group. Assessment of osteoporosis at the primary healthcare level. Technical Report. WHO Collaborating Centre University of Sheffield, UK. 2008.
16. Kanis JA, Oden A, Johnell O, Johansson H, De Laet C, Brown J, et al. The use of clinical risk factors enhances the performance of BMD in the prediction of hip and osteoporotic fractures in men and women. Osteoporos Int. 2007;18(8):1033-46, http://dx.doi.org/10.1007/s00198-007-0343-y.
17. Deng JC, Tang H, Zhu FQ, Chen H, Jia P, Bao L, et al. Applicability assessment of FRAX for Chinese postmenopausal women. Chin J Osteo-porosis & Minor Res. 2012;5(4):247-54.
18. Li YM, Liu SH. Estimation of the 10-year probability of osteoporotic fracture in postmcnopausal taiwanese women with FRAX@. Tzu Chi Med J. 2010;22:29-35, http://dx.doi.org/10.1016/S1016-3190(10)60032-8. 19. Ba L, Jin LX, Chen SM, Guan YS. The correlative analysis of bone density
and fracture risk by using the software of FRAX. J Med Imaging. 2010;1516-9.
20. Zhang ZM, Sheng ZF, Liao EY. Development of FRAX in predicting fracture risk. Chin J Endocrinol Metab. 2012;28(12):1029-33.
21. Min YK, Lee DY, Park YS, Moon YW, Lim SJ, Lee YK, et al. A FRAX experience in Korea: fracture risk probabilities with a country-specific versus a surrogate model. J Bone Metab. 2015;22(3):113-8, http://dx.doi. org/10.11005/jbm.2015.22.3.113.
22. Fujiwara S, Nakamura T, Orimo H, Hosoi T, Gorai I, Oden A, et al. Development and application of a Japanese model of the WHO fracture risk assessment tool (FRAX). Osteoporos Int. 2008;19(4):429-35, http://dx.doi.org/10.1007/s00198-007-0544-4.
23. Jang EJ, Lee YK, Choi HJ, Ha YC, Jang S, Shin CS, et al. Osteoporotic fracture risk assessment using bone mineral density in Korean: a com-munity-based cohort study. J Bone Metab. 2016;23(1):34-9, http://dx.doi. org/10.11005/jbm.2016.23.1.34.
24. Gao G, Zhang ZL, Zhang H, Hu WW, Huang QR, Lu JH, et al. Hip axis length changes in 10,554 males and females and the association with femoral neck fracture. J Clin Densitom. 2008;11(3):360-6, http://dx.doi. org/10.1016/j.jocd.2008.04.005.