Diagnostic models of the pre-test probability of
stable coronary artery disease: A systematic review
Ting He,IXing Liu,INana Xu,II Ying Li,IIQiaoyu Wu,IMeilin Liu,IIIHong YuanI,II ,*
ICentral South University, The Third Xiangya Hospital, Department of Cardiology, Changsha 410013, The People
’s Republic of China.IICentral South University,
The Third Xiangya Hospital, Center of Clinical Pharmacology, Changsha 410013, The People’s Republic of China.IIIThe First Hospital of Beijing University,
Department of Gerontology, Beijing, The People’s Republic of China.
A comprehensive search of PubMed and Embase was performed in January 2015 to examine the available literature on validated diagnostic models of the pre-test probability of stable coronary artery disease and to describe the characteristics of the models. Studies that were designed to develop and validate diagnostic models of pre-test probability for stable coronary artery disease were included. Data regarding baseline patient characteristics, procedural characteristics, modeling methods, metrics of model performance, risk of bias, and clinical usefulness were extracted. Ten studies involving the development of 12 models and two studies focusing on external validation were identified. Seven models were validated internally, and seven models were validated externally. Discrimination varied between studies that were validated internally (C statistic 0.66-0.81) and externally (0.49-0.87). Only one study presented reclassification indices. The majority of better performing models included sex, age, symptoms, diabetes, smoking, and hyperlipidemia as variables. Only two diagnostic models evaluated the effects on clinical decision making processes or patient outcomes. Most diagnostic models of the pre-test probability of stable coronary artery disease have had modest success, and very few present data regarding the effects of these models on clinical decision making processes or patient outcomes.
KEYWORDS: Coronary Artery Disease; Risk Assessment; Pre-Test Probability; Systematic Review; Diagnosis.
He T, Liu X, Xu N, Li Y, Wu Q, Liu M, et al. Diagnostic models of the pre-test probability of stable coronary artery disease: A systematic review. Clinics. 2017;72(2):188-196
Received for publication onJuly 29, 2016;First review completed onNovember 9, 2016;Accepted for publication onDecember 16, 2016 *Corresponding author. E-mail: [email protected]
’ INTRODUCTION
Coronary artery disease (CAD) is a common public health problem that is frequently associated with high mortality and increased health costs. Invasive coronary arteriography (ICA), the gold standard procedure for diagnosing CAD, has been widely used in clinical practice. Although this procedure can reduce the misdiagnosis of CAD in patients, it may also be an excessive medical treatment. In a recent report, only 41% of patients who underwent ICA were then diagnosed with obstructive CAD, suggesting that at least half of the people who undergo this expensive procedure do not need it (1). Models that can predict the pre-test probability (PTP) of stable CAD in patients may serve as an effective ‘‘gatekeeper’’ to identify those who are at a high risk and who may benefit from further diagnostic investigation.
The European and American guidelines have recently pla-ced great importance on the initial risk stratification of sus-pected CAD to avoid unwarranted examinations and have
recommended the Duke clinical score (DCS) and Diamond-Forrest model (DFM) as the preferred models to calculate the PTP (2,3). However, some studies have suggested that these two risk assessment methods perform poorly in Asian populations, especially in China (4,5). Indeed, differences in derivation, inconsistent external validation, and complexity of the models often exist, which limit their general application in daily clinical practice. In addition, the effects of adopting clinical prediction rules to guide decision making and improve patient outcomes are often not evaluated. Therefore, we performed a systematic review of the available literature on validated diagnostic models of PTP for obstructive CAD and described the performance of the models and their clinical utility to better understand the development of diagnostic models and to help clinicians select the ideal model to use in their practices.
’ METHODS
Literature search
We conducted a systematic review of the available literature using the Preferred Reporting Items for Systematic Reviews and Meta-Analyses (PRISMA) guidelines (6). PubMed and Embase were searched in January 2016 by professional document retrieval personnel from the Xiang-Ya Medical Library of Central South University using the following search terms: ’coronary heart disease,’ ’coronary artery disease,’
DOI:10.6061/clinics/2017(03)10
Copyright&2017CLINICS–This is an Open Access article distributed under the terms of the Creative Commons License (http://creativecommons.org/licenses/by/ 4.0/) which permits unrestricted use, distribution, and reproduction in any medium or format, provided the original work is properly cited.
No potential conflict of interest was reported.
188
’stable angina,’ ’pre-test probability,’and’probabilistic model.’ Reference lists in relevant meta-analyses and reviews were manually examined. No language or data restrictions were included. All of the potentially relevant studies were examined in their entirety.
Selection criteria
Clinical prediction models can often be divided into diagnostic models that estimate the probability of a specific diagnosis and prognostic models that estimate the prob-ability of expected outcomes over a given period of time (7). In patients with suspected CAD, diagnostic models can provide a method to calculate the PTP, whereas prognostic models, such as the Framingham risk score, PROCAM (Prospective Cardiovascular Munster) score, and SCORE (Systematic Coronary Risk Evaluation) score, are used to stratify risk and to predict the clinical outcomes but not the anatomical results. In addition, prognostic models are often developed using asymptomatic patients (8,9). In our review, we mainly focused on diagnostic models.
We included articles if they evaluated the characteristics of a diagnostic model of CAD, regardless of whether they included information about the development or validation of the models. The inclusion criteria were as follows: (1) the model contained at least two independent variables; (2) the eligible clinical endpoint was a stable CAD; and (3) because predictive factors that are derived in a single population could lack validity and applicability, we included only stu-dies that presented both the development and validation of the diagnostic model. We did not specify the method of validation in advance, nor did we exclude studies where the derivation and validation cohorts (possibly from other stu-dies) were drawn from the same population. The exclusion criteria were: (1) the model was developed using patients with acute coronary syndrome, unstable chest pain, a history of myocardial infarction, or previous revascularization (per-cutaneous coronary intervention or coronary artery bypass graft surgery); (2) the clinical endpoint was myocardial infarction or death; or (3) the article was an unpublished conference abstract.
Data extraction
Two reviewers (Ting H and Xing L) extracted data from the included studies. The following items were recorded in standardized forms: the names of the authors, publication year, definition used for CAD, sample size, and method used for model development. We also noted the variables included in the model and the geographic origin of each study. If an article described more than two models, we considered all of the possible models as eligible for inclusion in our review. We also extracted metrics of model performance (discrimination, calibration, and reclassification).
Correspondence with the authors of the included studies was initiated as necessary. If discrepancies occurred, a con-sensus was reached by all authors through discussion. All of the obtained data were carefully examined for accuracy.
Model performance and validation
We evaluated the internal validity of each model by examining its discrimination power, calibration, and reclas-sification. The traditional metric used to assess model discrimination, the C statistic (equivalent to the area under the receiver operating characteristic curve), was extracted.
This value represented the model’s ability to distinguish patients with and without CAD. Typically, modest discrimi-native ability was defined by C statistic values that ranged from 0.7 to 0.8, whereas values that were greater than 0.8 were indicative of good discriminative ability. Other metrics, such as sensitivity and specificity, were included if the C statistic was not reported.
To determine the calibration, we used the Hosmer-Lemeshow statistic, which was used to verify that the degree of the average prediction was consistent with the observed outcome. A larger p-value indicated better calibration abi-lity (a p-value40.1 was considered evidence of adequate
calibration). If the Hosmer-Lemeshow statistic was not reported, we extracted information on the calibration plot, if shown.
Reclassification was evaluated using the net reclassi-fication improvement (NRI). The NRI compares the fre-quency with which appropriate reclassification occurs to the frequency with which inappropriate reclassification occurs in the use of the new model (10). For this test, a value of *po0.05 suggested that a significantly greater number of patients were being reclassified appropriately than were being reclassified inappropriately.
We also evaluated the generalizability of each diagnostic model by determining whether it had been externally vali-dated in an independent patient population, either in the original study or in a subsequent publication.
Quality assessment and clinical usefulness
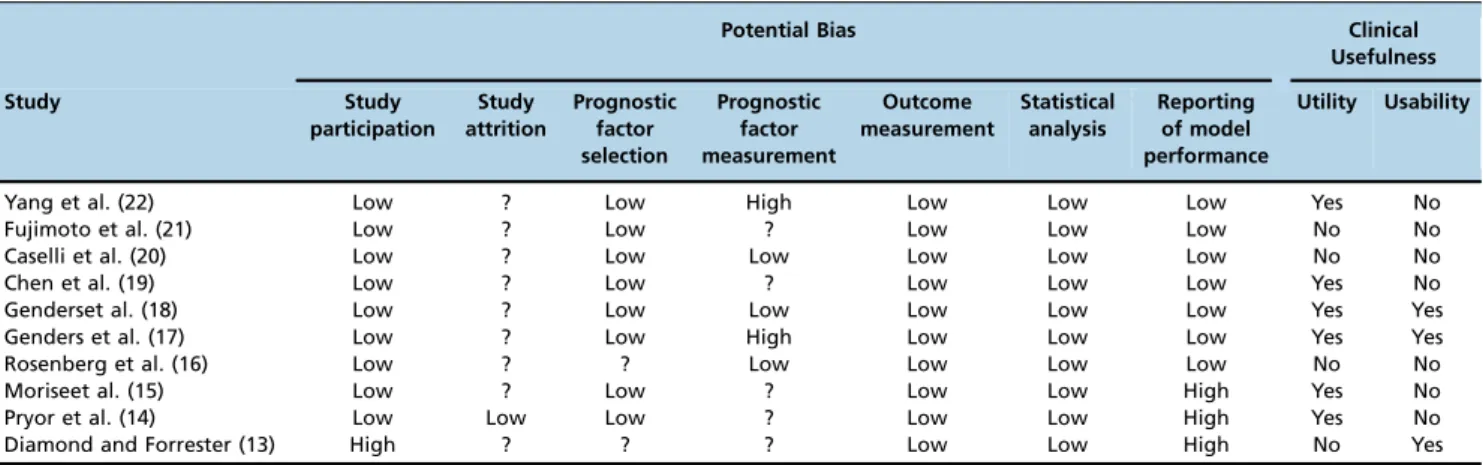
The methodological quality and risk of bias of each model were evaluated by two reviewers in accordance with the criteria recommended by Hayden and colleagues (11,12). The criteria were as follows: study participation, study attrition, prognostic factor selection, prognostic factor measurement, outcome measurement, statistical analysis, and reporting of model performance (discrimination, calibration, and reclas-sification). All of the items were assigned a value of ’low risk,’ ’high risk,’or ’uncertain.’
We also assessed the clinical usefulness of each model, which was defined as the combination of clinical utility and usability. For clinical utility (the effect on a clinical decision that is linked to a risk category or threshold), we determined whether the authors linked their models to specific risk categories and discussed how the risk categories would aid diagnostic evaluations. For usability (the availability of a clinical decision tool), we noted whether the authors inclu-ded a calculator or risk score that would facilitate knowledge translation and use at the bedside.
’ RESULTS
Included studies
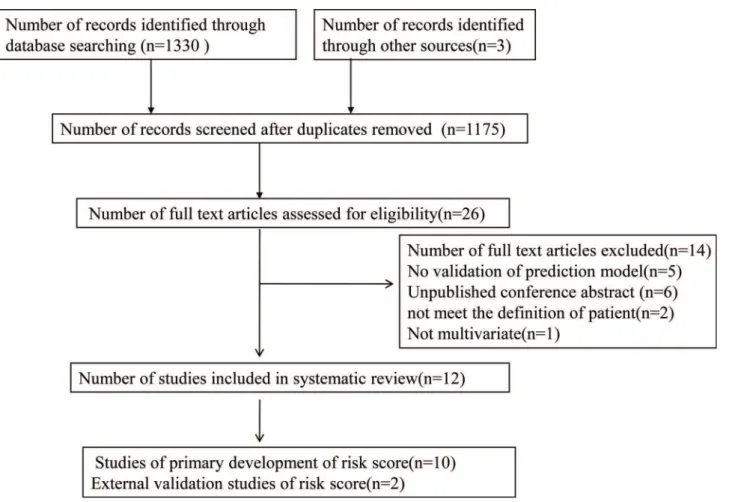
A total of 1333 studies were identified through PubMed and Embase searches. After removing duplicate studies, 1175 abstracts were screened. A total of 26 relevant full-text articles were assessed for eligibility, of which 12 trials com-prising 12 unique risk diagnostic models fulfilled the inclu-sion criteria.
Study characteristics and pertinent models
Ten studies (13-22) reporting the development of 12 models to predict CAD and two studies (4,23) focusing on external validation of models were included in the systematic review. A total of 53,108 patients (range 186 to 24,251 patients) were involved (not including Diamond 1979, which described an analysis using Bayes Theorem and did not specify the number of patients) (Table 1). The data sources for five of the models were multicenter trials. Only two of the models were develo-ped using Asian populations, whereas the remainder were developed using Western populations. The outcomes of interest differed between models and represented substantial heterogeneity. These outcomes of interest included severe CAD in two models, functionally significant CAD in another model, and obstructive CAD in the remaining models. In terms of defining obstructive CAD, five models defined it as having at least one vessel with at least 50% diameter stenosis, while the remaining model defined it as having at least one vessel with X75% stenosis. The reference standards for dia-gnosing CAD included two procedures, ICA and coronary computed tomography angiography (CTA). Regarding model development methods, only one study used Bayesian-based algorithms, while the others used multivariable logistic regres-sion analyses.
The number of predictors in each model ranged from three to 10 (Table 2). Nearly all of the diagnostic models included age, sex, and chest pain symptom as variables. Other common measures included in the majority of the risk models were diabetes mellitus, hypertension, smoking, and
hyperlipidemia. Very few of the models included the hospital setting as a variable. Only one model included estrogen status or genetic profile as a risk factor.
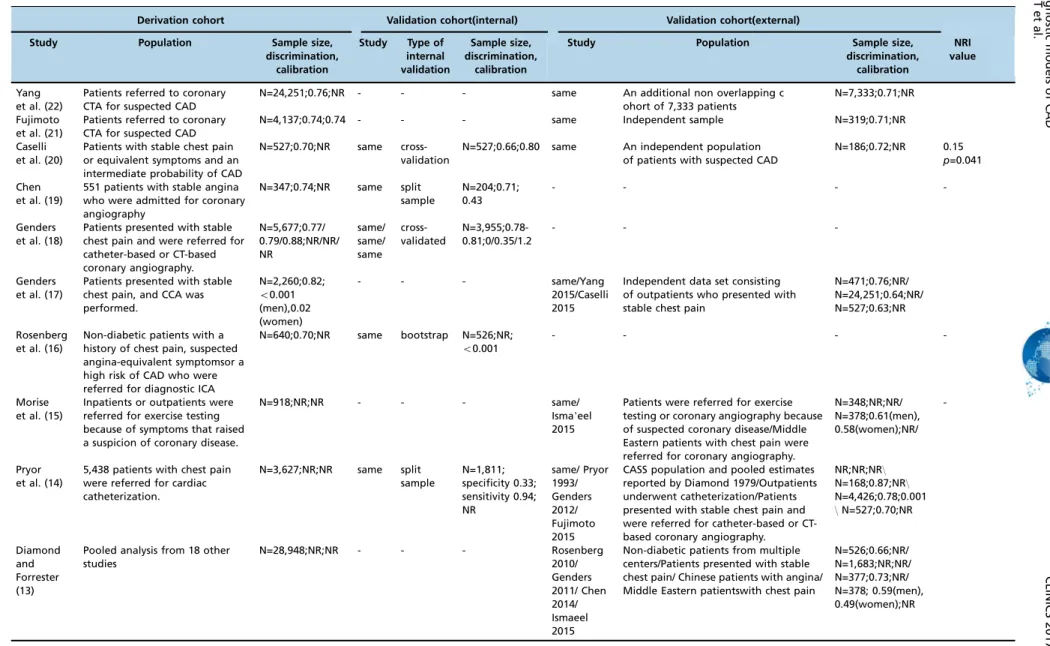
Model performance and validation
Seven models were validated internally, one with the bootstrap method, two with split samples (14,19), and four by cross-validation using the same population (18,20). Nine models reported the C statistic for the validation cohorts, which ranged from 0.49 to 0.88, indicating a degree of discriminative performance that varied from poor to excellent. Seven models were validated externally. Among those, four models (13-15,17) were reported in more than one external validation study, and their discriminating power showed a weakening trend in recent years (from 0.87 to 0.63). Only two studies reported calibration using the Hosmer-Lemeshow test for the derivation cohort, and both were adequate (18,21).The NRI was reported in one study (20) (Table 3).
Of the 12 models, only two had good discriminating power upon validation (C statistic 40.80). Eight and nine
predictors were present in these two models. These two higher-performing models included the following risk factors: sex, age, symptoms (chest pain), diabetes status, smoking status, and hyperlipidemia status. In addition to the previously listed common risk factors, one model also included the coronary calcium score, hypertension status, and hospital setting, whereas the other included the ECG results and history of previous myocardial infarctions. Figure 1 -Flow chart for eligible studies.
190 Diagnostic models of CAD
Patients (No) Events
Study Country Population
and setting
Definition of CAD
Reference standard
Derivation Validation Predictions (No) Derivation Validation Methods
Yang et al. (22)
An International Multicenter
Patients referred to CTA for suspected CAD
High-risk CAD was defined as left main
diameter stenosis450%,
3-vessel disease with
diameter stenosis470%,
or 2-vessel disease involving the proximal left anterior descending artery
CTA 24,251 7,333 9 variables: age, sex, diabetes,
hypertension, current smoking, hyperlipidemia, family history of CAD, history of peripheral vascular disease, and chest pain symptoms
877(3.6%) 349(4.8%) multivariate
logistic regression analysis
Fujimoto et al. (21)
Japanese population
Patients referred to CTA for suspected CAD
Obstructive CAD was defined as lesions with stenosis of 75% or more
CTA 4,137 319 8 variables: age, gender,
hypertension, diabetes mellitus, dyslipidemia, smoking, history of cerebral infarction, and chest symptoms.
764(18.5%). 123(34.1%) multivariate
logistic regression analysis
Caselli et al. (20)
14 European centers
Patients with stable chest pain or equivalent symptoms and an intermediate probability of CAD
Functionally significant CAD was defined as an ICA causing myocardial ischemia at stress imaging or associated with
reduced FFRo0.8, or both
CTA+at
least 1 coronary artery functional imaging test
527 186 6 variables:AST, hs-CRP levels,
HDL cholesterol, symptom characteristics, age, sex
80(15.2%) 75(40%) logistic
regression analysis
Chen et al. (19)
China Patients referred to
ICA for suspected CAD
Severe CAD was defined
as Gensini scoresX20,
which was approximately equal to onestenosed
lesionX70% in the
proximal left anterior descending artery
ICA 347 204 8 variables: age, sex, AVC,
abnormal ECG, diabetes, hyperlipidemia, HDL, LDL
202(58.2%) NR logistic
regression analysis
Genders et al. (18)
18 hospitals from Europe and the US
Patients were referred for catheter-based or CT-based coronary angiography
Obstructive CAD was defined as at least one vessel with at least 50% diameter stenosis on ICA
CTA+ICA 5,677 - The basic model included 4
variables: age, sex, symptoms, and setting. Theclinical model included 8 variables: age, sex, symptoms, setting, diabetes, hypertension, dyslipidemia, and smoking, The extended model included 9 variables: age, sex, symptoms, setting, diabetes, hypertension, dyslipidemia, smoking, and coronary calcium score.
- - logistic
regression analysis
Genders et al. (17)
14 hospitals from Europe and US
Patients presented with stable chest pain and an ICA was performed
Obstructive CAD was
defi-ned asX50% stenosis in
one or more vessels on ICA
ICA 2,260 - 3 risk factors: sex, age,
and symptoms
1,319(58.4%) - logistic
regression analysis
Rosenberg et al. (16)
39 center prospective study
Non-diabetic patients who were referred for diagnostic ICA or had a high risk of CAD
Obstructive CAD was
defined asX50% stenosis
inX1 major coronary artery by quantitative coronary angiography
ICA 640 526 23 genes grouped in the
6 terms, 4 sex-independent and 2sex-specific
230(35.9%) 192(36.5%) logistic
regression analysis
191
2017;72(
2):188-196
Diagnostic
models
of
CAD
He
T
et
Six models had moderate discriminative ability (C statistics of 0.70-0.80). These models included the following risk factors: chest pain symptoms (five models), diabetes or hyperlipidemia status (four models), hypertension or smok-ing status (three models), and hospital settsmok-ing (two models). Other risk factors, such as history of cerebral infarction or peripheral vascular disease, were included only in one model. All models included sex and age as risk factors.
Quality assessment and clinical usefulness
Important differences were present in the bias risk among the studies, with no single study satisfying all seven var-iables (Table 4). Although all studies adequately described subject selection and the certainty of the study outcomes, study attrition was described only in one of the studies. In addition, most of the studies on the 12 models provided little information on the selection (nine models) and measurement (seven models) of the prognostic factors.
As described above, information on model calibration and reclassification was absent from most studies. In addition, only two studies excluded patients with missing data, and the remaining studies did not report the amount of missing data. None of the studies reported the use of imputation techniques.
Half of the models (six of 12) stratified their cohorts into risk categories (low, moderate, and high risk). However, only one model explained how risk category assignment would affect diagnostic or therapeutic decisions. Simple risk calculators or web-based calculators were provided in three of the studies. One study evaluated the implications of the diagnostic model on clinical decision making and patient outcomes.
’ DISCUSSION
In our systematic review, we identified 10 studies that described 12 diagnostic models for estimating the probability of CAD, and we found that these models yielded similar discriminative abilities. Only two of the models were assessed in clinical practice. Our study is the first to synthesize the available literature on predictive models of the PTP calculation for CAD, and it highlights the need for further development and refinement of these models.
Model performance and validation
Only two of the models exhibited good discrimination based on the C statistic. However, one model included the coronary calcium score, which was assessed by CTA, as a risk factor. Because decisions on diagnostic testing are usually made before CTA is performed, inclusion of the coronary calcium score as a variable in the model limits its usefulness. The C statistic from the external validation of one of the other models showed a weakening trend (0.87 to 0.63) in recent years. An important cause of this trend is that the guidelines recommend using predictive models for PTP prior to non-invasive testing; therefore, this study chose CTA as the reference standard, whereas previous studies often regarded ICA as the reference standard. The model was developed using a population with a high prevalence of CAD who underwent ICA but was validated in a population with a low prevalence of CAD who underwent CTA. This caused the model to show poor discriminative ability. Indeed, an analysis restricted to patients who underwent ICA could be affected by verification bias. Other reasons for
Table 1 -Con tinue d. Patients (No) Events Study Country Population and setting Definition of CAD Refer ence standard Derivation V alidation Predictions (No) Derivation V alidation Methods Morise et al. (15) US Inpatients or outpatients were referred for exercise testing because of symptoms that raised the suspicion of coronary disease Significant coronary artery disease was defined as the presence of X 1 vessel w ith X 50% luminal diameter narrowing ICA 915 348 10 risk factors: sex, age, symptoms (chest pain), e strogen status, diabetes, hypertension, smoking, hyperlipidemia, family history , and obesity . 373 (41%) 157 (45%)
multivariate logistic regression analysis
Pryor et al. (14) US Patients with chest pain were referred for ICA Significant coronary artery disease was defined as 4 75% luminal diameter narrowing of at least one major coronary a rtery ICA 3,627 1,811 8 risk factors: sex, age, symptoms (chest pain), diabetes, smoking, hyperlipidemia, history of MI, and electrocardiogram (Q waves, ST -T wave changes) 2,379(65.6%) 1,266(69.9%)
multivariate logistic regression analysis
Diamond and Forrester (13)
US Pooled analysis from 18 other studies Obstructive CAD was defined as X 50% stenosis in one or more v essels on CCA coronary angiography -3 risk factors: sex, age, and symptoms
-Bayesian- based algorithms
Abbr eviations: CAD, coronary artery disease; CT A, coronary computed tomography angiography; ICA, invasive coronary arteriography; AST , aspartate aminotransfe rase; hs-CRP , high -sensitivity C-reactive protein; HDL, high-density lipoprotein; FFR, fractional flow reserve; A VC, aortic valve calcification; LDL, low-density lipoprotein; MI, myocardi al infarction 192 Diagnostic models of CAD
this phenomenon included that the entire population used to develop this model lived in the USA, and the model was developed 30 years ago. The differences in prevalence of risk factors and the homogeneity in some of the study popula-tions limit the generalizability of these models. Therefore, a PTP assessment model should be carefully chosen based on the clinical characteristics of the population of interest.
Almost all of the models were developed using multivariable logistic regression analysis, but the performance of these models was unsatisfactory. Several studies have demonstrated that data mining is a novel and promising approach for enhancing the performance ability of a model. Green et al. (24) compared the abilities of artificial neural networks (ANN) and multiple logistic regression models to predict acute coronary syndrome in the emergency room. The results of this compa-rison showed that the C statistics of the best ANN ensemble and the best logistic regression model were 0.81 and 0.76, respectively (*p=0.03) (24). Similarly, Alizadehsani et al. (25)
used data mining for the diagnosis of CAD and showed that characteristic chest pain, region RWMA2, and age were the most effective features, in addition to the features created using Information Gain. In addition, using this method and the feature creation algorithm, 94.08% accuracy was achieved, which is higher than current approaches in the literature (25). Future studies could use data mining to develop PTP calcu-lation models for CAD.
Chest pain characteristics were incorporated into nearly all of the models as a risk factor. However, some studies show that chest pain categorization has a limited ability to predict substantial CAD. When patient symptoms are used to pre-dict substantial CAD, dissociation frequently occurs between
coronary atherosclerosis and ischemic heart disease. Angina can occur in the absence of obstructive lesions and in two of three patients with stable angina (26). Furthermore, women who undergo ICA due to chest pain are more likely to present with less extensive CAD than men. Women are also more likely to show evidence of myocardial ischemia and non-obstructive CAD (27). Therefore, using only symptoms as the main variables in the model may overestimate the probability of CAD, especially in women. Some variables specific to women should be considered during model devel-opment. Previous studies have demonstrated that adding gestational diabetes mellitus(GDM) and estrogen status to the Updated Diamond-Forrest model (UDFM) can result in a significant NRI (*p=0.04) (28). Our review included a model
that incorporated estrogen status as a risk factor. Unfortu-nately, we found that this model performed poorly in the Middle Eastern cohort but was still better than the DFM, especially in symptomatic women (4,29).
Use of diagnostic models in clinical practice
Although predictive models for the PTP of CAD have been a focus of research for approximately 10 years, acceptance by clinicians has been low. However, the ability to exclude clinically significant CAD using the PTP in even a small percentage of patients with normal coronary arteries could be very beneficial. According to a recent study, the rigid application of the NICE chest pain guidance, which is recommended for use in the DFM and DCS models for the PTP calculation, may result in up to two of three patients being excluded from further cardiac examinations (30). Several important factors may limit the application of these models Table 2-Variables included in the predictive models of pre-test probability of coronary heart disease.
Study (sample size)
Variable Yang
et al. (22)
Fujimoto et al.
(21)
Caselli et al.
(20) Chen et al. (19)
Genders et al. (1) (18)
Genders et al. (2) (18)
Genders et al. (3) (18)
Genders et al.
(17)
Rosenberg et al.
(16)
Morise et al.
(15) Pryor et al. (14)
Diamond and Forrester
(13) Demographic
Age O O O O O O O O O O O
Sex O O O O O O O O O O O
Medical history
Diabetes mellitus O O O O O O O
Hypertension O O O O O
Previous MI O
Hyperlipidemia O O O O O O O
Cerebral infarction O
Peripheral vascular disease O
Clinical presentation/ physical examination
Chest pain O O O O O O O O O O
Coronary calcium score O
AVC O
Abnormal ECG O O
Personal history
Obesity O
Smoking O O O O O O
Family history of CAD O O
Laboratory values
AST O
hs-CRP O
LDL O
HDL O O
Estrogen status O
Others
Hospital setting O O O
Genes O
Table 3-Metrics of the performances of the models in predicting coronary heart disease.
Derivation cohort Validation cohort(internal) Validation cohort(external)
Study Population Sample size,
discrimination, calibration
Study Type of
internal validation
Sample size, discrimination,
calibration
Study Population Sample size,
discrimination, calibration
NRI value
Yang et al. (22)
Patients referred to coronary CTA for suspected CAD
N=24,251;0.76;NR - - - same An additional non overlapping c
ohort of 7,333 patients
N=7,333;0.71;NR
Fujimoto et al. (21)
Patients referred to coronary CTA for suspected CAD
N=4,137;0.74;0.74 - - - same Independent sample N=319;0.71;NR
Caselli et al. (20)
Patients with stable chest pain or equivalent symptoms and an intermediate probability of CAD
N=527;0.70;NR same
cross-validation
N=527;0.66;0.80 same An independent population
of patients with suspected CAD
N=186;0.72;NR 0.15
p=0.041
Chen et al. (19)
551 patients with stable angina who were admitted for coronary angiography
N=347;0.74;NR same split
sample
N=204;0.71; 0.43
- - -
-Genders et al. (18)
Patients presented with stable chest pain and were referred for catheter-based or CT-based coronary angiography.
N=5,677;0.77/ 0.79/0.88;NR/NR/ NR
same/ same/ same
cross-validated
N=3,955;0.78-0.81;0/0.35/1.2
- -
-Genders et al. (17)
Patients presented with stable chest pain, and CCA was performed.
N=2,260;0.82;
o0.001
(men),0.02 (women)
- - - same/Yang
2015/Caselli 2015
Independent data set consisting of outpatients who presented with stable chest pain
N=471;0.76;NR/ N=24,251;0.64;NR/ N=527;0.63;NR
Rosenberg et al. (16)
Non-diabetic patients with a history of chest pain, suspected angina-equivalent symptomsor a high risk of CAD who were referred for diagnostic ICA
N=640;0.70;NR same bootstrap N=526;NR;
o0.001
- - -
-Morise et al. (15)
Inpatients or outpatients were referred for exercise testing because of symptoms that raised a suspicion of coronary disease.
N=918;NR;NR - - - same/
Isma’eel 2015
Patients were referred for exercise testing or coronary angiography because of suspected coronary disease/Middle Eastern patients with chest pain were referred for coronary angiography.
N=348;NR;NR/ N=378;0.61(men), 0.58(women);NR/
-Pryor et al. (14)
5,438 patients with chest pain were referred for cardiac catheterization.
N=3,627;NR;NR same split
sample
N=1,811; specificity 0.33; sensitivity 0.94; NR
same/ Pryor 1993/ Genders 2012/ Fujimoto 2015
CASS population and pooled estimates reported by Diamond 1979/Outpatients underwent catheterization/Patients presented with stable chest pain and were referred for catheter-based or CT-based coronary angiography.
NR;NR;NR\
N=168;0.87;NR\
N=4,426;0.78;0.001
\N=527;0.70;NR
Diamond and Forrester (13)
Pooled analysis from 18 other studies
N=28,948;NR;NR - - - Rosenberg
2010/ Genders 2011/ Chen 2014/ Ismaeel 2015
Non-diabetic patients from multiple centers/Patients presented with stable chest pain/ Chinese patients with angina/ Middle Eastern patientswith chest pain
N=526;0.66;NR/ N=1,683;NR;NR/ N=377;0.73;NR/ N=378; 0.59(men), 0.49(women);NR
Abbreviation:CAD, coronary artery disease; CTA, computed tomography coronary angiography; ICA, invasive coronary arteriography; NR: notreported
194
Diagnosti
c
models
of
CAD
He
T
et
al.
CLINICS
2017;72(
in clinical practice. First, the risk factors included in the models are not readily available to physicians. For example, the DCS relies on the interpretation of an ECG and blood tests, whereas the DFM is more straightforward because it includes only information on age, sex, and symptoms. Therefore, compared to the DFM, it can be argued that the added variables in the DCS are not worth while because a more parsimonious risk assessment tool is most likely to be used in mainstream clinical practice (31). Second, unlike the Framingham risk score, almost all of the models in this review do not have an online calculator, which would make it difficult for doctors to calculate the PTP because they would need to use a complex formula. To enhance clinical utilization, the models should be based on demographic information and past histories that are typically accessible in real-world clinical practice. Equally important is the avai-lability of electronic or web-based calculators to facilitate use at the bedside.
In addition, limited data are available regarding the use of these models in clinical practice and their effect on clinical decision making and cost-effectiveness. Only the DFM and DCS models were studied in a letter to the Editor. The report on these models showed that by following the standard diagnostic pathway, the total cost of examining all patients was d102,731, compared to d198,495 for the
diagnostic pathway proposed by the NICE chest pain gui-dance (32).
Clinical Implications
In general, our review could help clinicians better under-stand the development of diagnostic models for CAD and thus better determine the appropriate model to apply to their specific patient population. Clinicians should consider using one of the higher-performing models that include readily available risk factors. Accurate, simple diagnostic models are more easily accepted in clinical decision making processes and patient counseling. Additionally, this review could provide a reference for future modeling efforts. The differing definitions of CAD may affect the generalizability and calibration of the models, and thus further model development and validation studies with large cohorts and a wide variety of populations are needed. We should acknowledge that the present review has several limitations. First, the degree of stenosis in some of the studies was determined by quantitative coronary angio-graphy, whereas other studies used visual assessment. Second, the studies included here involved heterogeneous populations
and had differing definitions for CAD, which could have led to differential risks for CAD.
The available data indicate that current models for the PTP calculation of CAD are still not fully refined. Although we identified some higher-performing models, it is difficult to generalize these to populations beyond those included in the studies. Further research should focus on developing models for predicting CAD that are better suited to broader popu-lations. Adequate clinical trials need to be conducted to assess the benefits of using these models in clinical practice for cases where CAD is not suspected.
’ ACKNOWLEDGMENTS
This study was supported by the Fundamental Research Funds of Central South University (no. 2016zzts565), the National Science Foundation of China (no. 81273594), and the National Key Technology R&D Program (no. 2012BAI37B05).
’ AUTHOR CONTRIBUTIONS
Ting H and Xing L are the main authors. Hong Y is the scientific adviser. Nana X, Ying L, Qiaoyu W and Meilin L provided assistance with the writing of the manuscript.
’ REFERENCES
1. Patel MR, Peterson ED, Dai D, Brennan JM, Redberg RF, Anderson HV, et al. Low diagnostic yield of elective coronary angiography. N Engl J Med. 2010;362(10):886-95, http://dx.doi.org/10.1056/NEJM oa0907272.
2. Montalescot G, Sechtem U, Achenbach S, Andreotti F, Arden C, Budaj A, et al. 2013 ESC guidelines on the management of stable coronary artery disease: the task force on the management of stable coronary artery disease of the European Society of Cardiology. Eur Heart J. 2013;34(38): 2949-3003, http://dx.doi.org/10.1093/eurheartj/eht296.
3. Fihn SD, Gardin JM, Abrams J, Berra K, Blankenship JC, Dallas AP, et al. 2012 ACCF/AHA/ACP/AATS/PCNA/SCAI/STS guideline for the diagnosis and management of patients with stable ischemic heart disease: executive summary. J Am Coll Cardiol. 2012;60(24):e44-e164, http://dx. doi.org/10.1016/j.jacc.2012.07.013.
4. Isma’eel HA, Serhan M, Sakr GE, Lamaa N, Garabedian T, Elhajj I, et al. Diamond-Forrester and Morise risk models perform poorly in predicting obstructive coronary disease in Middle Eastern Cohort. Int J Cardiol. 2016;203:803-5, http://dx.doi.org/10.1016/j.ijcard.2015.11.011. 5. Jia Z, Junjie Y, Ying Z, Xiaobo Y, Huawei Z, Yundai C. Diagnostic accuracy
of pre-test probability combined with computed tomographic coronary angiography in patients suspected for stable coronary artery disease. Acad J Chin PLA Med Sch. 2015;36:313-7.
6. Moher D, Liberati A, Tetzlaff J, Altman DG, PRISMA Group. Preferred reporting items for systematic reviews and meta-analyses: the PRISMA statement. PLoS Med. 2009;6(7):e1000097, http://dx.doi.org/10.1371/jour-nal.pmed.1000097.
Table 4-Guidelines for assessing the quality of prognostic studies based on the framework of potential biases.
Potential Bias Clinical
Usefulness
Study Study
participation Study attrition
Prognostic factor selection
Prognostic factor measurement
Outcome measurement
Statistical analysis
Reporting of model performance
Utility Usability
Yang et al. (22) Low ? Low High Low Low Low Yes No
Fujimoto et al. (21) Low ? Low ? Low Low Low No No
Caselli et al. (20) Low ? Low Low Low Low Low No No
Chen et al. (19) Low ? Low ? Low Low Low Yes No
Genderset al. (18) Low ? Low Low Low Low Low Yes Yes
Genders et al. (17) Low ? Low High Low Low Low Yes Yes
Rosenberg et al. (16) Low ? ? Low Low Low Low No No
Moriseet al. (15) Low ? Low ? Low Low High Yes No
Pryor et al. (14) Low Low Low ? Low Low High Yes No
7. Wessler BS, Lai Yh L, Kramer W, Cangelosi M, Raman G, Lutz JS, et al. Clinical prediction models for cardiovascular disease: Tufts predictive analytics and comparative effectiveness clinical prediction model data-base. Circ Cardiovasc Qual Outcomes. 2015;8(4):368-75, http://dx.doi. org/10.1161/CIRCOUTCOMES.115.001693.
8. Jensen JM, Ovrehus KA, Nielsen LH, Jensen JK, Larsen HM, Norgaard BL. Paradigm of pretest risk stratification before coronary computed tomo-graphy. J Cardiovasc Comput Tomogr. 2009;3(6):386-91, http://dx.doi. org/10.1016/j.jcct.2009.10.006.
9. Siontis GC, Tzoulaki I, Siontis KC, Ioannidis JP. Comparisons of estab-lished risk prediction models for cardiovascular disease: systematic review. BMJ. 2012;344:e3318, http://dx.doi.org/10.1136/bmj.e3318. 10. Pencina MJ, D’Agostino RB Sr, D’Agostino RB Jr, Vasan RS. Evaluating
the added predictive ability of a new marker: from area under the ROC curve to reclassification and beyond. Stat Med. 2008;27(2):157-72, http:// dx.doi.org/10.1002/sim.2929.
11. Hayden JA, Cote P, Bombardier C. Evaluation of the quality of prognosis studies in systematic reviews. Ann Intern Med. 2006;144(6):427-37, http://dx.doi.org/10.7326/0003-4819-144-6-200603210-00010.
12. Debray TP, Moons KG, Ahmed I, Koffijberg H, Riley RD. A framework for developing, implementing, and evaluating clinical prediction models in an individual participant data meta-analysis. Stat Med. 2013;32(18): 3158-80, http://dx.doi.org/10.1002/sim.5732.
13. Diamond GA, Forrester JS. Analysis of probability as an aid in the clinical diagnosis of coronary-artery disease. N Engl J Med. 1979;300(24):1350-8, http://dx.doi.org/10.1056/NEJM197906143002402.
14. Pryor DB, Harrell FE Jr, Lee KL, Califf RM, Rosati RA. Estimating the likelihood of significant coronary artery disease. Am J Med. 1983;75(5): 771-80, http://dx.doi.org/10.1016/0002-9343(83)90406-0.
15. Morise AP, Haddad WJ, Beckner D. Development and validation of a clinical score to estimate the probability of coronary artery disease in men and women presenting with suspected coronary disease. Am J Med. 1997;102(4):350-6, http://dx.doi.org/10.1016/S0002-9343(97)00086-7. 16. Rosenberg S, Elashoff MR, Beineke P, Daniels SE, Wingrove JA, Tingley
WG, et al. Multicenter validation of the diagnostic accuracy of a blood-based gene expression test for assessing obstructive coronary artery disease in nondiabetic patients. Ann Intern Med. 2010;153(7):425-34, http://dx.doi.org/10.7326/0003-4819-153-7-201010050-00005.
17. Genders TS, Steyerberg EW, Alkadhi H, Leschka S, Desbiolles L, Nieman K, et al. A clinical prediction rule for the diagnosis of coronary artery disease: validation, updating, and extension. Eur Heart J. 2011;32(11): 1316-30, http://dx.doi.org/10.1093/eurheartj/ehr014.
18. Genders TS, Steyerberg EW, Hunink MG, Nieman K, Galema TW, Mollet NR, et al. Prediction model to estimate presence of coronary artery dis-ease: retrospective pooled analysis of existing cohorts. BMJ. 2012;344: e3485, http://dx.doi.org/10.1136/bmj.e3485.
19. Chen ZW, Chen YH, Qian JY, Ma JY, Ge JB. Validation of a novel clinical prediction score for severe coronary artery diseases before elective cor-onary angiography. PLoS One. 2014;9(4):e94493, http://dx.doi.org/ 10.1371/journal.pone.0094493.
20. Caselli C, Rovai D, Lorenzoni V, Carpeggiani C, Teresinska A, Aguade S, et al. A new integrated clinical-biohumoral model to predict functionally
significant coronary artery disease in patients with chronic chest pain. Can J Cardiol. 2015;31(6):709-16, http://dx.doi.org/10.1016/j.cjca. 2015.01.035.
21. Fujimoto S, Kondo T, Yamamoto H, Yokoyama N, Tarutani Y, Takamura K, et al. Development of new risk score for pre-test probability of obstructive coronary artery disease based on coronary CT angiography. Heart Vessels. 2015;30(5):563-71, http://dx.doi.org/10.1007/s00380-014-0515-6. 22. Yang Y, Chen L, Yam Y, Achenbach S, Al-Mallah M, Berman DS, et al.
A clinical model to identify patients with high-risk coronary artery dis-ease. JACC Cardiovasc Imaging. 2015;8(4):427-34, http://dx.doi.org/ 10.1016/j.jcmg.2014.11.015.
23. Pryor DB, Shaw L, McCants CB, Lee KL, Mark DB, Harrell FE Jr, et al. Value of the history and physical in identifying patients at increased risk for coronary artery disease. Ann Intern Med. 1993;118(2):81-90, http://dx. doi.org/10.7326/0003-4819-118-2-199301150-00001.
24. Green M, Bjork J, Forberg J, Ekelund U, Edenbrandt L, Ohlsson M. Comparison between neural networks and multiple logistic regression to predict acute coronary syndrome in the emergency room. Artif Intell Med. 2006;38(3):305-18, http://dx.doi.org/10.1016/j.artmed.2006.07.006. 25. Alizadehsani R, Habibi J, Hosseini MJ, Mashayekhi H, Boghrati R,
Ghandeharioun A, et al. A data mining approach for diagnosis of cor-onary artery disease. Comput Methods Programs Biomed. 2013;111(1): 52-61, http://dx.doi.org/10.1016/j.cmpb.2013.03.004.
26. Rovai D, Neglia D, Lorenzoni V, Caselli C, Knuuti J, Underwood SR, et al. Limitations of chest pain categorization models to predict coronary artery disease. Am J Cardiol. 2015;116(4):504-7, http://dx.doi.org/10.1016/ j.amjcard.2015.05.008.
27. Suessenbacher A, Wanitschek M, Dörler J, Neururer S, Frick M, Pachinger O, et al. Sex differences in independent factors associated with coronary artery disease. Wien Klin Wochenschr. 2014;126(21-22):718-26, http://dx. doi.org/10.1007/s00508-014-0602-9.
28. Rademaker AA, Danad I, Groothuis JG, Heymans MW, Marcu CB, Knaapen P, et al. Comparison of different cardiac risk scores for coronary artery disease in symptomatic women: do female-specific risk factors matter? Eur J Prev Cardiol. 2014;21(11):1443-50, http://dx.doi.org/ 10.1177/2047487313494571.
29. Hong SN, Mieres JH, Jacobs JE, Babb JS, Patel P, Srichai MB. Assessing coronary disease in symptomatic women by the Morise score. J Womens Health. 2012;21(8):843-50, http://dx.doi.org/10.1089/jwh.2011.3109. 30. Patterson CM, Nair A, Ahmed N, Bryan L, Bell D, Nicol ED. Clinical
outcomes when applying NICE guidance for the investigation of recent-onset chest pain to a rapid-access chest pain clinic popula tion. Heart. 2015;101(2):113-8, http://dx.doi.org/10.1136/heartjnl-2014-306180.
31. Jensen JM, Voss M, Hansen VB, Andersen LK, Johansen PB, Munkholm H, et al. Risk stratification of patients suspected of coronary artery disease: comparison of five different models. Atherosclerosis. 2012;220(2):557-62, http://dx.doi.org/10.1016/j.atherosclerosis.2011.11.027.
32. Rogers T, Dowd R, Yap HL, Claridge S, Al Fakih K, Byrne J. Strict application of NICE clinical guideline 95’chest pain of recent onset’leads to over 90% increase in cost of investigation. Int J Cardiol. 2013;166(3): 740-2, http://dx.doi.org/10.1016/j.ijcard.2012.09.180.
196 Diagnostic models of CAD