TICLE
1 Instituto de Comunicação
e Informação Científica e Tecnológica em Saúde, Fundação Oswaldo Cruz. Av. Brasil 4365, Manguinhos. 21045-900 Rio de Janeiro RJ Brasil.
Health, access to services and sources of payment,
according to household surveys
Abstract This article analyzes the continuity of the historical series of indicators pertinent to the health supplements of the National House-hold Surveys (PNADs) of 1998, 2003, and 2008, and of the National Health Survey (PNS 2013). Indicators about health needs, access and use of health services, and their sources of payment were calculated using questions that sought to obtain this information from different surveys. In spite of improvements in the access and use of health services in all regions, we noted important region-al differences in region-all the anregion-alyzed dimensions when data from the North and Northeast regions were taken into consideration regarding the following: lower evaluation of health condition, greater re-striction of activities, and a reduced use of health services, in spite of greater coverage by public pro-grams. The changes in the source of payment for services carried out in the final two weeks demon-strate that the Brazilian population is using more services by way of the Unified Health System, the SUS, as well as more care by health plan and making less out of pocket payments. It is import-ant to observe that participation in the SUS in-creased in the more wealthy regions, and that the increase in attendance by health plan occurred in a significant way only in the Center West Region.
Key words Health Survey, Access to Health
Ser-vices, Health Care Needs Francisco Viacava 1
V
ia
ca
v
a F
, B
Introduction
In the mid-1990s, the Ministry of Health, through the REFORSUS program, assembled a group of researchers from different academic in-stitutions and representatives of IBGE, BENFAM, and IPEA to configure the design of a Household Survey, whose principal objective was “to provide information for the executive and legislative bod-ies, Health Councils, and the group of social and economic actors involved in the health sector, in the formulation, development, and evaluation of health policies”1.
Consequently, population-based data had to be obtained about the access to health services in the country, the coverage by different types of health insurance plans, the profile of health needs of the Brazilian population, utilization of health services as well as private healthcare costs of Brazilian families with health plans, consump-tion of goods and services, and consumpconsump-tion of medication.
Data of this nature had been collected by IBGE in 1981 for the National Household Sam-ple Survey2 and, after much revision, served as
the basis for the Health Supplement of PNAD in 19983. According to the PNAD sample design, the
data of the supplement would be representative of the populations of the 26 states in the Brazilian Federation and the Federal District.
In 2002, the Health Ministry arranged to fi-nance a new health supplement for PNAD that included some more objective questions about the access to health services4 for the 2003 PNAD
supplement. A new proposal was suggested to IBGE to include a third Health Supplement in PNAD in 2008 that, along with the goals of the previous years, could also validate the questions of VIGITEL (Surveillance of Chronic Illnesses by Telephone Survey), a survey that the Secretary of Health Surveillance of MS would implement in 2006, as well as a great number of questions about tobacco use5.
At the beginning of the decade of 2010, taking into account the growing number of health sup-plements in the PNADs, the need for the IBGE to periodically carry out a National Health Survey that would give continuity to the supplements and seek to describe in detail the conditions of health service use was discussed6. Through a long
process of internal discussion within the Minis-try of Health, content was generated for the Na-tional Health Survey (PNS) questionnaires 7, and
it was decided that the sample size could be much smaller than the size of the PNADs.
Differenc-es in the sample dDifferenc-esign were always important questions in terms of the cost and the represen-tativeness of the data. In order not to lose sight of the importance of the historical data series of the Health Supplements, the same questions with some differences between alternative responses were made in the PNS to the household residents. On the other hand, it sought to improve the va-lidity of the information about the use of services and the completeness of health actions beginning with a subsample of individuals 18 years of age or older, randomly distributed among the house-holds who related aspects of their health con-ditions and experiences in the use of services, among other aspects.
In this research, we verify the continuity of the historical series of indicators belonging to the health supplements of the 1998, 2003, and 2008 PNADs and to the National Health Research.
Methodology
Among the possible dimensions of analysis, questions about health conditions, access and use of services, and type of verified payment were selected. To calculate the indicators, the print-ed texts in the questionnaires assemblprint-ed by the IBGE technicians for the residents (Chart 1) were utilized. In spite of minor differences, the texts are sufficiently similar and were always drafted with the aim of maintaining the comparison of data in the various surveys.
The PNS is an independent research proj-ect of the PNAD, but also part of the System of Household Research of the IBGE in a subsample of the ongoing main sample of the PNAD, based on the largest number of census sectors best dis-tributed throughout the country that generate the most precise estimates. The stratification of primary sample units abides by four different criteria: administrative, including the division of states into capital cities, the remaining Metropol-itan Region (RM) or Integrated Region of Eco-nomic Development (RIDE), and the remainder of the state; geographic, which subdivides the capitals and other large municipalities into fur-ther strata; the situation that involves the catego-rization rural/urban; and statistical, with the ob-jective of improving the precision of estimates8.
ole
tiv
a,
21(2):351-370,
2016
of the prevalence of diabetes and hypertension and the carrying out of preventative exams for the detection of cervical cancer, just as in the PNS the data were collected using a subsample of individuals 18 or older, and the comparison was made by selecting only residents 18 and older in the PNADs.
Regarding the indicators about access/use of health services, the following criteria were con-sidered: percentage of persons that had a med-ical consultation in the 12 months prior to the interview; percentage of persons who had a den-tal appointment in the last 12 months; percent-age of persons who had never been to a dentist; percentage of persons who had used health ser-vices in the last two weeks; percentage of persons that had been referred for a hospitalization in the last 12 months; percentage of persons who are beneficiaries of a health plan; and percentage of persons residing in a domicile covered by the Family Health Strategy Program. The latter data has only been collected by the PNAD 2008 and by the PNS. To observe the trend in the use of specific services for the female population, indi-cators about access to mammography and cervi-cal cancer prevention services were compared. In the case of mammography, owing to the differ-ences in the scales of response regarding the time elapsed since the last exam between the PNADs of 2003 and 2008, the comparison of PNS data was made only with the 2008 PNAD, considering women between 50 and 69 years old. As much in the PNS as in the PNADs, the information was furnished by those present at the interviews about all of the residents. Regarding exams for the prevention of cervical cancer, the indicators from the data of the PNS and PNADs were com-pared for the population of women between the age of 25 and 64, according to the recommenda-tion of INCA (Narecommenda-tional Cancer Institute).
In order to understand questions related to the payment of health services, the household surveys have obtained information regarding the sources of payment for the services utilized in the two weeks prior to the interviews, as well as hospitalizations in the last 12 months. For this purpose, we asked residents via three different surveys if the medical attention was undertaken using a health plan, by way of SUS, and if they paid some of the costs. The data was obtained separately for each question, permitting the pos-sibility of more than one source of payment for each case.
Given the possibility of multiple forms of payment, it was necessary to consider each one
of them independently of the others: health plan, out of pocket payment, and SUS. In cases where the interviewed subject responded that they had paid out of pocket for medical attention in the last two weeks but had a total reimbursement, it was not considered as an out of pocket payment.
To make it possible to observe the continuity in the historical data series, the frequencies and intervals of confidence were calculated at the na-tional level and at the level of the greater regions (Chart 1).
Results
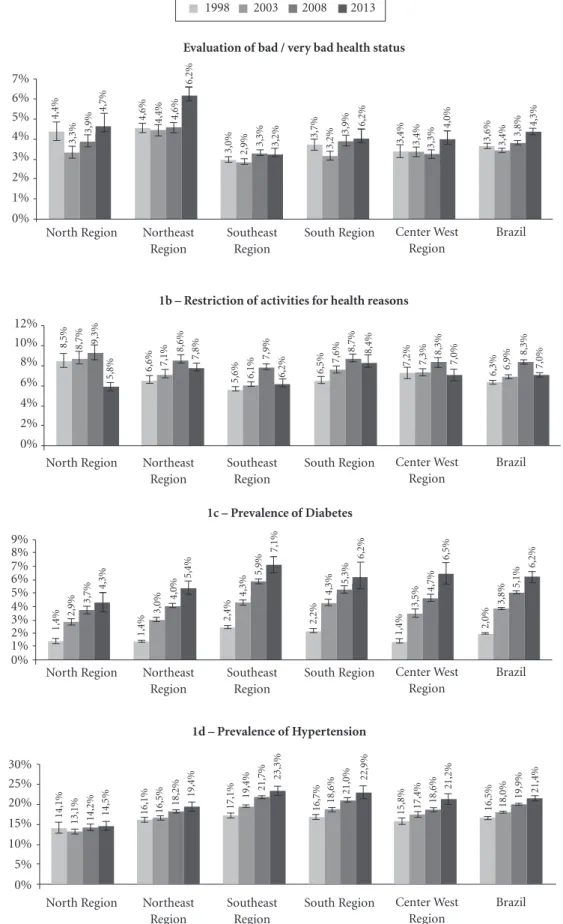
Regarding the estimates of health needs, it can be observed (Figure 1a) that the PNS data compared with data from the PNADs indicate a small in-crease in the percentage of persons whose health status was considered bad or very bad at the na-tional level, and in the North, Northeastern, and Center West regions. The greatest increase was observed in the Northeast Region, where the evaluation of health status as bad or very bad in-dicates 6% of people.
In terms of the restriction of routine activi-ties for health reasons in the two weeks prior to the interview (Figure 1b), we confirmed a small reduction at the national level and in all of the regions, with a greater emphasis in the North and Southeast regions.
The prevalence of diabetes and hypertension in adults 18 and older evaluated by the PNS lend continuity to the growth that had been observed by the PNADs (Figures 1c and 1d). For the nation-al level, the data indicates a prevnation-alence of 6.2% for diabetes and 21.4% for hypertension. In both cas-es, the most significant increases occurred in the Northeast, Southeast, and Center West.
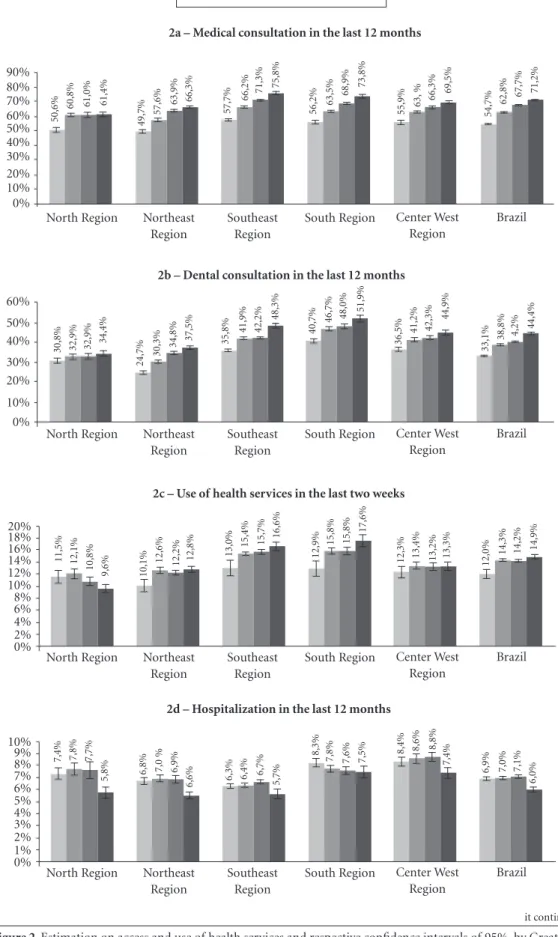
With the exception of the North region, ac-cording to the PNS, the increase in the percent-age of persons that consulted doctors and den-tists in the 12 months prior to the interviews follow the fluctuations that have already been demonstrated by the PNADs (Figures 2a and 2b). In 2013, 71.2% of the population sought a med-ical consultation and 44.4% consulted a dentist in the last 12 months. In all of the regions with the exception of the North, where the proportion remained the same as in 2008, the increase was significant.
V
ia
ca
v
a F
, B
Chart 1. Questions presented by the different surveys
Health state evaluation
Restriction of routine activities (in the last two weeks)
Prevalence of Hypertension
Prevalence of Diabetes
Coverage by a health plan
Medical consultation in the last 12 months
Dental consultation in the last 12 months
PNAD 1998
v1303 In general, you consider your own health status as:
v1304 In the last two weeks, have you failed to perform any of your habitual activities (work, school, play, etc) for reasons of health?
v1314 Do you have hypertension?
v1312 Do you have diabetes?
v1321 Do you have access to any health plan (medical or dental), privately-held, employer-based, or public sector?
v1347 In the last 12 months, have you consulted a doctor?
v1349 When did you go to the dentist most recently?
PNAD 2003
v1303 In general, ___ consider(s) their own health status as:
v1304 Have you failed to perform any of your habitual activities for reasons of health in the last two weeks?
v1314 Has any doctor or medical professional ever said that _____ has hypertension (high blood pressure)?
v1312 Has any doctor or medical professional ever said that _____ has diabetes?
v1321 Does ___ have access to any health plan (medical or dental), privately-held, employer-based, or public sector?
v1347 Consulted a doctor in the last 12 months
v1349 How long has it been since you last went to a dentist
PNAD 2008
v1303 In general, ___ consider(s) their own health status as:
v3304 In the last two weeks _____ failed to perform any of his or her habitual activities (work, school, play, household chores, etc.) for health reasons?
v1314 Has any doctor or medical professional said that _____ has hypertension (high blood pressure)?
v1312 Has any doctor or medical professional said that _____ has diabetes?
v1321 Does ___ have access to any health plan , medical or dental, privately-held, employer-based, or public sector?
v1347 In the last twelve months _____consulted a doctor?
v3349 When did ___ go to the dentist most recently?
PNS 2013
J1. In general, how is the health status of _________?
J2. In the last two weeks _____ failed to perform any of his or her habitual activities (work, school, play, household chores, etc.) for health reasons?
Q2. Has any doctor ever given you the diagnosis of arterial hypertension (high blood pressure) ?
Q30. Has any doctor ever given you the diagnosis of diabetes?
I001 _____ has some health plan, medical or dental, privately-held, employer-based, or public sector?
J011 When did ___ consult a doctor most recently?
J013 When did ___ have a dentist’s visit most recently?
ole
tiv
a,
21(2):351-370,
2016
Chart 1. continuation
Hospitalizations in the last 12 months
Use of health services in the last 15 days
PNADs
V1350 = 2 & (V1354 ou V1358 = 2)
PNS
J014 = 1 & (J017 = 1 ou J021 = 1)
Mammography coverage
Pap smear exam
PNAD 1998
v1369 In the last 12 months, have you been hospitalized?
v1350 In the last two weeks, have your sought any location, service, or health professional for care related to your own health?
v1354 During the first time you sought medical attention in the last two weeks, were you seen?
v1358 During the last time you sought medical attention in the last two weeks, were you seen?
PNAD 2003
v1369 Have you been hospitalized in the last twelve months?
v1350 Have you sought any place, service, or health professional for care related to your own health in the last two weeks?
v1354 Were you seen the first time you sought medical attention?
v1358 Were you seen the last time you sought health care attention?
v1704 When was the last time that ___ had a mammogram?
V1705 When was the last time that ____ had a preventative exame for cervical cancer?
PNAD 2008
v1369 In the last twelve months, has ___been hospitalized?
v1350 In the last two weeks, has ___ sought any place, service, or health professional for care related to his or her own health?
v1354 The first time that he/she sought medical attention, in the last two weeks, was ___ seen?
v1358 During the last time he/she sought medical attention, in the last two weeks, was _____ seen?
v7741 When was the last time that ___ had a mammogram?
V7751 When was the last time that ____ had a preventative exame for cervical cancer?
PNS 2013
J037 In the last 12 months, has ____ been hospitalized for 24 hours or longer?
J014 In the last two weeks, has ___ sought any place, service, or health professional for care related to his or her own health?
J017 The first time that he/she sought medical attention, in the last two weeks, was ___ seen?
J021 During the last time he/she sought medical attention, in the last two weeks, was _____ seen?
K40 - When was the last time that ___ had a mammography exam?
R1 – When was the last time that you had a preventative exam for cervical cancer?
V
ia
ca
v
a F
, B
Chart 1. continuation
Payment for medication attention received in the last two weeks
Payment for the most recent hospitalization in the last 12 months.
PNAD 1998
v1364 Was this medical attention covered by any health plan?
v1365 Did you pay any amount for medical attention received in the last two weeks?
v1366 Was this medical attention received via the Unified Health System (SUS)?
v1374 Was your most recent hospitalization in the last 12 months covered by any health plan?
v1375 Did you pay any amount for this most recent hospitalization from the last 12 months?
v1376 Was this most recent hospitalization carried out via the Unified Health System?
PNAD 2003
v1364 Was this medical attention covered by any health plan?
v1365 Did _____ pay any amount for the medical attention received in the last two weeks?
v1366 Was this medical attention received via the Unified Health System (SUS)?
v1374 Was your (most recent) hospitalization in the last 12 months covered by any health plan?
v1375 Did ____ pay any amount for this (most recent) hospitalization from the last 12 months?
v1376 Was this (most recent) hospitalization carried out via the Unified Health System (SUS)?
PNAD 2008
V1364 Was this medical attention covered by any health plan?
v1365 Did _____ pay any amount for the medical attention received in the last two weeks?
v1366 Was this medical attention received via the Unified Health System (SUS)?
v1374 Was your (most recent) hospitalization in the last 12 months covered by any health plan?
v1375 Did ____ pay any amount for this (most recent) hospitalization from the last 12 months?
v1376 Was this (most recent) hospitalization carried out via the Unified Health System (SUS)?
PNS 2013
J24. Was this medical attention for ___ covered by any health plan?
J25. Did _____pay any amount for the medical attention received in the last two weeks? (if the interviewee responds that they paid, but received a total reimbursement, mark option 2 – “No.”)
J26. Was medical attention for ______ carried out by the SUS?
J42. Was the most recent hospitalization of _____ in the last 12 months covered by any health plan?
J43. Did _____ pay any amount for this most recent hospitalization? (if the interviewee responds that they paid, but received a total reimbursement, mark option 2 – “No.”)
ole
tiv
a,
21(2):351-370,
2016
Figure 1. Estimation of indicators on health needs and respective confidence intervals of 95% by Greater Region
in Brazil, 1998, 2003, 2008, and 2013.
1998 2003 2008 2013
0% 2% 4% 6% 8% 10% 12%
8,5% 8,7% 9,3%
5,8% 6,6%
7,1%
8,6%
7,8%
5,6% 6,1%
7,9%
6,2% 6,5%
7,6%
8,7%
7,2% 7,3% 8,3%
6,3% 6,9%
8,3%
7,0%
8,4%
7,0%
1b – Restriction of activities for health reasons
1d – Prevalence of Hypertension
0% 5% 10% 15% 20% 25% 30%
14,1%
13,1% 14,2% 14,5% 16,1% 16,5% 18,2%
19,4%
17,1%
19,4% 21,7%
23,3%
16,7% 18,6%
21,0%
15,8% 17,4%
18,6%
16,5% 18,0% 19,9% 21,4%
22,9% 21,2%
1c – Prevalence of Diabetes
1,4%
2,9%
3,7%
4,3%
1,4%
3,0%
4,0%
5,4%
2,4%
4,3%
5,9%
7,1%
2,2%
4,3%
5,3%
1,4%
3,5%
4,7%
2,0%
3,8%
5,1%
6,2%
6,2% 6,5%
0% 1% 2% 3% 4% 5% 6% 7% 8% 9%
Evaluation of bad / very bad health status
North Region Northeast Region
Southeast Region
South Region Center West Region
Brazil 0%
1% 2% 3% 4% 5% 6% 7%
4,4%
3,3%
3,9%
4,7%
4,6% 4,4% 4,6%
6,2%
3,0% 2,9% 3,3% 3,2%
3,7%
3,2%
3,9%
3,4% 3,4% 3,3% 3,6% 3,4% 3,8%
4,3%
6,2% 4,0%
North Region Northeast Region
Southeast Region
South Region Center West Region
Brazil
North Region Northeast Region
Southeast Region
South Region Center West Region
Brazil
North Region Northeast Region
Southeast Region
South Region Center West Region
V
ia
ca
v
a F
, B
significant increase in the proportion of per-sons in the South Region, where the percentage reached 17.6%, and a decrease in the case of the North Region (9.6%) (Figure 2c). At the nation-al level, the percentage held at 14-15%, the same observed in 2003 and 2008.
Regarding the frequency of hospitalizations (Figure 2d), data from the PNS shows a trend of decrease when we analyze the percentage of per-sons that had at least one hospital stay in the 12 months prior to the interview. The sole exception occurs in the South region, which demonstrates a rate practically equal to that verified by the PNAD in 2008. Greater declines in this percent-age were observed in the North and Northeast regions; at the national level, the rate of 6% ob-served in 2013 indicates a reduction of 1% in the rates that were roughly around 7% as presented by the 1998, 2003, and 2008 PNADs.
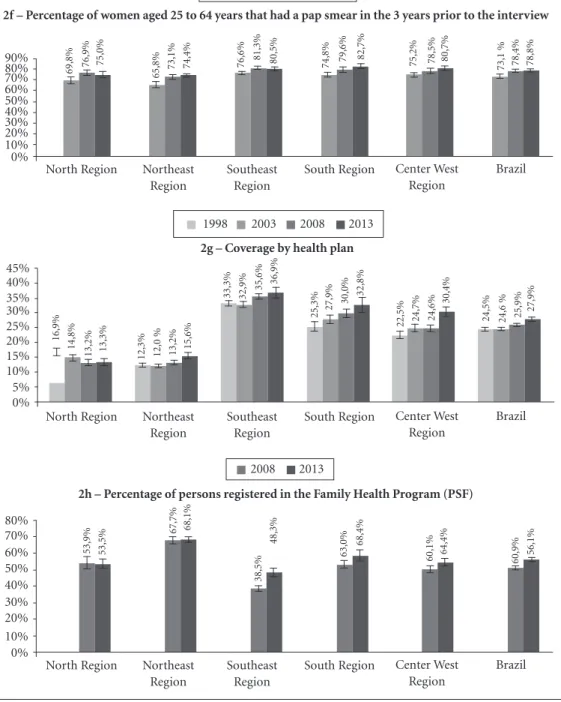
According to the PNS, mammograms in women between 50 and 69 years of age in the two years prior to the interviews had increased close to 6% throughout the country, and was observed in all of the major regions, especially in the Northeast and the South (Figure 2d). In the case of cervical cancer prevention, major differences in the proportion of women between 25 and 64 years that had an exam in the three years prior to the interviews were observed between the two PNADs (Figure 2f). PNS data indicates a small trend toward increase in the South region com-pared to the data from the 2008 PNAD.
In addition to these indicators regarding use of services, access to the healthcare system can also be evaluated by the coverage of supplemen-tal health programs and by the Family Health Strategy program (Figures 2g and 2h). In the first case, the data generated by the surveys in-dicates whether the residents of the households have any health care plan, medical or dental, pri-vately-held, employer based, or public sector. At the national level there was a slight increase (2%) according to the PNS data, which indicates that 28% of the population has this type of coverage. Spanning 15 years of observation, these trends have varied according to the larger geographic re-gions. The North and Northeast regions demon-strate the lowest rates (in the area of 15%), with some growth in 2013 in the Northeast. The high-est rates are observed in the Southeast where, in 2013, the PNS detected close to 37% coverage, a value similar to that of the 2008 PNAD. In the South region and especially in the Center West,
we note the increase in these rates in relation to 2008 and previous years.
Regarding coverage by the Family Health Strategy (ESF) plan (Figure 2h), PNS data in-dicate important increases in the percentage of households covered in the Southeast and the South when compared with data from the 2008 PNAD. Taking into account the population re-siding in covered households in the country as a whole, in 2013, 56.1% of households were cov-ered by the ESF, and highest rates (nearly 70%) are found in the Northeast. The least coverage is found in the Southeast region (48%) where, however, the percentage of covered households increased close to 10% in relation to the rate ob-served in the 2008 PNAD.
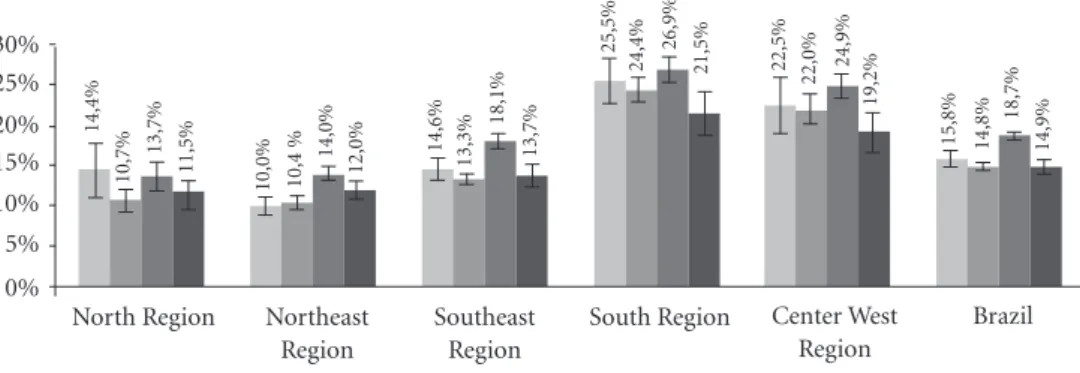
Figure 3a presents the percentages of medical consultations during the two weeks prior to the interviews in which some type of direct payment from users was necessary. The data indicates that there was a decline from 19%, observed in 2008, to 15% in this form of payment in 2013 at the national level. A decline was also observed in the Southeast, South, and Center West regions. On the other hand, we noted an increase in medical consultations via the SUS system at the national level, which in 2013 reached 60%, as well as in the Southeast and the South where it was in the area of 5% (Figure 3c). With the exception of the Center West region, where we note an important increase (6%) in medical consultations made via private healthplans, in the rest of the regions there is a small trend of increase that generates a considerable increase at the national level in that, in 2013, 29.2% of consultations were made using private health plans, while in 2003 and 2008 such health plans were used in 26% of consultations.
Regarding hospitalizations in the 12 months prior to the interviews (Figures 3d-3f), the high rate of procedures undertaken via SUS (in the area of 66-68%) demonstrates a stabilizing trend since 2003 at the national level and in all of the regions. A decrease in out of pocket payments is also observed in 2003 and remains at roughly 10% in the following years. This trend was most significant in the South and the Center West.
Regarding the percentage of hospitalizations that were paid via health plans, we note minor increases in 2013 at the national level and in the Center West region. The trend also appears stable in the other regions.
reach-ole
tiv
a,
21(2):351-370,
2016
Figure 2. Estimation on access and use of health services and respective confidence intervals of 95%, by Greater
Regions of Brazil, 1998, 2003, 2008, and 2013
1998 2003 2008 2013
2b – Dental consultation in the last 12 months
30,8% 32,9% 32,9% 34,4%
24,7% 30,3%
34,8% 37,5% 35,8% 41,9% 42,2%
48,3%
40,7%
46,7% 48,0%
36,5%
41,2% 42,3%
33,1%
38,8% 4,2%
44,4%
51,9%
44,9%
0% 10% 20% 30% 40% 50% 60%
2a – Medical consultation in the last 12 months
0% 10% 20% 30% 40% 50% 60% 70%
50,6%
60,8% 61,0% 61,4%
49,7%
57,6% 63,9%
66,3%
57,7%
66,2% 71,3%
75,8%
56,2% 63,5%
68,9%
55,9% 63,
%
66,3%
54,7%
62,8% 67,7%
71,2%
73,8%
69,5%
80% 90%
2c – Use of health services in the last two weeks
0% 2% 4% 10% 14% 16% 20%
11,5% 12,1%
10,8%
9,6% 10,1%
12,6% 12,2% 12,8% 13,0% 15,4% 15,7% 16,6%
12,9%
15,8% 15,8%
12,3% 13,4% 13,2% 12,0% 14,3% 14,2%
14,9%
17,6%
13,3%
6% 8% 12% 18%
2d – Hospitalization in the last 12 months
0% 1% 2% 5% 7% 8% 10%
7,4% 7,8% 7,7%
5,8% 6,8% 7,0 % 6,9%
6,6% 6,3% 6,4%
6,7%
5,7%
8,3%
7,8% 7,6% 8,4%
8,6% 8,8%
6,9% 7,0% 7,1%
6,0%
7,5% 7,4%
3% 4% 6% 9%
it continues North Region Northeast
Region
Southeast Region
South Region Center West Region
Brazil
North Region Northeast Region
Southeast Region
South Region Center West Region
Brazil
North Region Northeast Region
Southeast Region
South Region Center West Region
Brazil
North Region Northeast Region
Southeast Region
South Region Center West Region
V
ia
ca
v
a F
, B
Figure 2. continuation
2008 2013
2e – Percentage of women aged 50 to 69 that had a mammogram in the 2 years prior to the interview
0% 10% 20% 40% 60% 80%
36,3% 38,7% 39,8%
47,9%
63,8% 67,9%
55,1% 52,4% 54,2% 60,0%
64,5%
55,6%
30% 50% 70%
2f – Percentage of women aged 25 to 64 years that had a pap smear in the 3 years prior to the interview
0% 10% 20% 50% 70%
80% 69,8% 76,9% 75,0% 65,8% 73,1% 74,4% 76,6%
81,3% 80,5%
74,8% 79,6% 82,7% 75,2% 78,5% 80,7% 73,1 % 78,4% 78,8%
30% 40% 60% 90%
2003 2008 2013
2g – Coverage by health plan
0% 5% 10% 20% 30% 35% 45%
16,9%
14,8%
13,2% 13,3% 12,3% 12,0 % 13,2% 15,6%
33,3% 32,9% 35,6%
36,9%
25,3% 27,9%
30,0%
22,5% 24,7% 24,6% 24,5% 24,6 % 25,9%
27,9%
32,8%
30,4%
15% 25% 40%
1998 2003 2008 2013
2h – Percentage of persons registered in the Family Health Program (PSF)
0% 10% 50% 60% 80%
53,9% 53,5%
67,7% 68,1%
38,5%
48,3%
63,0% 60,1%
60,9% 56,1%
68,4%
64,4%
20% 30% 40% 70%
2008 2013
North Region Northeast Region
Southeast Region
South Region Center West Region
Brazil
North Region Northeast Region
Southeast Region
South Region Center West Region
Brazil North Region Northeast
Region
Southeast Region
South Region Center West Region
Brazil
North Region Northeast Region
Southeast Region
South Region Center West Region
ole
tiv
a,
21(2):351-370,
2016
Figure 3. Estimation of indicators on the method of payment for services and respective confidence of intervals
of 95% by Greater Regions of Brazil, 1998, 2003, 2008, and 2013 (To be continued).
1998 2003 2008 2013
3b – Percentage of services in the last two weeks carried out via SUS
0% 2% 10% 14% 16% 20%
56,8% 66,9% 66,7% 69,1%
61,8% 69,5% 68,6% 69,0%
41,9% 51,4% 49,9%
55,1% 50,4% 53,5% 53,5%
46,4% 56,2% 56,2% 49,3% 57,2% 56,5% 59,9%
58,1% 58,7%
6% 8% 12% 18%
3a – Percentage of services in the last two weeks with out-of-pocket disbursement
0% 5% 15% 25% 30%
14,4%
10,7%
13,7%
11,5%
10,0% 10,4 %
14,0%
12,0%
14,6%
13,3%
18,1%
13,7%
25,5%
24,4% 26,9% 22,5% 22,0% 24,9%
15,8% 14,8%
18,7%
14,9%
21,5%
19,2%
10% 20%
3c – Percentage of services in the last two weeks covered by a Health Plan
15,1%
14,9% 15,2%
18,4% 13,8% 14,9% 16,1%
18,3%
34,6%
33,3% 33,3% 35,9%
26,4%
26,9% 26,1% 21,6% 22,8% 24,2%
26,8%
26,0% 26,2% 29,2%
28,9% 30,1%
0% 5% 10% 15% 30% 35% 45%
20% 25% 40%
ing close to 70-80% in the North and Northeast regions, and in the area of 60% in the others. Pay-ment by health plans is greatest in the Southeast, where it reaches 35%. Smaller percentages, in the range of 15%, occur in the North and Northeast.
The values of the indicators and confidence intervals about needs, use/access, and financing of health services, from which the graphs in Fig-ures 1-3 were elaborated, can be found in Tables 1-3.
it continues North Region Northeast
Region
Southeast Region
South Region Center West Region
Brazil
North Region Northeast Region
Southeast Region
South Region Center West Region
Brazil
North Region Northeast Region
Southeast Region
South Region Center West Region
V
ia
ca
v
a F
, B
1998 2003 2008 2013
Figure 3. continuation
3e – Percentage of hospitalizations in the last 12 months via SUS
0% 10% 40% 60% 70% 90%
68,1% 76,
%
78,5% 73,9% 76,8% 80,1% 82,1% 76,5%
54,6% 58,9% 58,6% 58,8% 62,4% 64,7% 65,
%
56,2% 65,4%
65,
%
63,1% 67,6% 68,3% 65,7%
63,8% 61,6%
20% 30% 50% 80%
3d – Percentage of hospitalizations in the last 12 months paid by out-of-pocket disbursement
0% 5% 15% 25% 30%
13,8%
8,8%
7,6% 9,2%
5,2% 5,1 % 5,7% 8,1%
11,8%
8,6% 9,3% 9,7%
27,8%
18,7%
16,6%
23,5%
16,0% 18,3%
13,9%
9,9% 10,1% 10,8%
15,1% 15,4%
10% 20%
3f – Percentage of hospitalizations in the last 12 months covered by a Health Plan
16,7%
14,7% 12,7% 15,3% 13,3% 12,2% 12,7%
16,0%
34,2%
34,5% 35,4% 35,4%
24,2% 25,8% 26,2% 22,9%
22,
%
23,5% 24,6% 24,3% 24,7% 27,2%
29,5% 29,5%
0% 10% 40% 50%
20% 30% 35%
Discussion
According to Szwarcwald et al.8, even with a
smaller sample size than the PNADs, the PNS sample was designed to allow for estimates for
the state (UF), capital, remainder of the metro-politan region, and remainder of the UF. This was done with the objective of “an estimation of the different indicators with the desired precision to assure continuity in the monitoring of the great
North Region Northeast Region
Southeast Region
South Region Center West Region
Brazil
North Region Northeast Region
Southeast Region
South Region Center West Region
Brazil
North Region Northeast Region
Southeast Region
South Region Center West Region
ole
tiv
a,
21(2):351-370,
2016
Indicators
North Region
Bad / very bad evaluation of health status Prevalence of Diabetes
Prevalence of Hypertension
Restriction of activities for health reasons Northeast Region
Bad / very bad evaluation of health status Prevalence of Diabetes
Prevalence of Hypertension
Restriction of activities for health reasons Southeast Region
Bad / very bad evaluation of health status Prevalence of Diabetes
Prevalence of Hypertension
Restriction of activities for health reasons South Region
Bad / very bad evaluation of health status Prevalence of Diabetes
Prevalence of Hypertension
Restriction of activities for health reasons Center West Region
Bad / very bad evaluation of health status Prevalence of Diabetes
Prevalence of Hypertension
Restriction of activities for health reasons Brazil
Bad / very bad evaluation of health status Prevalence of Diabetes
Prevalence of Hypertension
Restriction of activities for health reasons
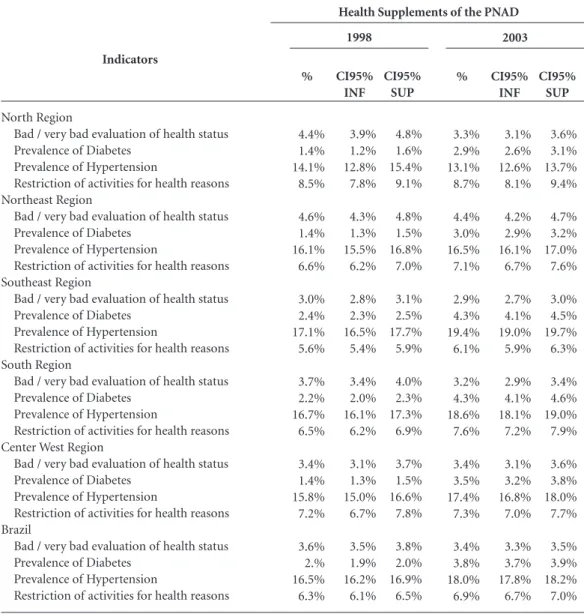
Table 1. Estimation of indicators on health needs and respective confidence intervals, by Greater Regions of
Brazil, 2003, 2008 and 2013.
%
4.4% 1.4% 14.1% 8.5%
4.6% 1.4% 16.1% 6.6%
3.0% 2.4% 17.1% 5.6%
3.7% 2.2% 16.7% 6.5%
3.4% 1.4% 15.8% 7.2%
3.6% 2.% 16.5% 6.3%
CI95% INF
3.9% 1.2% 12.8% 7.8%
4.3% 1.3% 15.5% 6.2%
2.8% 2.3% 16.5% 5.4%
3.4% 2.0% 16.1% 6.2%
3.1% 1.3% 15.0% 6.7%
3.5% 1.9% 16.2% 6.1%
CI95% SUP
4.8% 1.6% 15.4% 9.1%
4.8% 1.5% 16.8% 7.0%
3.1% 2.5% 17.7% 5.9%
4.0% 2.3% 17.3% 6.9%
3.7% 1.5% 16.6% 7.8%
3.8% 2.0% 16.9% 6.5%
it continues
%
3.3% 2.9% 13.1% 8.7%
4.4% 3.0% 16.5% 7.1%
2.9% 4.3% 19.4% 6.1%
3.2% 4.3% 18.6% 7.6%
3.4% 3.5% 17.4% 7.3%
3.4% 3.8% 18.0% 6.9%
CI95% INF
3.1% 2.6% 12.6% 8.1%
4.2% 2.9% 16.1% 6.7%
2.7% 4.1% 19.0% 5.9%
2.9% 4.1% 18.1% 7.2%
3.1% 3.2% 16.8% 7.0%
3.3% 3.7% 17.8% 6.7%
CI95% SUP
3.6% 3.1% 13.7% 9.4%
4.7% 3.2% 17.0% 7.6%
3.0% 4.5% 19.7% 6.3%
3.4% 4.6% 19.0% 7.9%
3.6% 3.8% 18.0% 7.7%
3.5% 3.9% 18.2% 7.0%
1998 2003
Health Supplements of the PNAD
majority of indicators in the Health Supplement of the PNAD, thus maintaining the historical se-ries of 1998, 2003, and 2008”.
Compared to administrative data, data from health surveys constitutes a more adequate way to estimate health needs and the prevalence of specific problems, such as access to health ser-vices and the type of expense in their use, to the degree that they are based on the total popula-tion and not just the segment that utilized health services.
The PNS data of 2013 indicates an increase in the proportion of people that evaluate their health status as bad or very bad in relation to the
V
ia
ca
v
a F
, B
Indicators
North Region
Bad / very bad evaluation of health status Prevalence of Diabetes
Prevalence of Hypertension
Restriction of activities for health reasons Northeast Region
Bad / very bad evaluation of health status Prevalence of Diabetes
Prevalence of Hypertension
Restriction of activities for health reasons Southeast Region
Bad / very bad evaluation of health status Prevalence of Diabetes
Prevalence of Hypertension
Restriction of activities for health reasons South Region
Bad / very bad evaluation of health status Prevalence of Diabetes
Prevalence of Hypertension
Restriction of activities for health reasons Center West Region
Bad / very bad evaluation of health status Prevalence of Diabetes
Prevalence of Hypertension
Restriction of activities for health reasons Brazil
Bad / very bad evaluation of health status Prevalence of Diabetes
Prevalence of Hypertension
Restriction of activities for health reasons
Table 1. continuation
%
3.9% 3.7% 14.2% 9.3%
4.6% 4.0% 18.2% 8.6%
3.3% 5.9% 21.7% 7.9%
3.9% 5.3% 21.0% 8.7%
3.3% 4.7% 18.6% 8.3%
3.8% 5.1% 19.9% 8.3%
CI95% INF
3.6% 3.5% 13.4% 8.5%
4.4% 3.9% 17.8% 8.2%
3.2% 5.7% 21.4% 7.6%
3.6% 5.0% 20.5% 8.3%
3.1% 4.4% 18.1% 7.8%
3.7% 5.0% 19.7% 8.2%
CI95% SUP
4.2% 4.0% 15.0% 10.0%
4.8% 4.2% 18.5% 9.0%
3.4% 6.1% 22.1% 8.1%
4.2% 5.5% 21.5% 9.1%
3.5% 4.9% 19.1% 8.8%
3.9% 5.2% 20.1% 8.5%
Source: IBGE, 1998, 2003, 2008 and 2013.
%
4.7% 4.3% 14.5% 5.8%
6.2% 5.4% 19.4% 7.8%
3.2% 7.1% 23.3% 6.2%
4.0% 6.2% 22.9% 8.4%
4.0% 6.5% 21.2% 7.0%
4.3% 6.2% 21.4% 7.0%
CI95% INF
4.2% 3.6% 13.4% 5.4%
5.8% 4.9% 18.3% 7.5%
3.0% 6.5% 22.2% 5.8%
3.6% 5.3% 21.3% 7.8%
3.6% 5.7% 19.9% 6.5%
4.2% 5.8% 20.8% 6.8%
CI95% SUP
5.2% 5.0% 15.6% 6.3%
6.6% 5.9% 20.5% 8.2%
3.5% 7.7% 24.4% 6.6%
4.5% 7.1% 24.5% 9.0%
4.4% 7.3% 22.5% 7.5%
4.5% 6.6% 22.0% 7.2%
2008 2013
Health Supplements
of the PNAD PNS
It must be observed that this increase was not accompanied by an increase in the percentage of persons with restriction of activities for health reasons, whose trend was toward a decrease in all of the regions, especially the North, Southeast, and Center West.
The prevalence of diabetes and hypertension were obtained by comparing the information on adults selected by the PNS with the information furnished by household members present at the moment of the PNADs interviews regarding those persons 18 years and older. The trend of increase is probably due to the greater access to health services and more available information
about health evaluation, which can also explain the maintenance of regional inequalities that al-ways favor the regions with more resources9. For
diabetes, the estimated rates are very close, in the area of 7%, to the values divulged by the OECD regarding the population of persons between 20 and 79 years old. In the case of hypertension, the trend towards increase was also verified by the PNS, with greater results for the Southeast, South, and Center West. For the total population, the prevalence in 2013 was in the order of 21%, a lower percentage than in the other countries10,11.
ole tiv a, 21(2):351-370, 2016 Indicators North Region
Coverage by health plan
Medical consultation in the last 12 months Dental consultation in the last 12 months Hospital stay in the last 12 months Has never visited a dentist
Use of health services in the last two weeks Household coverage by PSF
Northeast Region Coverage by health plan
Medical consultation in the last 12 months Dental consultation in the last 12 months Hospital stay in the last 12 months Has never visited a dentist
Use of health services in the last two weeks Household coverage by PSF
Southeast Region Coverage by health plan
Medical consultation in the last 12 months Dental consultation in the last 12 months Hospital stay in the last 12 months Has never visited a dentist
Use of health services in the last two weeks Household coverage by PSF
South Region
Coverage by health plan
Medical consultation in the last 12 months Dental consultation in the last 12 months Hospital stay in the last 12 months Has never visited a dentist
Use of health services in the last two weeks Household coverage by PSF
Center West Region Coverage by health plan
Medical consultation in the last 12 months Dental consultation in the last 12 months Hospital stay in the last 12 months Has never visited a dentist
Use of health services in the last two weeks Household coverage by PSF
Brazil
Coverage by health plan
Medical consultation in the last 12 months Dental consultation in the last 12 months Hospital stay in the last 12 months Has never visited a dentist
Use of health services in the last 15 days Household coverage by PSF
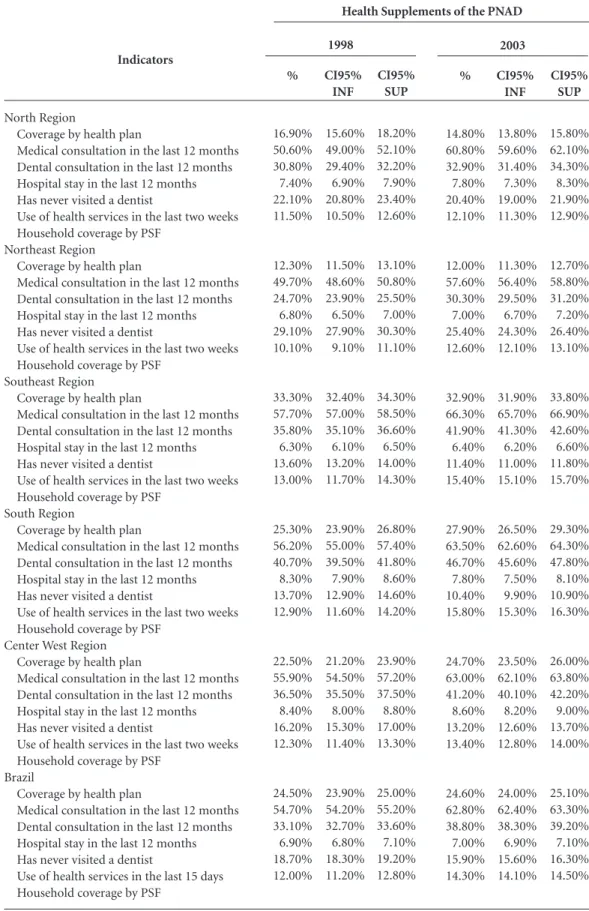
Table 2. Estimation of indicators on access and use of health services and respective confidence intervals
according to Greater Regions of Brazil, 1998, 2003, 2008 and 2013.
% 16.90% 50.60% 30.80% 7.40% 22.10% 11.50% 12.30% 49.70% 24.70% 6.80% 29.10% 10.10% 33.30% 57.70% 35.80% 6.30% 13.60% 13.00% 25.30% 56.20% 40.70% 8.30% 13.70% 12.90% 22.50% 55.90% 36.50% 8.40% 16.20% 12.30% 24.50% 54.70% 33.10% 6.90% 18.70% 12.00% CI95% INF 15.60% 49.00% 29.40% 6.90% 20.80% 10.50% 11.50% 48.60% 23.90% 6.50% 27.90% 9.10% 32.40% 57.00% 35.10% 6.10% 13.20% 11.70% 23.90% 55.00% 39.50% 7.90% 12.90% 11.60% 21.20% 54.50% 35.50% 8.00% 15.30% 11.40% 23.90% 54.20% 32.70% 6.80% 18.30% 11.20% CI95% SUP 18.20% 52.10% 32.20% 7.90% 23.40% 12.60% 13.10% 50.80% 25.50% 7.00% 30.30% 11.10% 34.30% 58.50% 36.60% 6.50% 14.00% 14.30% 26.80% 57.40% 41.80% 8.60% 14.60% 14.20% 23.90% 57.20% 37.50% 8.80% 17.00% 13.30% 25.00% 55.20% 33.60% 7.10% 19.20% 12.80% it continues % 14.80% 60.80% 32.90% 7.80% 20.40% 12.10% 12.00% 57.60% 30.30% 7.00% 25.40% 12.60% 32.90% 66.30% 41.90% 6.40% 11.40% 15.40% 27.90% 63.50% 46.70% 7.80% 10.40% 15.80% 24.70% 63.00% 41.20% 8.60% 13.20% 13.40% 24.60% 62.80% 38.80% 7.00% 15.90% 14.30% CI95% INF 13.80% 59.60% 31.40% 7.30% 19.00% 11.30% 11.30% 56.40% 29.50% 6.70% 24.30% 12.10% 31.90% 65.70% 41.30% 6.20% 11.00% 15.10% 26.50% 62.60% 45.60% 7.50% 9.90% 15.30% 23.50% 62.10% 40.10% 8.20% 12.60% 12.80% 24.00% 62.40% 38.30% 6.90% 15.60% 14.10% CI95% SUP 15.80% 62.10% 34.30% 8.30% 21.90% 12.90% 12.70% 58.80% 31.20% 7.20% 26.40% 13.10% 33.80% 66.90% 42.60% 6.60% 11.80% 15.70% 29.30% 64.30% 47.80% 8.10% 10.90% 16.30% 26.00% 63.80% 42.20% 9.00% 13.70% 14.00% 25.10% 63.30% 39.20% 7.10% 16.30% 14.50% 1998 2003
V ia ca v a F , B Indicators North Region
Coverage by health plan
Medical consultation in the last 12 months Dental consultation in the last 12 months Hospital stay in the last 12 months Has never visited a dentist
Use of health services in the last two weeks Household coverage by PSF
Northeast Region Coverage by health plan
Medical consultation in the last 12 months Dental consultation in the last 12 months Hospital stay in the last 12 months Has never visited a dentist
Use of health services in the last two weeks Household coverage by PSF
Southeast Region Coverage by health plan
Medical consultation in the last 12 months Dental consultation in the last 12 months Hospital stay in the last 12 months Has never visited a dentist
Use of health services in the last two weeks Household coverage by PSF
South Region
Coverage by health plan
Medical consultation in the last 12 months Dental consultation in the last 12 months Hospital stay in the last 12 months Has never visited a dentist
Use of health services in the last two weeks Household coverage by PSF
Center West Region Coverage by health plan
Medical consultation in the last 12 months Dental consultation in the last 12 months Hospital stay in the last 12 months Has never visited a dentist
Use of health services in the last two weeks Household coverage by PSF
Brazil
Coverage by health plan
Medical consultation in the last 12 months Dental consultation in the last 12 months Hospital stay in the last 12 months Has never visited a dentist
Use of health services in the last 15 days Household coverage by PSF
Table 2. continuation
% 13.20% 61.00% 32.90% 7.70% 17.10% 10.80% 53.90% 13.20% 63.90% 34.80% 6.90% 17.50% 12.20% 67.70% 35.60% 71.30% 42.20% 6.70% 8.40% 15.70% 38.50% 30.00% 68.90% 48.00% 7.60% 7.60% 15.80% 53.00% 24.60% 66.30% 42.30% 8.80% 9.70% 13.20% 50.10% 25.90% 67.70% 40.20% 7.10% 11.70% 14.20% 50.90% CI95% INF 12.10% 59.30% 31.30% 7.00% 15.90% 10.00% 50.20% 12.50% 63.00% 34.00% 6.60% 16.80% 11.80% 65.60% 34.70% 70.80% 41.50% 6.50% 8.10% 15.30% 36.90% 28.60% 67.90% 46.90% 7.30% 7.20% 15.20% 50.70% 23.40% 65.40% 41.20% 8.40% 9.20% 12.70% 47.80% 25.40% 67.30% 39.80% 7.00% 11.40% 13.90% 49.90% CI95% SUP 14.30% 62.60% 34.50% 8.30% 18.30% 11.50% 57.70% 13.90% 64.90% 35.60% 7.20% 18.20% 12.60% 69.80% 36.60% 71.80% 42.80% 6.90% 8.70% 16.10% 40.20% 31.40% 69.90% 49.10% 8.00% 8.00% 16.50% 55.20% 25.80% 67.30% 43.40% 9.20% 10.20% 13.80% 52.40% 26.40% 68.10% 40.60% 7.30% 11.90% 14.40% 52.00%
Fonte: IBGE, 1998, 2003, 2008 and 2013.
% 13.30% 61.40% 34.40% 5.80% 18.20% 9.60% 53.50% 15.50% 66.30% 37.50% 5.60% 15.20% 12.80% 68.10% 36.90% 75.80% 48.30% 5.70% 6.80% 16.60% 48.30% 32.80% 73.80% 51.90% 7.50% 6.70% 17.60% 58.40% 30.40% 69.50% 44.90% 7.40% 9.50% 13.30% 54.40% 27.90% 71.20% 44.40% 6.00% 10.30% 14.90% 56.10% CI95% INF 12.20% 59.90% 33.00% 5.40% 16.40% 9.00% 50.80% 14.50% 65.50% 36.50% 5.30% 14.40% 12.30% 66.50% 35.20% 74.80% 47.10% 5.30% 6.30% 16.00% 45.90% 30.40% 72.60% 50.20% 7.00% 5.90% 16.60% 55.20% 28.70% 68.50% 43.60% 7.00% 8.70% 12.60% 52.10% 27.10% 70.70% 43.80% 5.80% 9.90% 14.50% 54.90% CI95% SUP 14.40% 62.80% 35.90% 6.30% 19.90% 10.20% 56.20% 16.50% 67.20% 38.40% 5.80% 16.00% 13.30% 69.5% 38.6% 76.8% 49.5% 6.1% 7.3% 17.3% 50.7% 35,20% 74,90% 53,50% 8,00% 7,50% 18,50% 61,60% 32,10% 70,60% 46,20% 7,90% 10,20% 13,90% 56.70% 28,70% 71,70% 45,10% 6,30% 10,60% 15,20% 57.40% 2008 2013
Suplementos de Saúde
ole
tiv
a,
21(2):351-370,
2016
Type of Use
North Region
Hospitalization in the last 12 months
Use of health services in the last two weeks
Northeast Region
Hospitalization in the last 12 months
Use of health services in the last two weeks
Southeast Region
Hospitalization in the last 12 months
Use of health services in the last two weeks
South Region
Hospitalization in the last 12 months
Use of health services in the last two weeks
Center West Region Hospitalization in the last 12 months
Use of health services in the last two weeks
Brazil
Hospitalization in the last 12 months
Use of health services in the last two weeks
Table 3. Estimation of indicators on methods of payment for services and respective confidence intervals by
Greater Regions of Brazil, 1998, 2003, 2008 and 2013.
% 13.8% 16.7% 68.1% 14.4% 15.1% 56.8% 5.2% 13.3% 76.8% 10.0% 16.8% 61.8% 11.8% 34.2% 54.6% 14.6% 34.6% 41.9% 27.8% 24.2% 62.4% 25.5% 25.4% 50.4% 23.5% 22.9% 56.2% 22.5% 21.6% 46.4% 13.9% 24.6% 63.1% 15.8% 26.8% 49.3% CI95% INF 10.2% 11.7% 61.0% 11.5% 10.1% 49.6% 4.4% 10.1% 73.2% 9.0% 12.4% 57.5% 10.5% 28.3% 47.1% 13.2% 30.4% 33.8% 24.5% 20.6% 59.0% 22.8% 21.3% 46.5% 19.8% 17.6% 51.6% 19.3% 15.8% 40.1% 12.7% 21.0% 58.9% 14.9% 23.3% 43.9% CI95% SUP 17.3% 23.1% 74.5% 17.8% 21.8% 63.7% 6.1% 17.3% 80.2% 11.1% 22.5% 66.0% 13.2% 40.7% 61.9% 16.1% 39.1% 50.5% 31.3% 28.2% 65.7% 28.3% 30.0% 54.2% 27.5% 29.2% 60.6% 26.1% 28.8% 52.9% 15.3% 28.6% 67.2% 16.8% 30.6% 54.7% it continues % 8.8% 14.7% 76.0% 10.7% 14.9% 66.9% 5.1% 12.2% 80.1% 10.4% 14.9% 69.2% 8.6% 34.5% 58.9% 13.3% 33.3% 51.4% 18.7% 25.8% 64.7% 24.4% 26.9% 53.5% 16.0% 22.0% 65.4% 22.0% 22.8% 55.2% 9.9% 24.3% 67.6% 14.8% 26.0% 57.2% CI95% INF 6.8% 12.9% 72.6% 9.4% 13.5% 64.6% 4.5% 11.1% 78.1% 9.7% 13.8% 67.3% 7.9% 32.9% 57.3% 12.5% 32.1% 50.0% 17.2% 23.9% 62.4% 22.8% 25.3% 51.3% 14.3% 20.1% 62.7% 20.2% 21.0% 52.7% 9.5% 23.5% 66.6% 14.3% 25.3% 56.3% CI95% SUP 11.2% 16.7% 79.1% 12.2% 16.4% 69.1% 5.8% 13.4% 81.9% 11.1% 16.0% 71.0% 9.3% 36.1% 60.5% 14.0% 34.5% 52.8% 20.4% 27.8% 67.0% 26.1% 28.6% 55.7% 18.0% 23.9% 68.0% 23.8% 24.7% 57.7% 10.4% 25.2% 68.6% 15.3% 26.8% 58.1% 1998 2003
Health Supplements of the PNAD
Main form of payment
Out of Pocket Health Plan SUS Out of Pocket Health Plan SUS
Out of Pocket Health Plan SUS Out of Pocket Health Plan SUS
Out of Pocket Health Plan SUS Out of Pocket Health Plan SUS
Out of Pocket Health Plan SUS Out of Pocket Health Plan SUS
Out of Pocket Health Plan SUS Out of Pocket Health Plan SUS
V ia ca v a F , B
Type of Use
North Region
Hospitalization in the last 12 months
Use of health services in the last two weeks
Northeast Region
Hospitalization in the last 12 months
Use of health services in the last two weeks
Southeast Region
Hospitalization in the last 12 months
Use of health services in the last two weeks
South Region
Hospitalization in the last 12 months
Use of health services in the last two weeks
Center West Region Hospitalization in the last 12 months
Use of health services in the last two weeks
Brazil
Hospitalization in the last 12 months
Use of health services in the last two weeks
Tabela 3. continuação
% 7.6% 12.7% 78.5% 13.7% 15.2% 66.7% 5.7% 12.7% 82.1% 14.0% 16.1% 68.6% 9.3% 35.4% 58.6% 18.1% 33.3% 49.9% 16.6% 26.2% 65.0% 26.9% 26.1% 53.5% 18.3% 23.5% 65.0% 24.9% 24.2% 56.2% 10.1% 24.7% 68.3% 18.7% 26.2% 56.5% CI95% INF 6.4% 11.0% 75.7% 12.0% 13.5% 64.0% 5.1% 11.7% 80.8% 13.1% 15.1% 67.0% 8.6% 33.8% 57.0% 17.3% 32.1% 48.6% 15.0% 24.0% 62.5% 25.4% 24.6% 51.5% 16.8% 21.8% 62.9% 23.5% 22.5% 53.9% 9.7% 23.9% 67.4% 18.2% 25.5% 55.6% CI95% SUP 9.0% 14.7% 81.0% 15.5% 17.0% 69.3% 6.4% 13.8% 83.3% 14.9% 17.1% 70.1% 10.1% 37.0% 60.2% 19.0% 34.5% 51.2% 18.3% 28.5% 67.4% 28.5% 27.7% 55.4% 19.9% 25.4% 67.1% 26.4% 26.0% 58.4% 10.6% 25.6% 69.2% 19.3% 26.9% 57.3%
Source: IBGE, 1998, 2003, 2008 and 2013
% 9.2% 15.3% 73.9% 11.5% 18.4% 69.1% 8.1% 16.0% 76.5% 12.0% 18.3% 69.0% 9.7% 35.4% 58.8% 13.7% 35.9% 55.1% 15.1% 29.5% 63.8% 21.5% 28.9% 58.1% 15.4% 29.5% 61.6% 19.2% 30.1% 58.7% 10.8% 27.2% 65.7% 14.9% 29.2% 59.9% CI95% INF 7.4% 13.2% 70.9% 9.9% 16.2% 66.2% 6.8% 14.2% 74.0% 11.0% 16.7% 67.0% 8.0% 32.0% 55.0% 12.3% 33.3% 52.4% 12.6% 25.9% 59.3% 19.0% 26.2% 54.8% 13.2% 26.3% 58.3% 17.0% 27.4% 55.6% 9.8% 25.7% 63.9% 14.0% 27.8% 58.4% CI95% SUP 11.4% 17.6% 76.7% 13.3% 20.8% 71.8% 9.7% 18.0% 78.9% 13.1% 20.0% 70.8% 11.8% 38.9% 62.5% 15.2% 38.6% 57.7% 18.1% 33.3% 68.0% 24.1% 31.8% 61.2% 17.8% 32.9% 64.8% 21.7% 32.9% 61.8% 11.8% 28.9% 67.4% 15.7% 30.6% 61.4% 2008 2013 Main form of payment
Out of Pocket Health Plan SUS Out of Pocket Health Plan SUS
Out of Pocket Health Plan SUS Out of Pocket Health Plan SUS
Out of Pocket Health Plan SUS Out of Pocket Health Plan SUS
Out of Pocket Health Plan SUS Out of Pocket Health Plan SUS
Out of Pocket Health Plan SUS Out of Pocket Health Plan SUS
Out of Pocket Health Plan SUS Out of Pocket Health Plan SUS Indicators
Health Supplements of
ole
tiv
a,
21(2):351-370,
2016
furthermore the responses to the questions about hypertension, diabetes, and preventative cancer exams had been given by the individuals selected, the estimates generated should be more precise. However, the much smaller sample size of the PNS – almost one third of the households com-pared to the PNADs – produced estimates with greater confidence intervals. On the other hand, since the PNS sample was made by selecting cen-sus sectors from the Master Sample designated by the Integrated System of Household Research of the IBGE (SIPD), it is possible that adjustments and corrective factors that are still being devel-oped by the IBGE will, once applied, produce dif-ferent results than those presented here.
Although the aging of the population could also be a factor directly related to major health needs, its possible effect would be very small con-sidering that the time elapsed was only five years between the surveys. According to IBGE data for the country as a whole, between 2008 and 2013 there was an increase of 1.5% in the proportion of persons 60 years or older. In the samples of the 208 and 2013 surveys there was an increase of 2.1% in the same age bracket.
As other analyses of PNAD data has already shown, health needs are always greater in the more underprivileged population groups, which is generally seen when comparing population groups categorized by household income12. In
spite of having been collected, the household in-come data of the PNS had not yet been divulged at the time of writing.
As is known, health conditions are correlated with access to health services, which is mediat-ed by the public and private service delivery and socioeconomic level of the population13. Gradual
increases in the use of services have been ver-ified since 1998 in all the indicators of access, whether in coverage of public programs like the Family Health Strategy, or private ones such as health plans. Indicators that use 12 months of observation such as medical and dental consul-tations present a systematic increase throughout the surveys of the period 1998/2013. Survey data analyzed by different authors has already prov-en an increase in access to health services, as much in the public sector as in the private sector financed by public or private resources, as well as in the sector of supplementary health14-16. In
the case of specific uses such as mammograms, in spite of the increases between 2008 and 2013 the geographic inequalities are still great when we consider the proportion of women aged 50 to 69 years that, according to INCA, should have
re-ceived a mammogram every two years, especially in the North (39%) and Northeast (48%) regions where the proportion is very insufficient. In the case of cervical cancer prevention, the differences in the percentage of women between 25 and 64 years old that should have an exam every 3 years are less, but there were practically no changes in the period of 2008 to 2013. As stated earlier, the PNS indicator was calculated using information furnished by the women themselves, while the PNADs can also be based on information from other household residents.
When we analyze the prevalence of use of ser-vices, in the two weeks prior to the interviews, it is observed that at the national level, since 2003, the surveys have detected that close to 15% of the population confirmed they had used some type of services. In comparison to previous years, this stability had already been detected, such as in the difference of around 25% observed in the 2008 data between groups of the first and last wealth quintile. Regarding the type of services utilized, differences in form – such as how the alternatives of types of services sought were listed by the PNS – prevents the comparison with the PNAD data12.
The changes in the source of payment for health services in the last two weeks show that the Brazilian population is using more SUS ser-vices than in 2008, as well as receiving more care via health plans and with less out of pocket pay-ments. It is important to note that SUS’s presence increased in the more wealthy regions, and that increases in health plans occurred in a signifi-cant way in the Center West. This data indicates an inversion of the trend that had been observed regarding the stability in the use of plans and of SUS, and the increase in out of pocket payment between 2003 and 2008. As noted in Chart 1, in the PNS it is understood that we should not con-sider as disbursements those payments that will be reimbursed entirely by health plans, and this could be causing an underreporting of this in-formation. It is known, however, that contracts which guarantee complete reimbursement are very uncommon when we consider the whole population and not only the higher income seg-ment.
In the case of hospitalizations, the trend spanning the period 1998 – 2013 is also toward a decrease in direct disbursements and services received via SUS. An increase in hospitalizations through health plans was verified only in the Center West region.
V
ia
ca
v
a F
, B
Egan BM, Zhao Y, Axon RN. US Trends in Prevalence, Awareness, Treatment, and Control of Hypertension, 1988-2008. JAMA 2010;303(20):2043-2050.
Viacava F. Acesso e uso de serviços de saúde pelos brasi-leiros. RADIS Comunicação Social 2010; 96:12-19. Travassos C, De Castro MSM. Determinantes e Desi-gualdades Sociais no Acesso e na Utilização dos Servi-ços de Saúde. In: Giovanella L, organizadora. Políticas e
Sistema de Saúde no Brasil. Rio de Janeiro: Ed. Fiocruz;
2008.
Gragnolati M, Lindelow M, and Couttolenc B. Twenty Years of Health System Reform in Brazil: An Assessment
of the Sistema Único de Saúde. Washington: The World
Bank; 2013.
Paim J, Travassos CM, Almeida CM, Bahia L, Macinko J. The Brazilian health system: history, advances, and challenge Lancet 2011; 377(9779):1778-1797.
Marten R, McIntyre D, Travassos C, Shishkin S, Long-de W, Reddy S, Vega J. An assessment of progress to-wards universal health coverage in Brazil, Russia, In-dia, China, and South Africa (BRICS). Lancet 2014; 384(9960):2164-2171.
Article submitted 05/10/2015 Approved 06/11/2015
Final version submitted 08/11/2015 11.
12. 13.
14.
15.
16. References
Datasus. Rede Nacional de Informações de Saúde (RNIS)
[acessado 2015 out 5]. Disponível em: http://www. datasus.gov.br/RNIS/datasus.htm#RNIS
Instituto Brasileiro de Geografia e Estatística (IBGE).
PNAD: 1981 questionário de saúde.Rio de Janeiro:
IBGE; 1981.
Instituto Brasileiro de Geografia e Estatística (IBGE).
Acesso e utilização de serviços de saúde: 1998. Rio de
Ja-neiro: IBGE; 2000.
Instituto Brasileiro de Geografia e Estatística (IBGE).
Acesso e utilização de serviços de saúde: 2003. Rio de
Ja-neiro: IBGE; 2005.
Instituto Brasileiro de Geografia e Estatística (IBGE).
Um Panorama da saúde no Brasil: acesso e utilização dos serviços, condições de saúde e fatores de risco e proteção à
saúde: 2008. Rio de Janeiro: IBGE; 2010.
REDE Interagencial de Informação para a Saúde (RIP-SA). Indicadores básicos para a saúde no Brasil: conceitos
e aplicações. 2ª ed. Brasília: Organização
Pan-America-na da Saúde; 2008.
Instituto Brasileiro de Geografia e Estatística (IBGE).
Pesquisa Nacional de Saúde 2013. Acesso e utili-zação dos serviços de saúde, acidentes e violências
Brasil, Grandes Regiões e Unidades da Federação. Rio de
Janeiro: IBGE; 2015.
Szwarcwald CL, Malta DC, Pereira CA, Vieira MLFP, Conde WL, Souza Júnior PRB, Damacena GN, Azeve-do LO, Silva GA, Theme Filha MM, Lopes CS, Romero DE, Almeida WS, Monteiro CA. Pesquisa Nacional de Saúde no Brasil: concepção e metodologia de aplicação.
Cien Saude Colet 2015; 19(2):333-342.
Travassos C, Oliveira EXG, Viacava F. Desigualdades geográficas e sociais no acesso aos serviços de saúde no Brasil: 1998 e 2003. Cien Saude Colet 2006; 11(4):975-986.
Organisation for Economic Co-operation and Develo-pment (OECD). Health at a Glance 2013: OECD
Indi-cators. Paris: OECD; 2013.
1.
2.
3.
4.
5.
6.
7.
8.
9.
10.
geographic regions are consistent with the se-ries of indicators provided by the PNADs, which should still be evaluated for other levels of geo-graphic organization such as federative units and municipalities of the capitals. The absence of data on per capita household income impedes the analysis of those factors most relevant to the evaluation of the health system’s performance: the trends in social inequalities related to health needs, use, and access to health services.
In spite of improvement in all of the regions, the magnitude of regional differences still mani-fests in all the analyzed dimensions when we
ob-serve the data in the North and Northeast regions in relation to the others, whether in the evalua-tion of health status, or in the lesser use of health services that can be related to decreased preva-lence of the chronic diseases analyzed.
Collaborations