AR
TICLE
1 Secretaria de Pós-Graduação, Centro de Educação Física e Esporte, Universidade Estadual de Londrina. Rodovia Celso Garcia Cid Pr 445/km 380, Campus Universitário. 86057-970 Londrina PR Brasil.
Self-perceived health among workers at a University Hospital
and associations with indicators of adiposity, arterial blood
pressure and physical activity habits
Abstract It has been shown that self-perceived health has a close relationship with indicators of morbidity and mortality. Since there is a lack of information on the self-perceived health status of hospital workers, the objective of this study was to determine the prevalence of satisfaction with health among people working at a University Hos-pital (UH) and its associations with indicators of adiposity, arterial blood pressure (BP) and phys-ical activity (PA). A total of 380 adults took part in the study, with ages ranging from 20 to 59 and a mean age of 43.92 (SD = 8.46) years. Self-per-ceived health was assessed using a question from the “WHOQOL-bref ” questionnaire. Overall satisfaction with health was 60.8%, and women reported lower satisfaction than men. An analy-sis adjusted for sex showed that having a healthy BMI was associated with the highest rate of sat-isfaction with health (PR = 1.478 [95%CI: 1.272 – 1.717]), followed by WC (PR = 1.323 [95%CI: 1.135 – 1.541]). Neither BP nor PA were associ-ated with self-perceived health. It was concluded that the UH workers are aware of risks to their health, but that they do not recognize the impor-tance of maintaining healthy blood pressure or of engaging in regular PA in order to delay onset of chronic conditions that could be harmful to them.
Keywords Self-perceived health, Risk factors, Ab-dominal obesity, Physical activity
Denilson Braga Porto 1
Gustavo Aires de Arruda 1
Leandro Ricardo Altimari 1
P
o
r
Introduction
During their daily routines, the nature of health-care professionals’ work means that they witness at irst hand the rapid progression of non-trans-missible chronic diseases (NTCD), since they deal with patients with a wide spectrum of phys-ical impairment. As such, their perceptions of the health-disease process are formed as a function of the experience they accumulate, as mediated by the social, cultural and historical context in which they live, with the result that healthcare professionals make judgments and arrive at in-terpretations about their own physical and
emo-tional wellbeing1.
With relation to this experience, the Brazilian Ministry of Health conducted an important sur-vey in 2006 in all 26 of Brazil’s state capitals plus the Distrito Federal and found that the propor-tion of people who self-rate their health as poor is ive times larger in the presence of one NTCD and that the odds ratio for people who reported having two or more NTCDs showed that self-rat-ed poor health was 28 times more common in
this case2. Notwithstanding, these results must
be interpreted in the light of the factors that in-tervene in self-perceived health. This is because differences in economic, social and behavioral factors and, more than anything, differences in educational level appear to interfere with
pat-terns of self-perceived health3-5.
More speciically, a positive and signiicant association has been described between low levels of education and increased prevalence of self-perceived poor health and with an increased
propensity to morbidity and mortality2,6.
It is therefore to be presumed that these out-comes would be less accentuated among profes-sionals who work in healthcare, since such people normally have greater knowledge about NTCD and are more sensitive to the physical changes that they trigger, taking action to prevent the emergence/progression of these diseases, partic-ularly when it is considered that these diseases manifest asymptomatically.
It is important to point out that people who are not satisied with their health may use health-care services with greater frequency and be
ab-sent from work more often7, may exhibit larger
numbers of chronic diseases2,3, and be at a greater
risk of mortality8,9, compared with those who
re-port satisfactory self-perceived health status2,7-9.
In view of the above, collecting data on the self-perceived health of workers at a hospital could be of help for planning adoption of
pre-ventative measures, avoiding exacerbation of certain diseases, particularly those of a chronic degenerative character. The objective of this sci-entiic investigation was therefore to determine the prevalence of satisfaction with health among workers at a University Hospital (UH) and its association with indicators of adiposity, arterial blood pressure (BP) and physical activity habits (PA).
Materials and methods
Sample
This study was conducted at the UH in Lon-drina, PR, Brazil, which is an institution belong-ing to the Universidade Estadual de Londrina (UEL). It is a descriptive study with a cross-sec-tional design investigating a population com-prising permanent staff, performing a variety of jobs, who were assigned to the UH at the time the study was conducted.
The total number of workers was obtained by requesting the Human Resources Department to provide a list of all employees, plus a break-down by department of the numbers of workers at the hospital. This list showed that the UH had a total of 1,460 workers, broken down as follows:
Nursing Department-ND (n = 695); Clinical
De-partment-CD (n = 384); Administrative
Depart-ment-AD (n = 320) and Management
Depart-ment-MD (n = 61). These totals do not include
employees assigned to the outpatients specialties clinics at the UEL Hospital de Clínicas, since the decision had been taken to only study the UH.
A minimum sample of interviewees was estimated based on the assumption of a 25%
prevalence of dissatisfaction with health10 and
4% sampling error, with a 95% conidence level, which resulted in a sample size of 344 workers, but this igure was increased by 10% to account for possible losses. This calculation resulted in a minimum of 378 study participants, but data collection was actually terminated after 380 men and women had taken part, selected at random from all of the hospital’s sectors.
Workers were recruited for voluntary par-ticipation, taking into account the number of workers in each department, and interviews were conducted during all three shifts (morning, after-noon and night) at each worker’s place of work.
investiga-aúd
e C
ole
tiv
a,
21(4):1113-1122,
2016
tion. Workers were considered ineligible if they were on temporary assignments at other insti-tutions or were taking advantage of temporary leave beneits for training or ongoing education, or were on any other type of leave, including un-paid leave.
The study was conducted in accordance with the standards required by the Helsinki Declara-tion and was approved by the Research Ethics Committee at the UEL. Before being interviewed, all workers who had agreed to participate read and signed a free and informed consent form.
Educational and Economic Factors
Data on educational attainment and owner-ship of consumer goods were acquired by admin-istering a questionnaire developed by the Brazil-ian Association of Market Research Companies (ABEP - Associação Brasileira de Empresas de Pesquisa, 2008) and the resulting scores were used to assign interviewees to economic classes
according to the questionnaire’s scale11.
Self-perceived health
The question, “How satisied are you with your health?” was used to collect participants’ self-perceived health status. This question was extracted from the “WHOQOL-bref ” quality of life assessment questionnaire, which was devel-oped internationally in 1998 and was ield-tested
in Brazil by Fleck et al.12 There are ive response
options, but for the purposes of this study they were dichotomized as follows: i) satisied (satis-ied and very satis(satis-ied); and ii) not satis(satis-ied (very dissatisied, dissatisied, and neither satisied nor dissatisied) because none of these report a posi-tive perception of health status.
Adiposity Indicators and Arterial Blood Pressure
Data on the anthropometric variables body mass, height, waist circumference and hip cir-cumference were collected and systolic and dia-stolic arterial blood pressures were measured.
Body mass
Body mass was measured using a lithium bat-tery-powered Plenna brand digital balance with a liquid crystal display (5 x 2.5cm), precision of 100g and capacity of up to 150kg. All participants were requested to wear light clothing, remove
their shoes and stand upright with feet together and arms at their sides.
Height
Height data were obtained by self-report, because the questionnaires were administered at the employees’ workplaces. It has been found that this method provides reliable information in epidemiological studies conducted to monitor
the prevalence of excess weight in populations13.
These measures were then used to calculate body mass index (BMI), by dividing weight (kg) by the square of height (m). The results were clas-siied according to cutoff points recommended by the World Health Organization, so that
peo-ple whose BMI was from 18.5 to 24.9 kg/m2 were
classiied as healthy weight, those with BMI from
25.0 to 29.9 kg/m2 were classiied as overweight
and those with BMI ≥ 30.0 kg/m2 were classiied
as obese.14 In common with other independent
variables investigated in this study, BMI was also dichotomized, i.e. reclassiied as healthy weight or overweight/obesity.
Waist circumference
Waist circumference (WC) was measured using a Cardiomed, non-stretch, iberglass tape measure, with a length of 200 cm and preci-sion of 0.1 cm. The measurement was taken at the midpoint between the iliac crest and the last rib and the cutoff points for classiication were those recommended by the National Institutes of
Health - NHLBI15, by which men were considered
“low risk” when circumference was < 94.0 cm
and “moderate/high risk” when WC was ≥ 94.0
cm, while for women < 80.0 cm corresponded to
“low risk” and ≥ 80.0 cm to “moderate/high risk”.
Circumference of hips
Hip circumference (HC) was measured by running the non-stretch, iberglass tape measure around the hips at the point of greatest protuber-ance, without compressing the skin. The results for WC and HC were used to calculate the waist/ hips ratio (WHR), for which the cutoff points adopted for “normality” were up to 0.95 cm for
men and up to 0.85 cm for women16.
Arterial blood pressure
OM-P
o
r
RON brand, model HEM-742INT, with a dig-ital display and a measurement range of 0 to 299 mmHg. The measurement procedures and classiication of results were conducted in ac-cordance with American Heart Association
rec-ommendations17. Blood pressure (BP) readings
were classiied using the cutoff points: i) systolic
blood pressure (SBP) ≤ 120 mmHg and
diastol-ic blood pressure (DBP) ≤ 80 mmHg for “ideal”;
and SBP > 120 mmHg and DBP > 80 mmHg for “not ideal”. Additionally, people who stated that they had hypertension and were regularly taking antihypertensive medication were also classiied as having “not ideal” BP. If a participants’ systol-ic and diastolsystol-ic were in different categories, they were classiied according to the higher of the two (i.e. as “not ideal”).
All anthropometric measurements were tak-en and all questionnaires administered by two researchers with experience in this type of in-vestigation. Procedures were standardized in the following sequence: (i) contact with heads of departments to obtain permission for data collection; (ii) choice of an appropriate location for administration of the questionnaire and col-lection of the anthropometric data; (iii) reading and signature of the free and informed consent forms; (iv) collection of all responses to the ques-tionnaire; (v) measurement of variables (body mass, waist circumference, hip circumference and blood pressure).
Physical Activity Habits
The sample’s physical activity (PA) hab-its were surveyed using the short form of the International Physical Activity Questionnaire (IPAQ), based on their activity during the
previ-ous week18. The instrument’s four questions are
designed to collect information on the frequen-cy (days/week) and duration (minutes/day) of walking and daily activities that demand physical effort of moderate and vigorous intensity and also on the amount of time (minutes/day) spent on activities that are performed in a sitting posi-tion. All categories are analyzed in four dimen-sions: work-related activity, self-powered trans-port, leisure time activity and domestic activities. Physical activity habits were categorized ac-cording to the consensus proposed by Matsudo
et al. 19, which uses three strata (very active, active
and irregularly active), classiied as follows: Very
active:≥ 5 days/week and ≥ 30 minutes/session of
vigorous activities; and/or ≥ 3 days/week and ≥ 20
minutes/session of vigorous activities plus
mod-erate activities and/or walking ≥ 5 days/week and
30 minutes/session; Active: ≥ 3 days/week and ≥
20 minutes/session of vigorous activities; or ≥ 5
days/week and ≥ 30 minutes/session of
moder-ate activities or walking; or any type of activity
which when summed equals ≥ 5 days/week and ≥
150 minutes/week (walking + moderate +
vigor-ous); Irregularly active: people who do engage in
physical activity, but not enough to be classiied as active, because they do not meet the criteria for frequency or duration. These strata were then
dichotomized as: i) ≥ 150 minutes/week (Active)
and < 150 minutes/week (Irregularly active).
Statistical analysis
The Kolmogorov-Smirnov test was used to test the normality of data. Descriptive statistics were calculated for data analysis. Frequency distri-butions were used to classify the hospital workers in terms of information related to place of work, educational level, economic classiication and self-perceived health status. Means and standard deviations were used to describe the sample.
Stu-dent’s t test for independent samples was used to
compare age and anthropometric characteristics across the sexes. Categorical variables were ana-lyzed with nonparametric statistical methods; the
chi-square test (2) was used to test for associations
between the dependent variable “self-perceived health” and independent variables. Statistical sig-niicance was set in advance as values less than or equal to 5%. Variables that returned p values of <
0.20 in the 2 test were entered into adjusted
anal-yses using Poisson regression with robust variance adjustment and the results were expressed as prev-alence ratios (PR) with their respective 95% con-idence intervals (95% CI). Data were analyzed using the software package Statistical Package for the Social Science (SPSS), version 20.0.
Results
The study analyzed information from 380 adults aged 20 to 59 years. Mean age was 43.92 (SD = 8.46) years, mean height was 1.64 m (SD = 0.09), mean body mass was 73.27 kg (SD = 13.99), and 65.3% of the sample were women. It should be pointed out that, with the exception of the Clin-ical Department, a larger number of employees than initially estimated by the sample size calcu-lation were interviewed in all departments.
inter-aúd e C ole tiv a, 21(4):1113-1122, 2016
viewees who reported that they were satisied or very satisied with their health status, accounting for 60.8% of the sample. With regard to indica-tors of educational attainment, it is of note that the great majority of the interviewees, 91.8%, had completed Secondary or Higher Education. In terms of economic class, it was found that a signiicant majority of the workers were allocated to socioeconomic class B. Table 1 below lists the general characteristics of the sample.
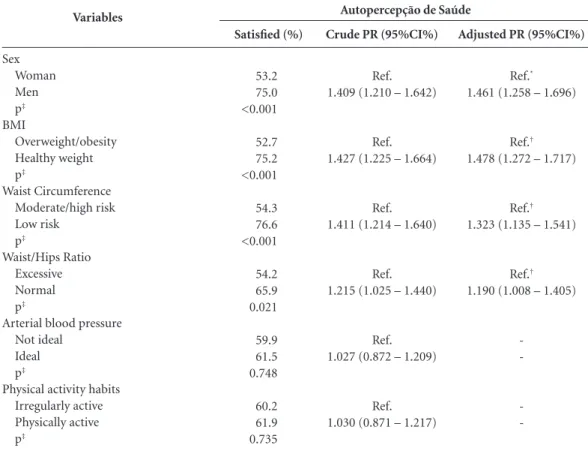
The results of the analyses of associations between self-perceived health and sex, indicators of adiposity, arterial blood pressure and physical activity habits are shown in Table 2.
It will be observed that associations were detected between self-perceived health and sex and between self-perceived health and the indi-cators of adiposity, among which BMI exhibited the strongest association according to the Pois-son Regression analysis. In contrast, neither BP nor PA habits were signiicantly associated with self-perceived health.
Discussion
This study analyzed associations between self-perceived health and sex, indicators of adi-posity, arterial blood pressure and PA habits in 380 employees of the University Hospital (UH) in Londrina,PR, Brazil. The principal indings were as follows: i) almost half of the women and one quarter of the men were not satisied with their health; ii) the highest proportions of dissat-isfaction with health coincided with the higher strata of the indicators of adiposity, i.e., in order of signiicance, BMI, WC, and WHR; iii) self-per-ceived health was not associated with BP or with PA habits; iv) there was a high prevalence of physical inactivity among these hospital workers.
To our knowledge, this is the irst investiga-tion conducted with healthcare workers in the municipal district of Londrina, PR, Brazil, de-signed to determine the prevalence of satisfac-tion with health status among employees of a university hospital. It should be emphasized that the study was conducted with a representative sample of the overall population of 1460 workers and none of the people selected refused to take part in the study.
As can be observed in Table 1, there was a very small percentage of workers who had spent eight years or fewer in education, probably be-cause the majority of the job descriptions for university employees demand graduation from
secondary education as a minimum. With regard to this inding, studies have shown that self-re-ported dissatisfaction with health status is more common among people who are less
well-ed-ucated, poorer and older, irrespective of sex20.
Previous investigations have also detected an in-verse relationship between educational level and reported chronic diseases, inding a 62% higher prevalence of NTCD in the least well-educated
section of the adult population2.
For the purposes of this study, the level of educational attainment of the interviewees was analyzed, rather than the level of the head of
Variables Sex Men Women Self-perceived health Satisied Not satisied Hospital department Nursing department Clinical department Administration department Management department Educational level of interviewee
≤ 8 years of study 9 to 11 years of study
≥ 12 years of study
Economic classiication (ABEP) A (greatest spending power) B
C D
Body mass index (BMI) Healthy weight Overweight/obese Waist Circumference (WC)
Low risk
Moderate/high risk Waist/Hips Ratio (WHR)
Normal Excessive
Arterial blood pressure (BP) Ideal
Not ideal
Physical activity habits (IPAQ) Active Irregularly active n 132 248 231 149 186 73 102 19 31 209 140 52 255 72 1 137 243 111 269 214 166 213 167 134 246 % 34.7 65.3 60.8 39.2 48.9 19.2 26.8 5.0 8.1 55.0 36.8 13.7 67.0 19.0 0.3 36.1 63.9 29.2 70.8 56.3 43.7 56.1 43.9 35.3 64.7 Table 1. General characteristics of the sample.
P
o
r
the family, since the intention was to obtain the characteristics of the sample. The majority of the employees had successfully completed secondary education and a considerable proportion, 36.8%, had at least started higher education.
Body mass index was used as a proxy for nutritional status, showing that approximate-ly 64.0% of the workers interviewed were over-weight or obese, which is a higher proportion than that observed among the adult population living in the urban districts of the city of Pelotas,
RS, Brazil (53.0%)21. Overweight and obesity are
associated with greater deposition of abdominal fat, which, in turn, increases the likelihood of on-set of a large number of different chronic diseases, such as hypertension, hyperlipidemias, gallstones,
type II diabetes and some types of cancer22.
In the present study, having a BMI classiied within the healthy weight category was
signii-cantly associated with a higher frequency of sat-isfaction with health status PR = 1.478 (95% CI: 1.272 – 1.717).
In another study, conducted with 2,022 adults from the Brazilian State of Santa Catarina, it was found that a lower proportion of women reported a positive self-perception of their own health, particularly women who were classiied as overweight or obese and/or who had a large waist
circumference20. Those indings are in agreement
with the results of the present study, but it should be noted that the cutoff points for WC adopted in that study were higher than those used in the present investigation, and for this reason these results should be interpreted with care. It is also of note that the women in the present study were more susceptible to exhibiting a higher frequency of metabolic dysfunctions and this may at least in part be because of the greater proportion of
Variables
Sex Woman Men p‡
BMI
Overweight/obesity Healthy weight p‡
Waist Circumference Moderate/high risk Low risk
p‡
Waist/Hips Ratio Excessive Normal p‡
Arterial blood pressure Not ideal
Ideal p‡
Physical activity habits Irregularly active Physically active p‡
Satisfied (%)
53.2 75.0 <0.001
52.7 75.2 <0.001
54.3 76.6 <0.001
54.2 65.9 0.021
59.9 61.5 0.748
60.2 61.9 0.735
Table 2. Associations between self-perceived health status and sex, indicators of adiposity, arterial blood pressure and physical activity habits.
Crude PR (95%CI%)
Ref. 1.409 (1.210 – 1.642)
Ref. 1.427 (1.225 – 1.664)
Ref. 1.411 (1.214 – 1.640)
Ref. 1.215 (1.025 – 1.440)
Ref. 1.027 (0.872 – 1.209)
Ref. 1.030 (0.871 – 1.217)
Adjusted PR (95%CI%)
Ref.*
1.461 (1.258 – 1.696)
Ref.†
1.478 (1.272 – 1.717)
Ref.†
1.323 (1.135 – 1.541)
Ref.†
1.190 (1.008 – 1.405)
-Workers at the University Hospital in Londrina, PR, Brazil, 2010. *Adjusted for BMI category; † Adjusted for sex; ‡ P value according to Pearson’s chi-square test; PR: Prevalence ratio.
aúd
e C
ole
tiv
a,
21(4):1113-1122,
2016
central fat buildup. Furthermore, those workers who had a WC that was classiied as conferring low risk were more satisied with their health PR = 1.323 (95% CI: 1.135 – 1.541).
The WC measurement is an indicator of metabolic risk that has been widely publicized
by a number of international15 and Brazilian
en-tities23. Presence of excess abdominal fat is an
independent predictor of risk factors and mor-bidity, since it has a positive correlation with abdominal fat content, which in turn can make the emergence of cardiovascular problems more
likely15.
A study conducted by Mota et al.24 assessing
273 people of both sexes from the municipal district of Botucatu, SP, Brazil, with a mean age of 53 years, found that WC was the variable that had the greatest inluence on the metabolic ab-normalities under investigation. People who had excessive or very excessive WC exhibited
high-er fasting concentrations of glucose (p < 0.05),
triacylglycerol (p < 0.0001), total cholesterol (p
< 0.05), non-HDL cholesterol (p < 0.001) and
LDL-c (p < 0.05) than those classiied with
nor-mal WC and had lower HDL-c concentrations (p
< 0.001).
Overall, 39.2% of the hospital workers were not satisied with their health. Self-perceived health was associated with sex with PR = 1.461 (95% CI: 1.258 – 1.696), since a signiicantly higher proportion of women than men reported not being satisied with their health, which has
also been observed by Barros et al.25 in all
Bra-zilian capitals, in an analysis of the “VIGITEL” telephone survey for surveillance of risk and protection factors for chronic diseases, in studies
conducted by Reichert et al.3 and by Nery
Guim-arães et al.9. This could indicate that women are
more aware of their true health status, with the result that their data was more compatible with the indicators of adiposity observed, of which BMI appears to be the most important, since it exhibited the strongest association with self-per-ceived health.
The percentage of people who self-rate their health as poor or very poor increases consider-ably as chronological age increases, with lower educational levels and the higher the number of diseases reported, both among men and among women. Although women state that they are less satisied with their health, in the presence of two or more morbidities, PR values are higher among
men2,25. It appears that men’s perception of their
own health in the presence of an NTCD is worse than women’s.
As the body ages, there is a notable increase in the frequency of people who self-report health as poor or very poor, when compared with young-er people. In a study conducted in Poland, just 4% of men and 10% of women aged less than 25 years self-rated their health as poor or very poor, whereas in the 44 to 54 age range this proportion
increased to over 40%26.
Almost half of the sample studied in this in-vestigation work for the Nursing Department (48.9%) and 86.0% of these were women. The lifestyle of healthcare professionals has been the
subject of study for decades27, possibly because of
the peculiarities of their jobs.
Starting in 1976, a cohort study entitled The Nurse’s Health Study was conducted in the Unit-ed States in the state of Massachusetts with the objective of constructing a model to provide an understanding of the impact of several different risk factors on given causes of mortality. Every 2 years the nurses were sent questionnaires con-taining questions on lifestyle and health risk be-haviors. Later on questions on dietary and phys-ical activity habits were also added. Complete data on 50,112 participants were computed from 1986 onwards and analyzed up to 2004. During this period there were 4,893 deaths, 1,026 of which were from cardiovascular diseases (heart disease, cerebrovascular disease, etc.). Systolic blood pressure (SBP) was positively associated with increased risk of death from these diseases, raising the incidence (Hazard Ratio-HR) from 1.25 (95% CI = 1.06 - 1.48) when SBP was up to 139 mmHg to 2.58 (95% CI = 1.91 - 3.49) when
it was ≥ 160 mmHg27.
Reinforcing these indings, Nery Guimarães
et al.9 found that diseases of the circulatory
sys-tem were the main cause of deaths (30%) in a cohort recruited from the employees of a public university in the Brazilian state of Rio de Janeiro and followed for 10 years.
A study conducted by Peres et al.20 found that
when blood pressure readings were high, low-er proportions of people self-rated their health positively, but a similar association was not ob-served in the present study. It is possible that the
association was detected in that study20 because
the cutoff points chosen to classify elevated BP were higher than those used in the present study, which could have resulted in symptomatic he-modynamic and vascular abnormalities affecting the way the participants perceived their health.
report-P
o
r
ed that they were satisied with their health, even though many did not have ideal blood pressure.
There was also no association between
self-perceived health and PA habits (p = 0.735),
but it is known that daily engagement in mod-erate intensity PA is inversely related to risk of death from many different causes, with HR =
0.76 (95% CI = 0.66 -0.86) 27, and so it appears
salutary to increase the frequency of exercise to increase its protective effect and in turn improve
self-rated health status28.
Among adults, studies undertaken in other
countries26,28 have demonstrated that there is a
direct and independent association between the practice of physical activity and better self-per-ceived health.
A European study using information provid-ed by the Swprovid-edish government from its 1999 cen-sus analyzed a sample of 3,756 people aged 25 to 64, inding that just 4.3% of the sample was phys-ically inactive, considering all domains of PA. Physical exercise (PE) and PA were independent-ly associated with reports of good self-perceived health and the likelihood of improving self-per-ception increased approximately three times OR = 3.04 (95% CI = 2.10 - 4.39) with regular PE
and when total PA was ≥ 6 hours per week28.
In Brazil, in the most recent VIGITEL tele-phone survey for surveillance of risk and pro-tection factors for chronic diseases, irregular PA is deined as when the sum of the number of minutes spent on physical activities in free time, during active transport to work or school and in occupational activity do not reach the equivalent
of 150 minutes per week29. The same cutoff point
was also adopted for the present investigation, but it should be emphasized that even so the preva-lence of irregular PA among the UH employees was still greater than the prevalence observed in the city of João Pessoa (54.4%), which was the Brazilian state capital with the highest prevalence of irregular PA, where rates were 46.1% for men and 61.3% for women. Among the UH employ-ees, prevalence rates were 58.2% for men and 68.0% for women.
It should be remembered that the question used in the present study to collect worker’s self-perceived health status was extracted from an instrument recommended by the World Health Organization, which has been administered and
validated in Brazil by Fleck et al.12, and this
con-tributes to comparability with data observed in other countries.
While self-perceived health status is a sim-ple item of information, it has a well-established association with mortality. People who perceive their health as “poor” exhibit two to three times greater risk of death than those who perceive
their health as “excellent”6,8,9. In other words, the
associations that have been found with health risk factors underscore the utility of this infor-mation.
With relation to the interviews, it is of note that all were conducted by just two researchers and that they took place at the interviewees’ own workplaces, because the sample included people doing different jobs and on different shifts, but this did not interfere with the analyses.
One limitation of this study is its cross-sec-tional design, which means that no relationships of causality can be established between the vari-ables analyzed. It therefore appears an appropri-ate suggestion for future studies to analyze these associations with prospective study designs.
Another point that should be mentioned is that, although every effort was made to ensure that interviews were equally distributed across the three shifts (morning, afternoon and night), the largest number of interviews took place during the day shift. Night shift workers were on a rolling shift system and in some cases ap-pointments were made to conduct the interviews during their next shift on duty, but because of scheduling incompatibilities sometimes this was not possible.
aúd
e C
ole
tiv
a,
21(4):1113-1122,
2016
Collaborations
DB Porto and GA de Arruda were responsible for the study objectives and design, collection and analysis of data, statistical treatment, interpreta-tion of data and drafting the article; LR Altimari and CG Cardoso Júnior performed critical re-view of the article and approved the inal version submitted for publication.
Fleck MPA, Louzada S, Xavier M, Chachamovich E, Vieira G, Santos L, Pinzon V. Aplicação da versão em português do instrumento abreviado de avaliação da qualidade de vida “WHOQOL-bref ”. Rev Saude Publica 2000;34(2):178-183.
Peixoto MRG, Benício MHD, Jardim PCBV. Validade do peso e da altura auto-referidos: o estudo de Goiânia. Rev Saude Publica 2006;40(6):1065-1072.
World Health Organization (WHO). Obesity: prevent-ing and managprevent-ing the global epidemic: report of a WHO consultation. Geneva: WHO; 2000. WHO technical re-port series 894.
National Institutes of Health. National Heart, Lung, and Blood Institute (NHLBI). Obesity education ini-tiative expert panel on the identification, evaluation and treatment of overweight and obesity in adults:the evi-dence report 1998. Bethesda: NHLBI; 1998.
Pouliot MC, Després JP, Lemieux S, Moorjani S, Bouch-ard C, Tremblay A, Nadeau A, Lupien PJ. Waist circum-ference and abdominal sagittal diameter: best simple anthropometric indexes of abdominal visceral adipose tissue accumulation and related cardiovascular risk in men and women. Am J Cardiol 1994; 73(7):460-468. Pickering TG, Hall JE, Appel LJ, Falkner BE, Graves J, Hill MN, Jones DW, Kurtz T, Sheps SG, Roccella EJ. Recommendations for blood pressure measurement in humans and experimental animals. Part 1: Blood pressure measurement in humans. A statement for pro-fessionals from the subcommittee of professional and public education of the American Heart Association Council on High Blood Pressure Research. Hyperten-sion 2005;45(1):142-161.
Craig CL, Marshall AL, Sjostrom M, Bauman AE, Booth ML, Ainsworth BE, Pratt M, Ekelund U, Yngve A, Sallis JF, Oja P. International physical activity ques-tionnaire: 12-country reliability and validity. Med Sci Sports Exerc 2003; 35(8):1381-1395.
Matsudo SM, Matsudo VR, Araújo T, Andrade D, An-drade E, Oliveira L, Braggion G. Nível de atividade fí-sica da população do estado de São Paulo: análise de acordo com o gênero, idade, nível socioeconômico, distribuição geográica e de conhecimento. R Bras Ci e Mov 2002; 10(4):41-50.
12.
13.
14.
15.
16.
17.
18.
19. References
Gilbert L. Social factors and self-assessed oral health in South Africa. Community Dent Oral Epidemiol 1994; 22(1):47-51.
Barreto SM, Figueiredo RC. Doença crônica, auto-ava-liação de saúde e comportamento de risco: diferença de gênero. Rev Saude Publica 2009; 43(Supl. 2):38-47. Reichert FF, Loch MR, Capilheira MF. Autopercepção de saúde em adolescentes, adultos e idosos. Cien Saude Colet 2012; 17(12):3353-3362.
Jia Y, Gao J, Dai J, Zheng P, Wu X, Li G, Fu H. Differ-ence of the associations between self-rated health and demographic characteristics, lifestyle, and psychoso-cial work environment between two types of Chinese worksite. BMC Public Health 2014; 14:851.
Bak CK, Andersen PT, Dokkedal U. The association between social position and self-rated health in 10 deprived neighbourhoods. BMC Public Health 2015; 15:14.
Prazeres F, Santiago L. Prevalence of multimorbidity in the adult population attending primary care in Portu-gal: a cross-sectional study. BMJ Open 2015; 5(9):1-10. Miilunpalo S, Vuori I, Oja P, Pasanen M, Urponen H. Self-rated health status as a health measure: the predic-tive value of self-reported health status on the use of physician services and on mortality in the working-age population. J Clin Epidemiol 1997; 50(5):517-528. DeSalvo KB, Bloser N, Reynolds K, He J, Muntner P. Mortality prediction with a single general self-rated health question. A meta-analysis. J Gen Intern Med 2006; 21(3):267-275.
Nery Guimarães JM, Chor D, Werneck GL, Carval-ho MS, Coeli CM, Lopes CS, Faerstein E. Association between self-rated health and mortality: 10 years fol-low-up to the Pró-Saúde cohort study. BMC Public Health 2012; 12:676.
Instituto Brasileiro de Geograia e Estatística (IBGE). Pesquisa Nacional por Amostra de Domicílio: acesso e utilização de serviços de saúde: 2003. Rio de Janeiro: IBGE; 2005.
Associação Brasileira de Empresas de Pesquisa (ABEP) 2008. [acessado 2009 Jul 13]. Disponível em: http:// www.abep.org/novo/Content.aspx?ContentID = 302 1.
2.
3.
4.
5.
6.
7.
8.
9.
10.
P
o
r
Peres MA, Masiero AV, Longo GZ, Rocha GC, Matos IB, Najnie K, Oliveira MC, Arruda MP, Peres KG. Au-to-avaliação da saúde em adultos no Sul do Brasil. Rev Saude Publica 2010; 44(5):901-911.
Olinto MTA, Nácul LC, Dias-da-Costa JS, Gigante DP, Menezes AMB, Macedo S. Níveis de intervenção para a obesidade abdominal: prevalência e fatores associados. Cad Saude Publica 2006; 22(6):1207-1215.
Bray GA. Classiication and evaluation of the obesities. Med Clin North Am 1989; 73(1):161-184.
Associação Brasileira para o Estudo da Obesidade e da Síndrome Metabólica (ABESO). Diretrizes brasileiras de obesidade 2009/2010. 3ª ed. São Paulo: AC Farma-cêutica; 2009. [acessado 2014 dez 10]. Disponível em: http://www.abeso.org.br/pdf/diretrizes_brasileiras_ obesidade_2009_2010_1.pdf
Mota JF, Rinaldi AEM, Pereira AF, Orsatti FL, Burini RC. Indicadores antropométricos como marcadores de risco para anormalidades metabólicas. Cien Saude Co-let 2011; 16(9):3901-3908.
Barros MBA, Zanchetta LM, Moura EC, Malta DC. Au-to-avaliação da saúde e fatores associados, Brasil, 2006. Rev Saude Publica 2009; 43(Supl. 2):27-37.
Kaleta D, Polańska K, Dziankowska-Zaborszczyk E, Hanke W, Drygas W. Factors inluencing self-percep-tion of health status. Cent Eur J Public Health 2009; 17(3):122-127.
Baer HJ, Glynn RJ, Hu FB, Hankinson SE, Willett WC, Colditz GA, Stampfer M, Rosner B. Risk factors for mortality in the nurses’ health study: a competing risks analysis. Am J Epidemiol 2011; 173(3):319-329. Södergren M, Sundquist J, Johansson SE, Sundquist K. Physical activity, exercise and self-rated health: a pop-ulation-based study from Sweden. BMC Public Health 2008; 8:352.
Brasil. Ministério da Saúde (MS). Secretaria de Vigilân-cia em Saúde. Vigitel Brasil 2013:vigilância de fatores de risco e proteção para doenças crônicas por inquérito telefônico. Brasília: MS; 2014.
Article submitted 14/07/2015 Approved 17/12/2015
Final version submitted 19/12/2015 20.
21.
22. 23.
24.
25.
26.
27.
28.